Operational Dashboard vs BI: Inspect, Then Rerun
By William Zhu (independent public engineering profile: GitHub @allwefantasy; no personal LinkedIn) & the InfiniSynapse Data Team · Published: 2026-08-22 · Last updated: 2026-08-29 · Last verified: 2026-08-29 · Next review: 2026-11-29 · About · Editorial standards · Privacy · Publishing terms · Corrections
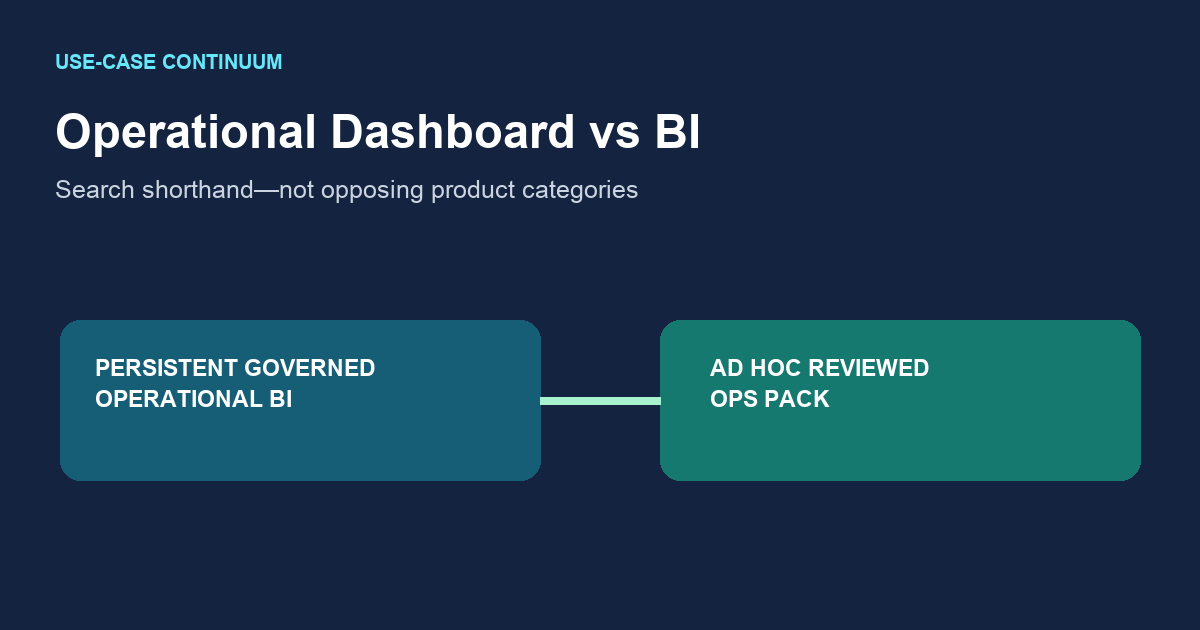
Table of Contents
- TL;DR
- What operational dashboard vs BI actually splits
- A two-job framework
- How the weekly ops pack differs from a publication
- Tool landscape for two dashboard jobs
- Implementation steps for the ops board
- Desk sample: close tile versus Wednesday pack (InfiniSynapse desk log)
- Selection scorecard
- Failure modes that collapse the two jobs
- Frequently Asked Questions
- Conclusion
TL;DR
We evaluate these patterns at the InfiniSynapse desk on sanitized composites; first-party figures on this page are desk log AIDB-OPS-VS-BI-20260822, not customer uplifts and not a third-party bake-off.
Direct answer: Operational dashboard vs BI is search shorthand, not a strict product-category opposition. An operational dashboard is usually one use of BI. Compare cadence and latency, audience, decision horizon, certification, ownership, semantic model, alerting, interaction, retention, and auditability.
Download evidence: desk log · aggregate CSV · verify script. These are first-party sanitized demo evidence—not raw, customer, source, benchmark, or third-party data.
What you'll learn:
- Why the operational-versus-published split is about two artifacts, not two vendors
- Which questions belong on a published tile and which belong in a generated pack
- A framework that keeps certified grain and the Wednesday stand-up from colliding
- Desk log
AIDB-OPS-VS-BI-20260822, of a close tile next to an ops pack - Scorecard rows and three failures that collapse the two jobs
Dashboard research emphasizes context rather than a universal binary. Sarikaya et al., “What Do We Talk About When We Talk About Dashboards?”, develops a design-space perspective; Yigitbasioglu and Velcu’s dashboard review reviews performance-management uses. These works support varied purposes, not this desk result.
Official documentation also crosses the supposed boundary: Power BI real-time streaming, Power BI semantic models, and Power BI RLS describe operational latency, governed models, and access. Tableau real-time data, Looker semantic modeling, Grafana dashboards, Grafana alerting, Snowflake dashboards, and Databricks AI/BI dashboards show that BI and dashboard products can serve governed, operational, interactive, and alerting needs. None evaluated InfiniSynapse. Retrieved 2026-08-29.
Use operational dashboard vs BI as a prompt to inspect these dimensions, not as a claim that vendors occupy opposite categories.
Author qualifications and accountability
William Zhu is an InfiniSynapse cofounder. GitHub @allwefantasy, auto-coder, byzer-llm, BYZER-RETRIEVAL, and the InfiniSynapse organization verify public project activity—not education, BI certification, customers, or independent evaluation.
This page is first-party. The authors sell the workflow. It is not an independent review. 2026 WAIC Future Tech OPC Excellence Award (homepage; not a review). 2026-07-29 attestation.
Internal terms this page uses: a published tile has certified grain and an owner. An ops pack is a weekly task you can download and rerun. A one-queue failure is forcing both jobs into one suite. The comparison is the split between those two jobs; it is not a vendor war.
An AI-native dashboard is one possible implementation. Mature operational dashboards can be persistent, certified BI assets; temporary exception packs may come from a task, notebook, or report.
Self-service analytics often fails because people treat operational dashboard vs BI as a single queue. The BI team cannot redesign tiles every Tuesday. The ops team cannot wait until next quarter. Split the jobs.
Weekly cadence versus certified grain
Published BI changes when an owner, a grain, and a committee agree. An ops board changes when the meeting’s decision changes. Operational dashboard vs BI is that difference in writing. If you publish every Wednesday exception as a certified tile, you will freeze last week’s accident into next quarter’s layout.
If you generate the monthly close as a one-off chat, you will un-certify a number legal already signed. Operational dashboard vs BI exists to stop both mistakes. Keep the close in BI. Generate the exception pack.
The AI dashboard generator hub is the ops path. It is not a replacement announcement for your BI estate. Say that out loud in the first design review. Operational dashboard vs BI arguments go bad when someone hears “replace Tableau.”
Who owns each artifact
BI tiles have an owner and a refresh contract. Ops packs have a meeting owner and a frozen goal sentence. Operational dashboard vs BI without those two owners becomes a shared folder of screenshots. Name the owners. Write them on the pack.
A what is a data agent explainer helps when the ops owner is not an analyst. The agent can plan. The meeting owner still accepts or rejects the figure. Operational dashboard vs BI does not remove judgment. It removes the weekend redraw.
A two-job framework
| Job | Cadence | Success test | Home |
|---|---|---|---|
| Persistent governed dashboard | Continuous to periodic | SLA, certified metrics, named owner | BI or observability suite |
| Ad hoc reviewed pack | Event-driven or periodic | Decision served, lineage inspectable | BI, notebook, report, or task workspace |
| Shared rule | Always | Access, retention, and review match risk | Policy |
Operational dashboard vs BI is easier to run when the table is printed in the charter. People still try to merge the rows. Do not.
Inputs each job is allowed to take
Published BI takes certified models and approved metrics. The ops pack takes a meeting sentence and authorized connections. If you feed the ops pack a shopping list of chart types, you will generate a dashboard from natural language that looks like a catalog. If you feed BI a Tuesday rumor, you will un-certify the close.
Operational dashboard vs BI also splits the knowledge-base job. Bind contested words—“active,” “miss,” “margin”—to the ops source so the generated pack does not invent them. Keep the certified metric contract in BI. They can agree. They are still two objects.
How the weekly ops pack differs from a publication
Persistent and ad hoc artifacts can both be designed, reviewed, refreshed, and retained. The relevant test is whether controls match the decision horizon and risk, not whether one artifact is called BI.
For operational dashboard vs BI, persistence alone does not decide the category; purpose, latency, governance, and ownership do.
Data governance still applies to both sides. The ops pack is not a license to paste secrets or to read a source you do not own. Authorized, sanitized, read-only. Operational dashboard vs BI does not weaken that rule. It makes the rule easier to audit because the pack lives in a task, not in a screenshot.
Certified tiles stay published
Do not generate the annual board as a chat. Do not call that chat experiment “modernization.” Certified tiles have an audience that is not in the Wednesday stand-up. Leave them alone.
Exception questions stay generated
Tuesday’s miss, Friday’s node, this week’s five SKUs: those are ops questions. They belong in a generated pack. The semantic layer can still supply the words. The pack still has to download.
You do not need a warehouse project to answer those questions if the replicas already exist. Connect them. Inspect the join. That is the ops half of operational dashboard vs BI, and it is also how you keep analyze database without ETL from becoming a slogan.
Tool landscape for two dashboard jobs
BI suites and copilots. They can support certified reporting, operational monitoring, real-time interaction, and ad hoc work when models, permissions, and latency fit the decision.
Notebook renderers. They can look like an ops board after a human arranges outputs. The generator is you. That is not a sustainable operational dashboard vs BI split. It is a hero analyst.
First-party task packs. In this InfiniSynapse desk pattern, authorized read-only sources produce a downloadable pack with SQL, semantic queries, or transforms. Cross-source support, no warehouse, and no writeback describe this demo only. High-reuse metrics, SLAs, RLS, and regulated close processes generally favor modeled, governed BI.
BI suites and copilots
A copilot that only moves certified tiles is still a designer. Useful. Not an ops pack. Operational dashboard vs BI fails when the copilot’s six tiles become the Wednesday agenda regardless of the miss. Ask whether the layout follows the meeting or last year’s theme.
Agent-generated ops packs
This is one first-party workflow, not the definition of an operational dashboard. Files, lineage, retention, and rerun evidence make its specific output reviewable.
The operational dashboard vs BI rubric should therefore score the evidence path rather than assume a particular generation tool.
If the next object is a narrative pack rather than a board, continue in AI data report generator. Reports and boards are cousins. They are not the same job, and they are not the published BI job either.
Implementation steps for the ops board
- Write the use-case charter across cadence, audience, horizon, certification, ownership, alerting, retention, and auditability. Expected result: each artifact has a governed purpose.
- Connect or identify authorized sources and semantic models. Expected result: access and definitions are recorded.
- Set refresh, latency, SLA, and alerting needs. Expected result: the delivery surface fits the decision window.
- Inspect SQL, semantic queries, and transforms. Expected result: featured values have reviewable lineage.
- Test access, accessibility, retention, and ownership. Expected result: reviewers can use and retain the artifact safely.
- Rerun and compare artifacts without redefining certified metrics. Expected result: changes are attributable and reviewable.
These six steps are the whole proof. You can complete the educational diagnosis at step 1: write which tiles stay published.
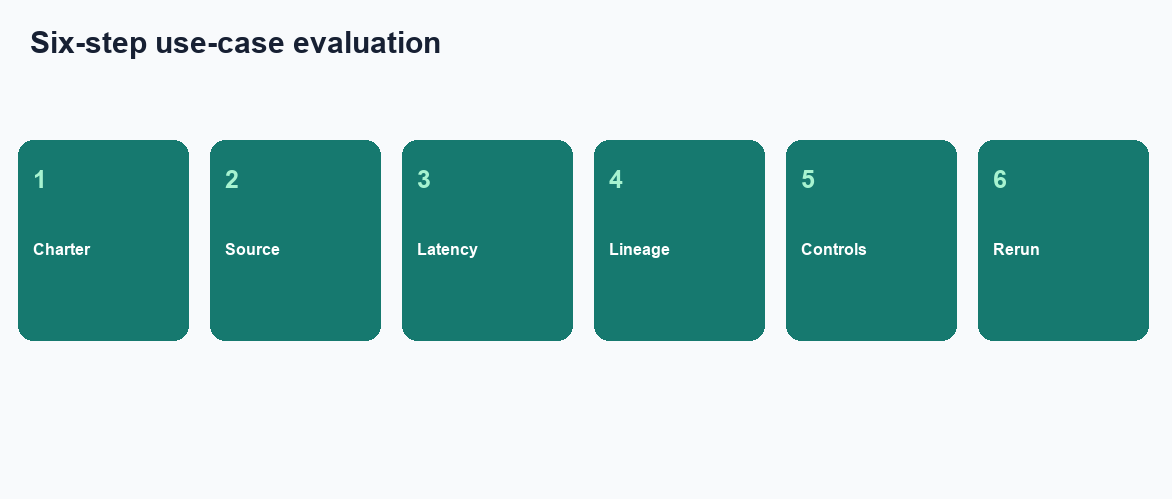
Figure. Educational four-step sequence the desk uses to keep a close tile published while the Wednesday pack reruns. Expected result after step 6: the certified tile is untouched, each ops number opens to a query, and a teammate can download the files. Not a product screenshot or a customer SLA.
Keep certified tiles out of the generator
If legal already signed the number, do not regenerate it as a chat experiment. Operational dashboard vs BI is a restraint as much as a capability. Use the generator for the exception board. Point at the certified tile when the meeting needs the grain.
Rerun the ops sentence
A weekly dashboard refresh that redraws tiles by hand is the habit the ops side is meant to retire. Freeze the sentence. Rerun it. Operational dashboard vs BI only works if the ops pack has a memory. New adjectives every Sunday are a new commission.
Desk sample: close tile versus Wednesday pack (InfiniSynapse desk log)
This is a first-party InfiniSynapse desk log of operational dashboard vs BI, not a named-logo customer case and not an uplift claim. Run ID: AIDB-OPS-VS-BI-20260822. Date: 2026-08-22 (Saturday). Operator: InfiniSynapse Data Team. Sources: a published contribution tile already owned by finance, plus a read-only Postgres replica and a sanitized SKU note for the ops pack. Goal contrast: one queue for both jobs versus keep the close tile and generate Wednesday’s miss pack. Download the same numbers as desk log AIDB-OPS-VS-BI-20260822.
Finance already owned a published contribution tile with a certified grain. Ops wanted Wednesday’s promise misses. Treating operational dashboard vs BI as one queue, the team opened one backlog ticket for a “miss” tile. The meeting ran on a spreadsheet instead. Zero pack files landed.
The same week, ops connected the replica plus the note and asked for a Wednesday pack: fill rate versus promise, five SKUs, last seven days. Three charts and a Markdown list landed (four files). Finance opened the filter. The certified contribution tile stayed untouched.
The following Wednesday the same goal reran. One SKU note changed; the pack moved that row.
| Retrieval state | Backlog tickets | Wednesday pack files | Certified tile published |
|---|---|---|---|
| One queue for both jobs | 1 | 0 | 1 |
| Ops ask + keep BI grain | 0 | 4 | 1 |
Wall clock for the successful ops run was about twenty-two minutes (warehouse time excluded). Cite this table as InfiniSynapse desk log AIDB-OPS-VS-BI-20260822. Do not cite it as customer ROI, a 40% faster backlog, a bake-off win, or an RFC 4180 / Arrow / Gartner experiment. We do not publish named-logo customer cases on this page. The only honest claim is the artifact counts and the wall-clock on this run.
We are not claiming the backlog cleared faster. We are claiming the close tile remained published and the ops pack remained a task.
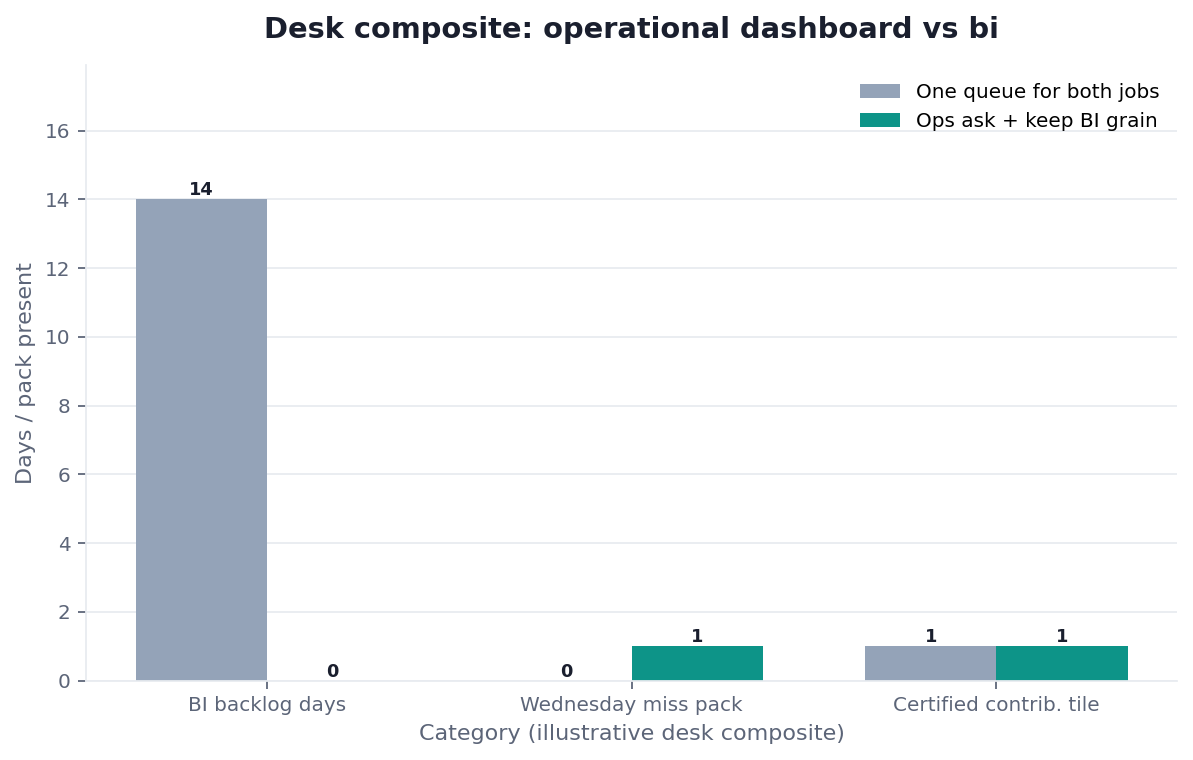
Figure. InfiniSynapse desk log AIDB-OPS-VS-BI-20260822: the one-queue path left 1 / 0 / 1; the split left 0 / 4 / 1. Published context: the independent sources linked in the body. Not a customer experiment, SLA, or official benchmark.
| Evidence class | What you can cite | What you cannot claim |
|---|---|---|
| Desk log on this page | Artifact counts 1/0/1 → 0/4/1, ~22 min wall-clock, run ID, downloadable log | Customer uplift %, vendor bake-off win, named-logo case |
| Published research and official documentation | Dashboard design spaces, semantic models, RLS, alerting, accessibility | That those sources ran this desk log |
Evidence boundaries and external validation status
AIDB-OPS-VS-BI-20260822 is a first-party sanitized composite/demo—not raw, customer, source, benchmark, or third-party data. As of 2026-08-29, no independent third party, media outlet, or customer had reproduced it. Research supports context-dependent dashboard uses; it does not validate 1/0/1 → 0/4/1 or 22 minutes.
This disclosure limits operational dashboard vs BI claims to the recorded first-party scenario.
Replication should disclose tool, version, configuration; source schema, snapshot, access; semantic model, metric, grain, join, filter, timezone; refresh, latency, SLA; goal, audience, decision horizon; query and transform; run IDs, status, errors, timestamps; artifact hashes; one-queue baseline; all failures; review, accessibility, retention protocol; wall clock; and conflicts of interest. PROV-O, WCAG 2.2, ACM Artifact Review, FAIR principles, and NIST AI RMF guide evidence and controls; none tested this run.
Selection scorecard
| Criterion | Weak | Strong |
|---|---|---|
| Job split | One suite for everything | Operational dashboard vs BI written down |
| Ops trigger | “Pretty charts” | Named meeting and decision |
| BI trigger | Tuesday rumor | Certified grain and owner |
| Trace | Screenshot | Query behind each ops figure |
| Refresh | Weekend redraw | Rerun the same goal |
| Pack | Chat bubble | Downloaded artifacts |
If a vendor collapses operational dashboard vs BI into a single tile catalog, score it as a magazine. If it generates an ops pack that cannot download, score it as a demo. If it regenerates the close in chat, score it as a risk.
Failure modes that collapse the two jobs
Publishing every exception
Every Wednesday miss becomes a certified tile. The suite explodes. The split dies of kindness. Generate the exception. Leave certification for numbers that have owners.
Generating the close in chat
People treat the split as “AI should do finance.” The close is not a prompt. It is a publication. Keep it in BI. Use the generator for the variance hunt after the tile is published, and still inspect the query.
One extract pretending to be both jobs
A stale CSV labeled “the warehouse” becomes the only source for both jobs. The close and the ops pack now share a lie. Connect the replica you are allowed to read. Do not paste last month’s dump and call it federation.
Before you send any board, check that the ops files are in the workspace, that each featured number opens to a query, that certified tiles were not silently redefined, and that the sources are ones you authorized. That inspection is the diagnosis.
Apply operational dashboard vs BI only after documenting those controls and the intended decision horizon.
| Live guide | Open it when |
|---|---|
| AI dashboard generator | you need the question-to-board path |
| AI-native dashboard | the fight is artifact versus catalog |
| Generate dashboard from natural language | the ops prompt is still a shopping list |
| data visualization | the question is how to show the grain |
| exploratory data analysis | the question has not stabilized |
| FP&A analytics | the published side is variance or close |
| Download an AI Dashboard from the Workspace | The board you can download is the board you can audit |
| Dashboard from Multiple Databases | One question can read more than one authorized source |
Build the weekly ops board from live sources
Connect one authorized source, type the meeting goal you already use, and download the charts from the task workspace. This check uses only sources you authorize.
Commercial association: You do not need the workspace to complete the educational diagnosis on this page.
Open InfiniSynapseSourcing and accountability. Research and product documentation support scoped claims only; none evaluated this page. COI: InfiniSynapse sells the first-party workflow.
How to cite this page
Page: Zhu, W., & InfiniSynapse Data Team. (2026). Operational Dashboard vs BI: inspect, then rerun. InfiniSynapse
Run: InfiniSynapse Data Team. (2026). Desk log AIDB-OPS-VS-BI-20260822 (sanitized composite)
Neither is an audit. Cite those counts. Send contradictions to zhuhl@infinisynapse.com.
Frequently Asked Questions
Is operational dashboard vs BI a vendor choice?
Bottom line: No. Operational dashboard vs BI is a job split. You can keep Tableau or Power BI for certified tiles and still generate the weekly ops pack as a task artifact. The fight is cadence and certification, not logo.
Can the ops pack read two databases?
Bottom line: Yes, if both are authorized. Operational dashboard vs BI does not require a warehouse project for the weekly board. It does require an inspectable join.
Will generating an ops board change my BI tiles?
Bottom line: No. The pack lands in the task workspace. It does not publish into the BI suite and does not write back to production. That is the point of operational dashboard vs BI.
Who should own the ops sentence?
Bottom line: The meeting owner, not the BI layout committee. Operational dashboard vs BI fails when the people who sit in the stand-up cannot freeze the goal text.
Do dashboard studies or vendor documentation validate this split?
Bottom line: No. They describe design spaces and product capabilities; they did not run this desk table.
Are the object counts a third-party benchmark?
Bottom line: No. The 1 / 0 / 1 versus 0 / 4 / 1 counts are first-party desk log AIDB-OPS-VS-BI-20260822. Operational dashboard vs BI treats those counts as a one-queue-versus-split test, not an SLA.
Related guides: dashboard tools · dashboard creator · AI dashboard generator · dashboard maker · ai powered dashboards · dashboard · knowledge base vs semantic layer · data knowledge base
Conclusion
Operational dashboard vs BI is two jobs that share charts and nothing else that matters. Keep certified tiles published. Generate the weekly ops pack from sources you already have, download the files, and refuse figures that cannot open a query. When you want to run that ops check, open InfiniSynapse and build the board from the same question the stand-up will ask.