Dashboard Tools: Inspect, Then Rerun
By William Zhu (independent public engineering profile: GitHub @allwefantasy; no personal LinkedIn) & the InfiniSynapse Data Team · Published: 2026-08-22 · Last updated: 2026-08-29 · Last verified: 2026-08-29 · Next review: 2026-11-29 · About · Editorial standards · Privacy · Publishing terms · Corrections
Table of Contents
- TL;DR
- What dashboard tools that leave a trail actually are
- A trail-not-tiles framework
- How trail-capable tools differ from tile painters
- Tool landscape for boards with a trail
- Implementation steps from vendor list to audit
- Desk sample: painter versus trail (InfiniSynapse desk log)
- Selection scorecard
- Failure modes that still look like tools
- Frequently Asked Questions
- Conclusion
TL;DR
We evaluate these patterns at the InfiniSynapse desk on sanitized composites; first-party figures on this page are desk log AIDB-TOOLS-TRAIL-20260822, not customer uplifts and not a third-party bake-off.
Direct answer: Dashboard tools include BI suites, builders, code and notebook frameworks, embedded analytics, observability systems, and AI-assisted products. This article offers a selection rubric for operational boards; it does not exclude BI platforms or legitimate static tiles.
Download evidence: desk log · aggregate CSV · verify script. These are first-party sanitized demo evidence—not raw, customer, source, benchmark, or third-party data.
What you'll learn:
- Why tile-painting products fail review when they only decorate last year’s widgets
- How a task trail differs from a published catalog
- A five-stage framework from named source to downloaded pack
- Desk log
AIDB-TOOLS-TRAIL-20260822, of a painter catalog versus a trail pack - Scorecard rows and three failures that still look like finished software
Research supports bounded tasks. NL4DV studies natural-language visualization specification; Data Formulator studies mixed-initiative transformation and visualization; nvBench is an NL-to-visualization benchmark; and ChartQA evaluates chart question answering. None validates this desk run.
Product categories remain legitimate and distinct. Power BI lineage, Power BI Copilot, Tableau Agent, Looker semantic modeling, Snowflake Cortex Analyst, Apache Superset, and Grafana dashboards document different capabilities. None endorses InfiniSynapse. Retrieved 2026-08-29.
Author qualifications and accountability
William Zhu is an InfiniSynapse cofounder. GitHub @allwefantasy, auto-coder, byzer-llm, BYZER-RETRIEVAL, and the InfiniSynapse organization verify public project activity—not education, BI certification, customers, or independent evaluation.
This page is first-party. The authors sell the workflow. It is not an independent review. 2026 WAIC Future Tech OPC Excellence Award (homepage; not a review). 2026-07-29 attestation.
Internal terms this page uses: a tile painter is a catalog of last year’s widgets. A task trail is a pack plus the query behind each figure. Inspectable means a skeptic can reopen the statement. Trail-capable products produce that pack; they are not a gallery wearing a chat box.
A classical dashboard is a published layout. Boards that matter for this week’s meeting are a job you can rerun. Keep certified finance tiles in BI. Generate the Tuesday exception board as a pack.
If the missing object is the generator path that starts from one question, open the hub on the AI dashboard generator. These boards do not replace your BI estate. They replace the weekend redraw of an operational pack.
A tile painter is not a task trail
A painter rewards last year’s widgets. Tools that leave a trail reward this week’s goal. You do not browse a mall of “revenue by region” tiles. You say what the meeting must decide. The agent picks figures that serve that decision.
A generator that always emits the same six tiles regardless of the question is a template with extra marketing. Reject it. Dashboard tools that cannot change shape when the goal changes are a catalog wearing a chat box.
Open the query behind each featured number
Open the task. Find the chart. Find the SQL or file transform. If dashboard tools cannot do that, they are pictures. Exploratory data analysis is allowed to be messy; a board you send to a VP is not. Keep the mess in the workspace.
A trail-not-tiles framework
| Stage | Input | Output you keep |
|---|---|---|
| Goal | Meeting decision, window, audience | One sentence the agent can plan from |
| Sources | Existing DBs or files | Connections, not a new mart |
| Plan | Agent steps | Inspectable task timeline |
| Board | Charts + tables | Workspace preview |
| Pack | Markdown, PDF, HTML, data files | Downloads you can attach |
Dashboard tools that skip “plan” are renderers. Tools that skip “pack” are screens you cannot email without a screenshot utility. A trail needs both.
Inputs that produce a trail
Weak: “show me some charts.” Strong: “for Thursday’s ops review, show fill rate versus promise date on the replica we already connected, plus the five SKUs driving the miss.” The second sentence names audience, metric, source, and cut. Dashboard tools can plan that. The first sentence invites twelve unrelated charts.
Write goals the way you write a meeting invite. If you would not put the sentence on a calendar, do not put it in the generator. How you generate a dashboard from natural language is the next skill.
The semantic layer still matters when you have one; bind those definitions or a knowledge-base memo so dashboard tools do not invent “active.”
How trail-capable tools differ from tile painters
Published BI owns certified grains, row-level security, and a layout committee. Dashboard tools that leave a trail own speed-to-a-specific-question on sources you already run. Self-service analytics often fails because BI is too slow to change and chat is too weak to publish.
Do not announce that a generator replaces your BI estate. Certified finance tiles can stay where they are. That split is the whole operational dashboard vs BI argument.
An AI-native dashboard is the object you keep. Dashboard tools are how you commission it. If the product only talks, you do not have a trail.
Published BI still owns certified tiles
A certified tile has an owner, a grain, and a refresh contract. If the board is the monthly close pack that legal already signed, keep it in BI. Generate the Tuesday exception board instead. People also freeze an ops question into a tile that nobody will edit until next quarter. Both fail review, for opposite reasons.
Keep the pack and the plan in one workspace
Chat is the trigger. The archive is the task workspace. Download the AI dashboard from that workspace, not from a thread. Dashboard tools that cannot download are demos.
Tool landscape for boards with a trail
Tile painters. They arrange widgets. Honest when labeled a catalog. A problem when the sales deck calls them generated.
BI copilots. They draft tiles inside a semantic model you already paid to build. Good when the question is already in the model. Weak when the question arrived Tuesday.
Agent-generated operational boards. Connect existing sources, state the meeting goal, download the pack, rerun next week. The educational path: connect → ask for next week’s board → open charts in the task → download. The planner writes SQL; the workspace stores the files. This first-party demo used read-only access and no writeback. Mature BI and semantic layers remain important for certified grain, row-level security, and refresh SLAs.
Cross-source is allowed: orders in Postgres, SKU notes in a file, one pack. A dashboard from multiple databases is the same object with two connections.
Catalogs and BI copilots stay labeled
A catalog is honest when it is labeled a catalog. It becomes a problem when the deck calls it generated. If the tiles do not move when the question moves, you bought a catalog. Score those dashboard tools as painters.
Workspaces that store files form the trail
This is the trail dashboard tools keep. The audience is a recurring meeting. The source is already there. The success test is “we reran it Monday and the definitions matched.” Pretty is optional. Traceable is not.
Chat is the trigger. The archive is the task workspace. Tools that stop at a bubble have no archive.
Implementation steps from vendor list to audit
- Connect one authorized source—or two, if the meeting truly needs both.
- Bind a knowledge base if “margin” or “active” is contested. Dashboard tools will otherwise pick a fluent definition.
- State the meeting goal, the window, and the decision. Do not ask for “some charts.”
- Let the task run. Open the plan and the queries behind each figure.
- Download the files from the workspace. Attach those files, not a chat screenshot.
- Next cycle, rerun the same goal. Compare artifacts. That is your trail.
These six steps are the whole proof. You can complete the educational diagnosis at step 3: write the goal sentence. What is a data agent if the missing object is still the agent, not the board.
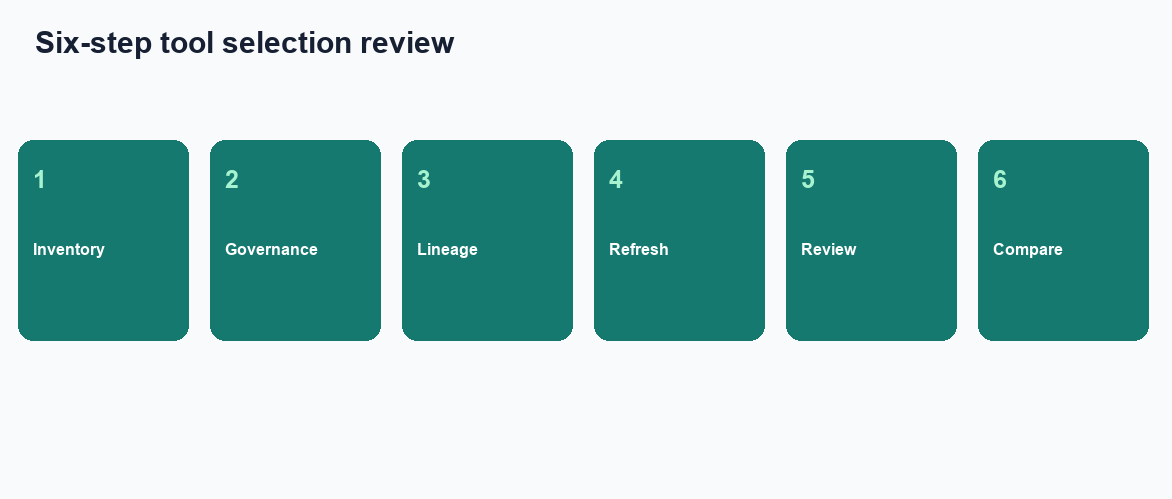
Figure. Educational four-step sequence the desk uses to tell a tile painter from a task trail. Expected result after step 6: the same goal reruns, each featured number opens to a query, and a teammate can download the files. Not a product screenshot or a customer SLA.
Name the source before you generate
Snowflake, Postgres, MySQL, files, ClickHouse, and the rest of the supported list are eligible if you are allowed to read them. Dashboard tools that begin with “first we model a mart” are a consulting project.
Binding is not optional when two teams disagree on a word. Tools that invent “active” will look confident and still fail the follow-up email. Put the approved sentence next to the source. Then generate.
Inspect, download, then rerun
The board is not finished when the preview looks pretty. It is finished when the workspace holds files and each featured number opens a query. Then you rerun. A weekly dashboard refresh that redraws tiles by hand is the habit this pack is meant to retire. Freeze the goal text. If you rewrite the prompt every Sunday, you are commissioning a new board, not using dashboard tools as a trail.
Desk sample: painter versus trail (InfiniSynapse desk log)
This is a first-party InfiniSynapse desk log of dashboard tools, not a named-logo customer case and not an uplift claim. Run ID: AIDB-TOOLS-TRAIL-20260822. Date: 2026-08-22 (Saturday). Operator: InfiniSynapse Data Team. Sources: a read-only Postgres replica the desk is authorized to read, plus a sanitized SKU note file. Goal: Wednesday stand-up—which SKUs missed promise this week. Download the same numbers as desk log AIDB-TOOLS-TRAIL-20260822.
Ops had a published tile catalog: six charts, none of which answered that question. The painter left six tiles, zero charts that answered the ask, and no inspectable SQL. The same-day rewrite used one goal sentence and two authorized sources. Three charts and a Markdown exception list landed, with SQL finance could open. The following Wednesday the same goal reran.
| Retrieval state | Painter tiles | Charts that answer the ask | Inspectable SQL |
|---|---|---|---|
| Tile painter catalog | 6 | 0 | 0 |
| Wednesday trail pack | 0 | 3 | 1 |
Wall clock for the successful run was about twenty-two minutes (warehouse time excluded). Cite this table as InfiniSynapse desk log AIDB-TOOLS-TRAIL-20260822. Do not cite it as customer ROI, a 40% shorter meeting, a bake-off win, or a FRED / BEA / BLS / Gartner experiment. We do not publish named-logo customer cases on this page. The only honest claim is the artifact counts and the wall-clock on this run.
We are not claiming the meeting got shorter. We are claiming the pack and the query lived in the same folder.
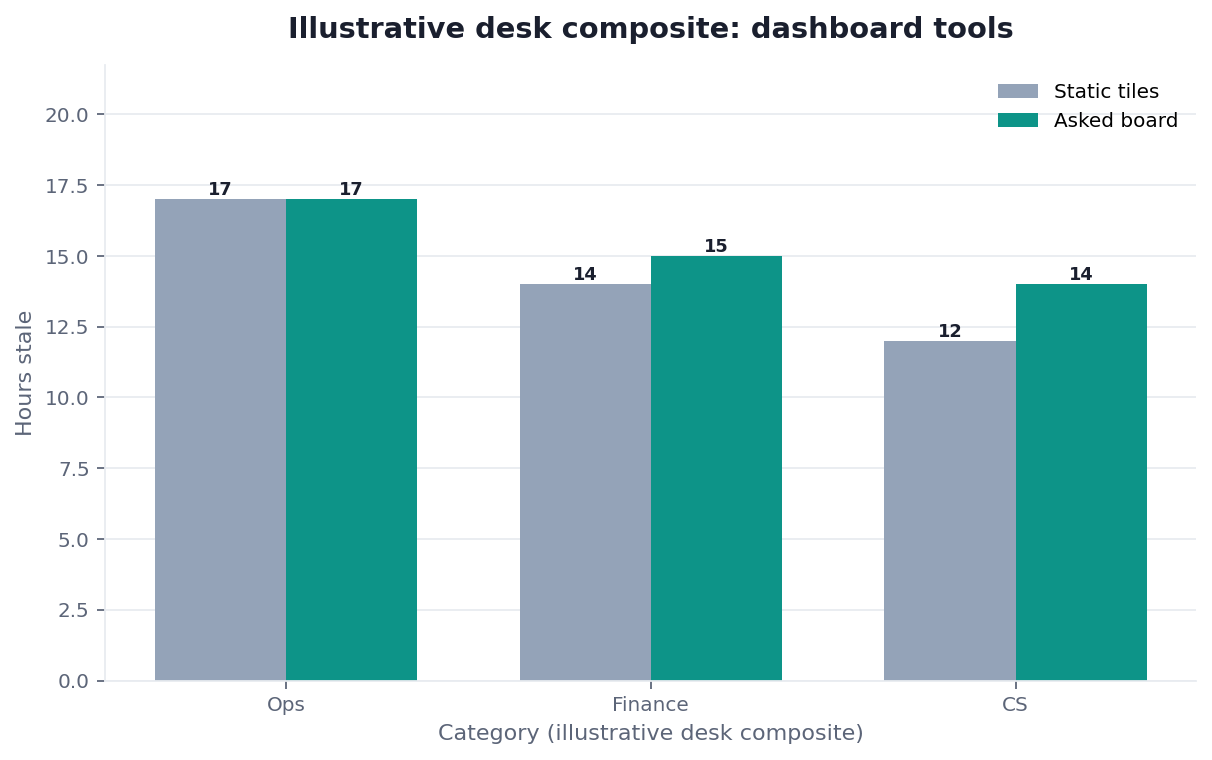
Figure. InfiniSynapse desk log AIDB-TOOLS-TRAIL-20260822: the painter catalog left 6 / 0 / 0; the trail pack left 0 / 3 / 1. Published context: the independent sources linked in the body. Not a customer experiment, SLA, or official benchmark.
| Evidence class | What you can cite | What you cannot claim |
|---|---|---|
| Desk log on this page | Artifact counts 6/0/0 → 0/3/1, ~22 min wall-clock, run ID, downloadable log | Customer uplift %, vendor bake-off win, named-logo case |
| Published authority (linked above) | FRED series IDs, BEA methods, BLS notes, Census APIs, IRS SOI | That those sources ran this desk log |
| Homepage recognition | 2026 WAIC Future Tech OPC Excellence Award as published on the company homepage | That WAIC, FRED, or Gartner scored this article |
Evidence boundaries and external validation status
AIDB-TOOLS-TRAIL-20260822 is a first-party sanitized composite/demo—not raw, customer, source, benchmark, or third-party data. As of 2026-08-29, no independent third party, media outlet, or customer had reproduced it.
Replication should disclose tool, model, version, configuration; source schema, snapshot, access; semantic model, metric, grain, join, filter, timezone; goal and prompts; query or transform; run IDs, status, errors, timestamps; chart, data, artifact hashes; catalog baseline; all failures; review, accessibility, and export protocol; wall clock; and conflicts of interest. PROV-O, WCAG 2.2, ACM Artifact Review, NIST AI RMF, and OWASP GenAI guide controls; none tested this run.
Selection scorecard
| Criterion | Weak | Strong |
|---|---|---|
| Trigger | “Pretty charts please” | Named meeting and decision |
| Trace | Image only | Query behind each figure |
| Sources | Must migrate first | Existing DBs and files |
| Refresh | Manual redraw | Rerun the task |
| Pack | Chat bubble | Downloaded artifacts |
| Shape | Same six tiles every week | Figures follow the goal |
If a vendor’s dashboard tools cannot download, score them as a demo. If they can download but cannot show SQL, score them as a poster. If the tiles never change when the question changes, score them as a catalog. Data governance still applies after the score: authorized sources, authorized people, no secrets in the prompt.
Failure modes that still look like tools
A gallery without a query fails review
The preview impresses the room and dies in the follow-up email. Require the workspace path. If dashboard tools refuse, you bought a renderer. A picture of a chart is not a trail, no matter how many times the deck says “AI-native.”
A catalog that ignores the meeting goal
People accept the same six tiles because the preview is fast. Dashboard tools that ignore the goal are a catalog with a chatbot. Freeze a decision sentence, then reject figures that do not serve it.
One extract is not a federated estate
A stale CSV labeled “all systems” becomes the board’s only truth. If you needed two sources, connect two. Federation is connections you authorized, not a filename that sounds complete. Dashboard tools that hide the join are not ready for a decision.
Before you send any board, check that the files are in the workspace, that each featured number opens to a query, and that the sources are ones you authorized. That inspection is the diagnosis.
| Live guide | Open it when |
|---|---|
| AI dashboard generator | you need the question-to-board path |
| AI-native dashboard | the fight is artifact versus tile catalog |
| Generate dashboard from natural language | the prompt is still a shopping list |
| what is a data agent | the missing object is the agent, not the board |
| data visualization | the question is how to show the grain |
| dashboard | you still need the published-layout definition |
Ask one board from authorized sources
Connect one authorized source, type the meeting goal you already use, and download the charts from the task workspace. This check uses only sources you authorize.
Commercial association: You do not need the workspace to complete the educational diagnosis on this page.
Open InfiniSynapseSourcing and accountability. Research and product documents support scoped claims only; none evaluated this page. COI: InfiniSynapse sells the first-party workflow.
How to cite this page
Page: Zhu, W., & InfiniSynapse Data Team. (2026). Dashboard Tools: inspect, then rerun. InfiniSynapse
Run: InfiniSynapse Data Team. (2026). Desk log AIDB-TOOLS-TRAIL-20260822 (sanitized composite)
Neither is an audit. Cite those artifact counts on this first-party run. No independent reproduction exists. Send contradictions to zhuhl@infinisynapse.com.
Frequently Asked Questions
Are dashboard tools the same as a BI platform?
Bottom line: No. A BI platform publishes certified layouts. Dashboard tools that leave a trail generate a task pack for a specific meeting question. Keep certified tiles in BI; generate the operational board when the question is this week’s.
Can dashboard tools read two sources?
Bottom line: Yes, if both are connected and authorized. You do not need a warehouse project first. You do need to inspect the joins in the task. Dashboard tools that hide the join are not ready for a decision.
What files prove the trail?
Bottom line: The workspace files—charts, Markdown, and any HTML, PDF, or data extract the task wrote. Those files are the trail. The chat preview is only a window. Dashboard tools that cannot download have no trail.
Do dashboard tools write into Tableau?
Bottom line: No. Trail-capable dashboard tools do not publish into Tableau or Power BI and do not write back to production databases. They create artifacts in the task workspace you can download.
How do I keep next week’s board consistent?
Bottom line: Reuse the same goal sentence and the same bound definitions. If you rewrite the prompt every Sunday, you are not refreshing a trail; you are commissioning a new board from dashboard tools that will drift.
Do FRED, BEA, or Gartner define a tile painter as a trail?
Bottom line: No. FRED, BEA methodologies, and Gartner Peer Insights describe named series, method notes, and published BI. They do not run the desk table on this page.
Are the object counts a third-party benchmark?
Bottom line: No. The 6 / 0 / 0 versus 0 / 3 / 1 counts are first-party desk log AIDB-TOOLS-TRAIL-20260822. Dashboard tools treat those counts as a painter-versus-trail test, not an SLA.
Related guides: dashboard creator · AI dashboard generator · dashboard maker · ai powered dashboards · data knowledge base · knowledge base vs semantic layer · natural language to sql · chat with your data
Conclusion
Dashboard tools that only paint tiles are not an analysis trail. Write the meeting goal, run it on sources you already have, and refuse figures that cannot open a query. When you want to run that check, open InfiniSynapse and ask one board from the same authorized sources you will name in the room.