Payback Period Analysis: Audit CAC Recovery
By William Zhu & the InfiniSynapse Data Team · Published: 2026-08-22 · Last updated: 2026-08-31 · Last verified: 2026-08-31 · Next review: 2026-11-30 · About · Privacy policy · Terms · Editorial standards · Corrections

Table of Contents
- TL;DR
- What Payback Period Analysis Means in 2026
- An Assumption-First Framework
- How Teams Compare Payback Clocks
- Tool Landscape for Payback Packs
- Implementation Steps You Can Audit
- Accuracy and Experience Record: Illustrative Payback Pack
- Evidence Boundaries and Independent Validation
- How to Cite This Page
- Selection Scorecard for Payback Packs
- Failure Modes That Invent Months
- Frequently Asked Questions
- Conclusion
TL;DR
We evaluate these patterns at the InfiniSynapse desk on sanitized composites. Every number on this page is illustrative aggregate data, not a customer result, causal estimate, product-performance claim, or benchmark.
Direct answer: Payback period analysis audits how long a defined acquisition cost takes to recover from comparable monthly incremental gross profit or contribution. Use
CAC / monthly incremental gross profitonly when the monthly amount is stable and period-aligned; otherwise accumulate eligible monthly contribution until the running total crosses CAC.
What you'll learn: the stable monthly and cumulative-variable formulas; cohort versus blended direction; a two-stage implementation path; coverage and spend denominators; an illustrative aggregate desk check; and the evidence needed before anyone cites an actual recovery period.
Download evidence: source check · assumption register · desk sample · verification script · reproduction protocol. These are first-party educational artifacts, not independent validation.
Payback period analysis fails when CAC is an unlabeled marketing total, contribution is confused with revenue, and a blended ratio is presented as a cohort result. Payback period analysis requires a semantic layer or dated assumption register, comparable billing and cost periods, visible denominators, and calculations another analyst can replay.
What Payback Period Analysis Means in 2026
Key Definition: Payback period analysis is an audit of the time required for a defined CAC to be recovered by comparable incremental gross profit or contribution. It locks the acquisition cohort, eligible costs, attribution rule, billing period, contribution definition, and coverage denominator before calculating months.
The simplified payback period analysis formula is a customer-acquisition clock. To see payback inside a full cost benefit analysis example, use a project cash-flow table instead of CAC ÷ monthly contribution. Months to recover CAC sit inside SaaS unit economics payback; if CAC is missing, that page leaves payback unpublished.
The simplified payback period analysis formula is:
payback months = CAC per acquired unit / comparable monthly incremental gross profit or contribution per acquired unit
“Comparable” matters. The numerator and denominator must describe the same acquisition population, attribution scope, currency, and economic boundary. Monthly recurring revenue is not monthly gross profit. Cash received in an annual invoice is not twelve monthly contributions earned at once. Payback period analysis should label gross profit or contribution precisely and should never silently substitute billings, revenue, or a non-GAAP subtotal.
When monthly contribution varies, use the cumulative method:
payback month = first month t where cumulative eligible incremental gross profit or contribution through t >= CAC
Payback period analysis retains each period rather than forcing a stable monthly average. If month 13 ends below CAC and month 14 crosses it, the discrete result is month 14; interpolation is optional and must be labeled. Churned accounts, refunds, credits, usage costs, and partial billing periods remain in the signed rule rather than disappearing from the denominator.
Similarweb's SEC-filed exhibit (retrieved 2026-09-04) defines its company-specific CAC as the portion of sales and marketing expense allocated to new customers and its CAC payback period as estimated months to recover CAC through incremental gross profit from newly acquired customers. This is a useful disclosed example, not a universal formula, endorsement, benchmark, or validation of this page.
The SEC staff's non-GAAP interpretations (retrieved 2026-09-04) warn that inconsistent adjustments, unclear labels, or individually tailored recognition can be misleading. Those interpretations apply in their stated regulatory context; here they support the limited practice of labeling contribution definitions and period changes, not a claim that this educational metric is GAAP.
If the missing object is NRR against the same invoices, continue in SaaS metrics analytics. If the missing object is the variable cost stack, use contribution margin analysis. The parent join of money, usage, and cost remains unit economics analytics.
Write the economic boundary first
Payback period analysis starts with one sentence: “For June 2026 covered joiners, allocated acquisition cost includes named paid channels and named onboarding labor; recovery uses monthly incremental contribution after the listed variable costs.” Add exclusions. Add currency and tax treatment. Add how refunds and credits affect the clock.
A contribution measure can be legitimate without being GAAP, but it cannot be anonymous. If the denominator excludes support, hosting, payment fees, or onboarding work, say so. If the numerator contains only paid-media CAC, do not call it fully loaded CAC. Payback period analysis comparisons need the same definition across periods.
Keep billing periods comparable
The Stripe Invoice object (retrieved 2026-09-04) documents invoice fields including customer, currency, status, totals, line items, and period_start/period_end. These fields can support period and customer-key checks; they do not prove revenue recognition, source completeness, attribution, or CAC recovery.
Payback period analysis should spread or separately label annual billing where the contribution is earned over service periods. Payback period analysis treats an invoice total collected today as a billing event, not automatically monthly incremental gross profit. Preserve invoice and service-period fields so a reviewer can see which clock was used.
An Assumption-First Framework
Use one register as the contract. Payback period analysis questions should name every denominator before returning a month count.
| Layer | What to lock | Example evidence | Failure if omitted |
|---|---|---|---|
| Cohort | join window and acquired-unit rule | dated customer list | old and new units mixed |
| CAC | included channels, labor, allocation | spend ledger plus policy | incomplete or overbroad numerator |
| Recovery | gross-profit or contribution stack | invoices plus variable costs | revenue mistaken for profit |
| Period | service month and cutoff | invoice line period | annual cash treated as one month |
| Attribution | channel and identity rules | mapping table and model version | spend assigned to wrong units |
| Account coverage | covered joiners / eligible joiners | 210 / 248 | company claim from a subset |
| Spend coverage | matched dollars / eligible dollars | separate dollar totals | account rate confused with dollar rate |
Payback period analysis uses two coverage ratios that answer different questions. Account coverage in the desk sample is 210 / 248 = 84.677...%, reported as 84.7% or a rounded 85%. The illustrative 8% unmatched-spend rate uses a dollar denominator: unmatched eligible paid-media dollars divided by total eligible paid-media dollars. It cannot be derived from 210 and 248, and it must not be presented as the complement of account coverage.
The IAB cross-channel measurement playbook (retrieved 2026-09-04) discusses objective setting, data integration, attribution-model selection, privacy, quality assurance, and regular testing. It supports documenting and auditing attribution choices; it does not establish causal incrementality, certify any model, or validate this desk sample.
When operators need a recurring view, generate a dashboard from the same locked definitions. Payback period analysis that silently swaps attribution models or contribution stacks between months is not comparable.
How Teams Compare Payback Clocks
Payback period analysis methods differ in what they hold fixed. Payback period analysis chooses the method from the data-generating process, not from the month count management wants.
| Method | Calculation | Appropriate when | Main limitation |
|---|---|---|---|
| Stable monthly | CAC / comparable monthly contribution | contribution is reasonably stable | hides month-level variation |
| Cumulative variable | first cumulative crossing of CAC | contribution, credits, or costs vary | needs complete period series |
| Cohort | CAC and recovery for one acquisition cohort | join dates and costs are attributable | sensitive to late-arriving data |
| Blended | total eligible CAC / total comparable monthly contribution for the blended acquired base | only an aggregate directional clock is needed | mix shifts can dominate |
Cohort payback versus blended payback
Cohort payback period analysis follows a locked acquisition cohort and its eligible recovery stream. Blended payback period analysis combines eligible acquisition cost and comparable monthly incremental gross profit across the stated population. The direction is CAC divided by monthly recovery—not contribution divided by spend. A larger numerator lengthens payback, while a larger comparable denominator shortens it.
Payback period analysis should not average per-account payback months to create a blended clock. Payback period analysis ratios should be rebuilt from aggregate eligible numerators and denominators. Organic units with zero paid CAC require an explicit inclusion rule because their presence can shorten a paid-acquisition blend without improving paid-channel economics.
AI for data analysis can draft the join, but a person still owns the CAC allocation and contribution definition. Payback period analysis cannot infer causal acquisition from a convenient customer key.
Inflation and changing unit costs
The BLS Producer Price Index release (retrieved 2026-09-04) publishes producer-price changes for final and intermediate demand. It can provide external price context for selected inputs; it does not measure a company's CAC, contribution, customer behavior, or payback.
Payback period analysis with variable input prices compares nominal dollars consistently or documents any inflation adjustment. Do not deflate CAC but leave contribution nominal. Payback period analysis should show the price basis and date when external indexes are used.
Tool Landscape for Payback Packs
Payback period analysis tools do not choose the economic boundary. A data agent can help inspect joins and replay calculations when the assumptions are bound to authorized sources. It is a poor fit for changing ad bids or billing records from an analytical request.
Read-only roles remain the default. InfiniSynapse does not ship a native Stripe connector; use a dated export or a read-only table you already operate. Natural language to SQL is an execution path, not evidence that attribution is correct.
Existing engineering links remain technical references only: YAML can structure an assumption file; Trino and Apache Impala can query data where it already resides; GitHub Docs describes version history; and Jaeger describes tracing. None defines CAC, validates contribution, supplies accounting authority, proves causality, or reproduces this payback period analysis.
File-first packs
Payback period analysis for an early-stage team may use a spend sheet and billing export. Freeze both, record hashes, define the joiner key, and calculate only the covered cohort. Never paste live API keys into a prompt. Keep raw personal data out of downloadable evidence.
Warehouse-resident packs
Payback period analysis benefits from a warehouse when multiple consumers need the same materialized cohort on a schedule. It is optional for the first honest pack. Payback period analysis preserves query text, source dates, exclusions, late-arriving-data policy, and the output checksum regardless of storage.
Implementation Steps You Can Audit
Use a two-stage process. Payback period analysis should not produce a headline before coverage and period checks pass.
Stage one: lock assumptions and denominators
Write CAC scope, acquisition unit, cohort window, attribution model, currency, contribution stack, billing-period rule, account-coverage denominator, spend-coverage dollar denominator, and publication threshold. Obtain finance and growth review. Their review is internal and is not independent assurance.
Inspect duplicate units, unmatched joiners, unmatched spend dollars, negative invoices, credits, refunds, tax, currencies, service periods, and missing variable costs. If a denominator changes after review, version the register and rerun the complete pack.
Stage two: calculate and challenge recovery
For stable monthly recovery, divide CAC per covered joiner by comparable monthly incremental gross profit or contribution per covered joiner. For a variable stream, sort complete periods, add eligible recovery, and identify the first cumulative crossing. Show both inputs and rounding.
Payback period analysis must challenge the result. Recalculate under reasonable alternative attribution and cost rules. Explain sensitivity without selecting the shortest clock. Payback period analysis is descriptive under its assumptions unless a valid causal design establishes incrementality.
Accuracy and Experience Record: Illustrative Payback Pack
The following is an illustrative aggregate desk sample, not customer data, an experiment, a benchmark, audited evidence, or a product result. It contains no fabricated customer rows. Run ID: PPA-20260831. Operator: InfiniSynapse Data Team.
| Item | Desk sample (illustrative) |
|---|---|
| Cohort | June 2026 new paying accounts |
| Covered CAC | $520 per covered joiner |
| Account coverage | 210 of 248 eligible joiners = 84.7%, rounded to 85% |
| Monthly contribution | $38 per covered joiner under the stated cost stack |
| Simplified stable monthly payback | 520 / 38 = 13.684..., rounded to 13.7 months |
| Unmatched spend | 8% of eligible paid-media dollars; separate dollar denominator not disclosed |
| Publication status | Covered-cohort illustration only; company-wide result withheld |
Payback period analysis on this sample demonstrates arithmetic and denominator disclosure only. Payback period analysis does not show that $38 remains stable, that acquisition was incremental, that CAC allocation is complete, or that any customer recovered in 13.7 months.
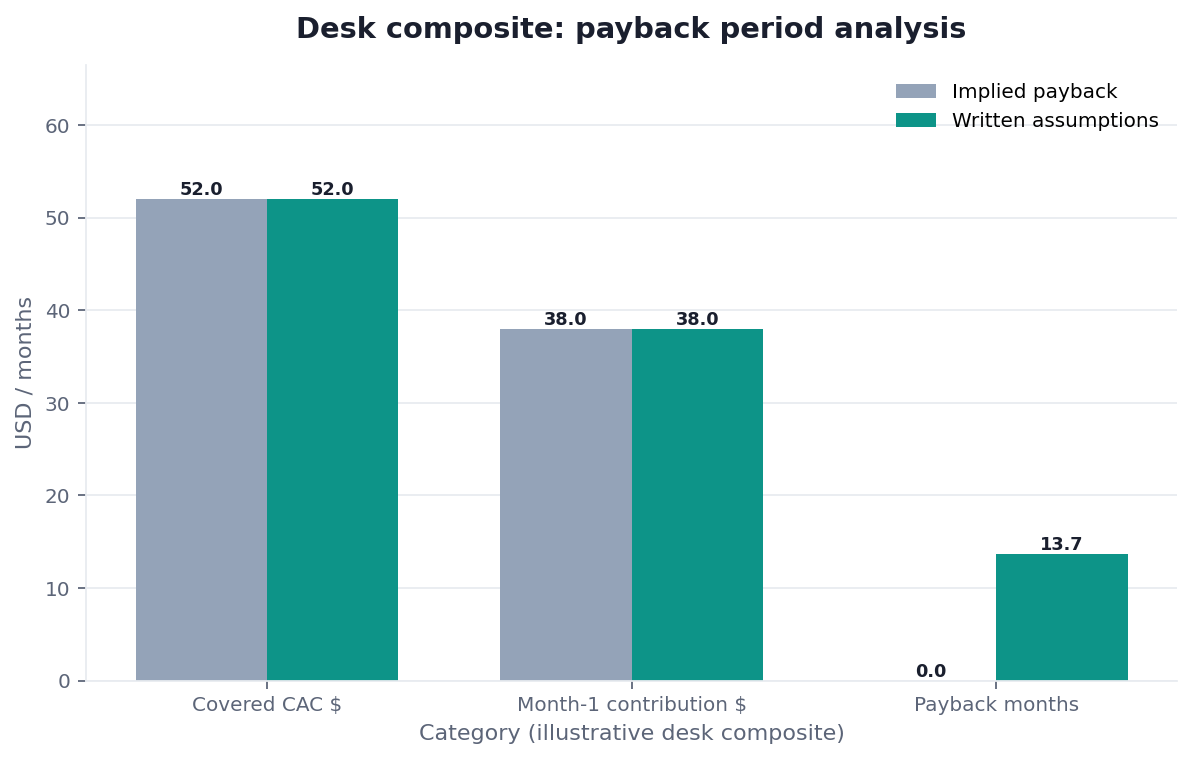
Figure. Payback period analysis illustrative aggregate inputs: $520 CAC and $38 comparable monthly contribution imply 13.7 months under the stable-month simplification; 210/248 is 84.7%, displayed as 85%. The separate 8% unmatched-spend rate uses eligible paid-media dollars, not joiner counts. The figure is not causal, customer, audited, benchmark, or product-performance evidence.
The assumption register labels the formula and held fields. The desk sample CSV contains only aggregate values. The payback period analysis checker verifies 520/38, 210/248, and display rounding; it cannot validate source data or economic assumptions.
Evidence Boundaries and Independent Validation
Payback period analysis currently has no published row-level billing, spend, attribution, cost, refund, churn, or customer-outcome data. The 8% dollar denominator is intentionally undisclosed, so readers cannot independently recalculate that percentage. The payback period analysis sample also omits the month-by-month recovery stream required to validate a cumulative-variable result.
The payback period analysis external source check maps each authority to a narrow claim and explicit non-claim. The independent reproduction protocol states what an outside analyst would need. As of 2026-08-31, no qualifying independent reproduction, customer study, audit opinion, or media investigation is published.
All listed payback period analysis reviewers are internal to InfiniSynapse. Internal review checks presentation and method consistency; it is not independent validation, accounting assurance, attribution certification, or an audit. Running the first-party payback period analysis verification script does not change that status.
Payback period analysis needs stronger evidence: preserve source hashes; publish de-identified rows or sufficient statistics; expose CAC allocations and variable-cost definitions; disclose account and dollar denominators; provide period-level recovery; document late data and exclusions; test alternative attribution rules; and commission a conflict-disclosed outside reproduction using independently controlled data.
How to Cite This Page
Zhu, W., & InfiniSynapse Data Team. (2026). Payback Period Analysis: Audit CAC Recovery. InfiniSynapse. https://infinisynapse.com/en/blog/payback-period-analysis
Artifact: InfiniSynapse Data Team. (2026). Illustrative aggregate desk sample PPA-20260831. https://infinisynapse.com/blog-media/payback-period-analysis/downloads/desk-sample-PPA-20260831.csv
Cite the payback period analysis page for its disclosed method and limitations. Do not cite it as an independent audit, customer case, causal study, benchmark, accounting opinion, or evidence of actual CAC recovery.
Selection Scorecard for Payback Packs
Score from 1 to 5. Payback period analysis should fail selection if the month count cannot be rebuilt from disclosed inputs.
| Criterion | What “5” looks like | Disqualifier |
|---|---|---|
| Economic boundary | CAC and contribution inclusions listed | anonymous “gross profit” |
| Formula | stable or cumulative method explicit | reversed ratio |
| Account coverage | covered / eligible joiners printed | silent covered subset |
| Spend coverage | matched / eligible dollars printed | count rate reused as dollar rate |
| Period alignment | service and cost periods comparable | annual billing treated as one month |
| Attribution | model, version, and sensitivity shown | causal language from descriptive credit |
| Audit trail | files, code, hashes, and approvals retained | chat-only answer |
A skeptical payback period analysis reviewer should be able to reconstruct the displayed arithmetic and identify every unavailable input. A polished payback period analysis chart is not a substitute for that record.
Failure Modes That Invent Months
Reversing the blended formula
Contribution divided by CAC is a recovery rate, not months. The simplified clock runs in the other direction: CAC divided by comparable monthly incremental gross profit or contribution. Payback period analysis should print units beside both values.
Treating monthly revenue as contribution
Revenue excludes no variable costs. A $38 revenue figure cannot become $38 contribution by relabeling it. List the cost stack and keep non-GAAP labels clear.
Converting annual billing into one month
Invoice cash and service-period economics are different clocks. Align recognized or otherwise defined monthly recovery with the stated period. Do not claim immediate recovery merely because an annual invoice was paid.
Confusing account and spend coverage
The desk account rate is 210 covered joiners divided by 248 eligible joiners. The 8% unmatched-spend rate has dollars in both numerator and denominator. These percentages can move independently.
Claiming causality from attribution
Attribution allocates observed credit under a model. It does not by itself prove incremental acquisition or customer outcomes. Use experimental or credible quasi-experimental evidence before calling a channel causal.
Before publishing, check the CAC sentence, contribution stack, billing period, attribution rule, account denominator, spend-dollar denominator, and whether the data support stable or cumulative recovery.
Route the next question to the guide that owns the missing object.
| Live guide | Open it when |
|---|---|
| unit economics analytics | the unit and cost stack remain unlocked |
| FP&A analytics | budget, variance, or close is the question |
| data governance | an owned assumption or approval is missing |
| unit economics for startups | a small-team board file needs the same controls |
| Billing Data Analysis from a Ledger Export | invoice and service periods need inspection |
| Usage plus Revenue Join | usage and billed money need a stable key |
Write the payback assumption, then ask the number
Bind a dated CAC, contribution, attribution, and coverage note to authorized sources, then inspect the covered-cohort calculation. This check uses only sources you authorize.
Commercial association: You do not need the workspace to complete the educational diagnosis on this page.
Open InfiniSynapseHow this page is sourced. William Zhu is cofounder of InfiniSynapse (GitHub @allwefantasy); no personal LinkedIn, accounting credential, customer affiliation, or independent reviewer role is claimed. Desk experience: designing and reviewing analysis packs with definition locks, read-only source binds, and downloadable artifacts. Reviewed internally by analytics engineering · data platform · LLM security · editor; internal review is not independent assurance. Editorial standards · corrections · publishing principles · Contact zhuhl@infinisynapse.com. Company About. COI: InfiniSynapse sells an AI-native Data Agent; the banner is a commercial association. Similarweb, SEC staff, IAB, Stripe, BLS, YAML, Trino, Apache Impala, GitHub, and Jaeger did not validate this run or endorse InfiniSynapse. Fact-check: sec.gov · iab.com · docs.stripe.com · bls.gov · yaml.org · trino.io · impala.apache.org · docs.github.com · jaegertracing.io. This page is a method note, not accounting, investment, tax, employment, or legal advice.
Frequently Asked Questions
What is the correct simplified payback formula?
Bottom line: Divide defined CAC per acquired unit by comparable monthly incremental gross profit or contribution per acquired unit. If the monthly recovery is not stable, do not force the ratio; accumulate eligible period-level recovery until it crosses CAC.
Why is the desk result 13.7 months?
Bottom line: The illustrative stable-month calculation is 520 / 38 = 13.684..., rounded to one decimal place. It demonstrates arithmetic only. It does not prove that contribution stays at $38 or that a real cohort recovered CAC.
Why are 85% coverage and 8% unmatched spend different?
Bottom line: The rounded 85% is account coverage: 210 covered joiners divided by 248 eligible joiners equals 84.7%. The 8% figure is unmatched paid-media dollars divided by eligible paid-media dollars. Different units mean different denominators.
Can attribution establish incremental CAC recovery?
Bottom line: No. An attribution model assigns observed credit under rules. Causal incrementality requires a suitable experiment or credible quasi-experimental design. Payback period analysis should disclose attribution without turning it into a causal claim.
Can annual invoice cash be used as monthly contribution?
Bottom line: Not without an explicit and defensible period rule. Use invoice service periods and the stated revenue or contribution basis. Cash timing, revenue recognition, gross profit, and contribution are not interchangeable.
Has this sample been independently reproduced?
Bottom line: No qualifying external reproduction is published as of 2026-08-31. The downloadable checker is first-party and tests displayed arithmetic only.
Conclusion
Payback period analysis is useful when its economic boundary is visible: defined CAC, comparable monthly incremental gross profit or contribution, a locked cohort, aligned billing periods, an explicit attribution rule, and separate account and spend denominators. Use the stable formula only for stable recovery; otherwise use the cumulative crossing method.
When the assumption register and authorized extracts are ready, inspect covered recovery at https://app.infinisynapse.com/. Keep the query, source hashes, limitations, and approvals, then rerun under the same definitions.