
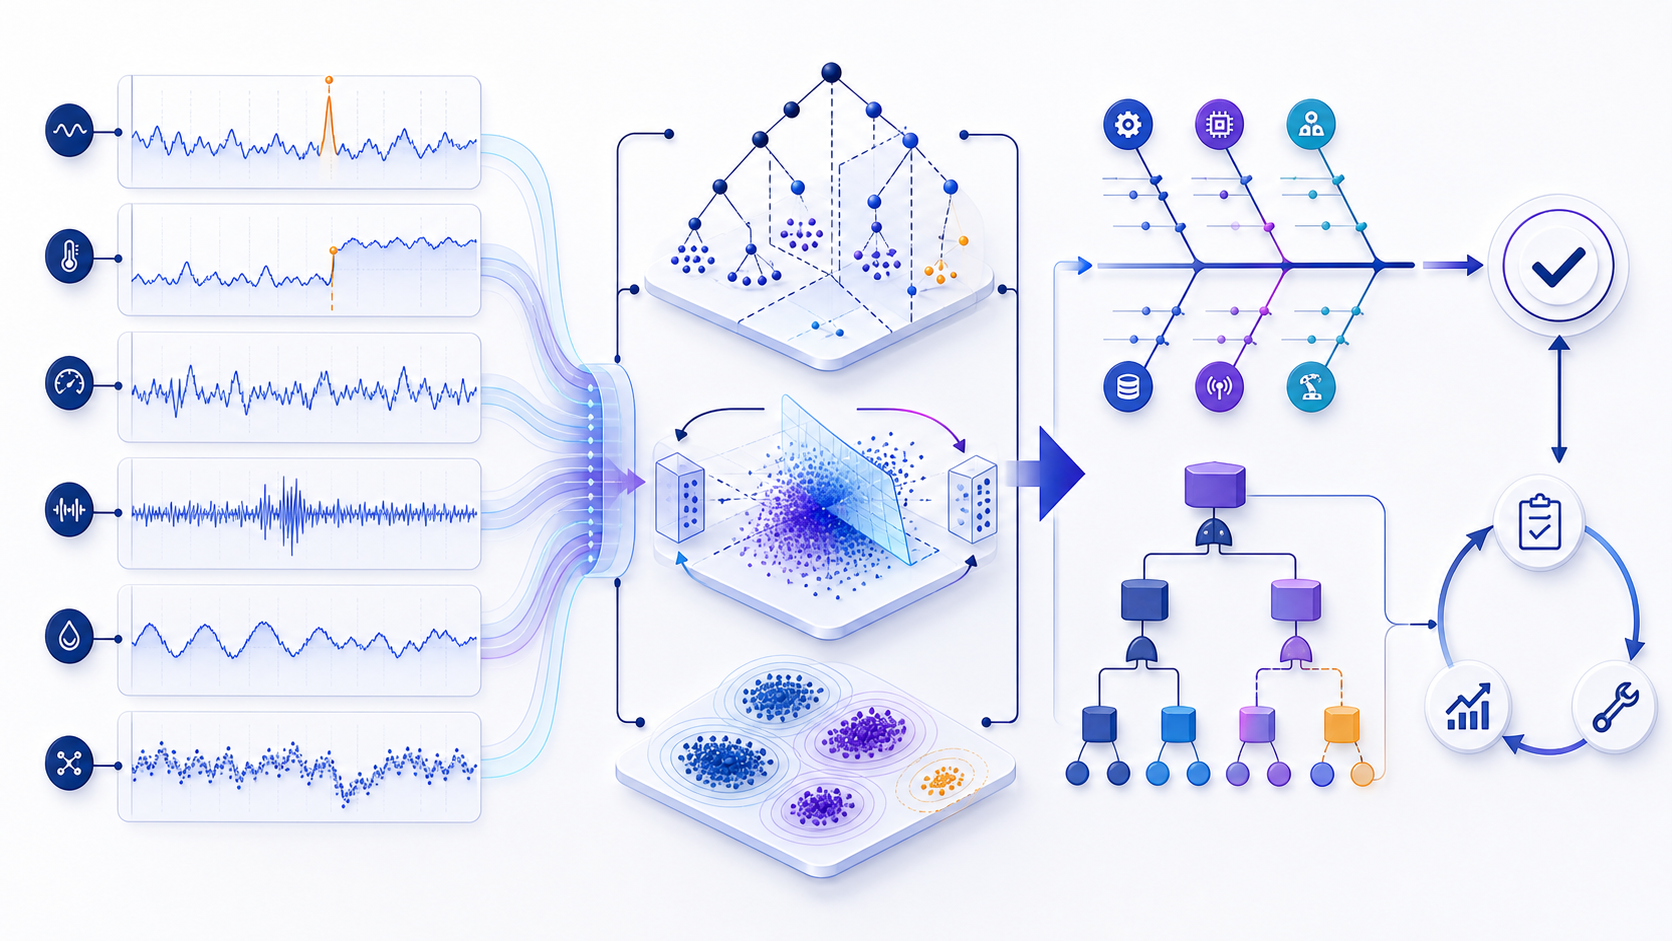
What product categories detect anomaly signals and trace them to technical root causes?哪些产品类别能检出异常信号并追到技术根因?
Pick the system that holds the signal before you pick a model. What product categories detect anomaly signals and trace them to technical root causes? Five categories share the name. IT observability, data-pipeline quality, security analytics, and network anomaly detection can point at a service, a job, an account, or a device. Business-metric products often stop at a commercial cause. The complete method guide — statistical baselines, Isolation Forest, 5 Whys, fishbones, and fault trees — is the next section, and it stays the way to test a cause after the category is chosen.
先确定信号所在的系统,再选模型。五个类别共用「异常检测」这个名字。IT 观测、数据管道质量、安全分析和网络异常可以追到服务、作业、账号或设备。业务指标类产品常常停在商业原因。后面的方法指南(统计基线、隔离森林、5 Whys、鱼骨图、故障树)用来在类别选定之后检验原因。
Five product categories, one shared label五个产品类别,同一个名字
| Category类别 | Where the signal sits信号在哪 | A technical root cause usually lands on技术根因通常落到 |
|---|---|---|
| IT observabilityIT 观测 | Latency, error rate, saturation延迟、错误率、饱和度 | Service, deploy, dependency服务、发布、依赖 |
| Data-pipeline quality数据管道质量 | Tables, jobs, freshness表、作业、新鲜度 | Upstream task, schema, backfill上游任务、schema、回填 |
| Security analytics安全分析 | Sign-in, identity, threat traffic登录、身份、威胁流量 | Account, host, policy账号、主机、策略 |
| Network anomaly detection网络异常 | Bandwidth, connections, protocols带宽、连接、协议 | Link, device, traffic source链路、设备、流量来源 |
| Business metrics业务指标 | Revenue, conversion, KPI收入、转化、KPI | Often a commercial cause: pricing, campaign, or tracking常常是商业原因:定价、活动或埋点 |
These rows name categories. A tool list belongs in RCA tools and software only after the row is chosen.
这些行是类别,不是厂商名次。选定一行之后,工具名单才属于 RCA 工具与软件。
Which category can trace a technical root cause哪一类能追到技术根因
Detection reports a departure from a baseline. A technical root cause names the service, job, account, or device that produced it. IT observability, pipeline quality, security analytics, and network detection can do both when they keep topology, job lineage, or device identity beside the score. A business-metric anomaly can be real and still stop at pricing, a campaign, or a tracking change. Keep a revenue dip on the metrics row.
检测报告的是相对基线的偏离。技术根因要指出产生它的服务、作业、账号或设备。IT 观测、管道质量、安全分析和网络检测在分数旁边保留拓扑、作业血缘或设备身份时,可以同时做到两步。业务指标异常可以是真的,却停在定价、活动或埋点变更。收入下跌不要记成服务故障。
Industrial process signals are a sixth seat工业过程信号是第六席
Multi-variable process data — vibration, temperature, current, yield — is its own seat. The signal sits on a machine, a recipe, or a lot, and the technical root cause is a mechanism you can inspect. That work is already in RCA practice by industry. The five software categories above stay separate.
振动、温度、电流、良率这类多变量过程数据是单独一席。信号在机器、配方或批次上,技术根因是可以检查的机制。这部分已写在 按行业的 RCA 实践。它不替代上面五个软件类别。
Methods after the category is chosen选定类别之后的方法
After the category is fixed, use the method guide on this page. Time-series residuals and change point detection fit a stream. Isolation Forest fits broad tabular screening. Five Whys, fishbones, and fault trees are the diagnostic frameworks in root cause analysis methods techniques. An anomaly score ranks the departure. Naming the cause stays with the sections below, which keep those methods intact.
类别定了之后,再用本页的方法指南。时间序列残差和变点检测适合数据流。隔离森林适合表格筛查。5 Whys、鱼骨图和故障树在根因分析方法与技术。异常分数仍然不指出原因。下面各节保留这些方法。
Anomaly Detection and Root Cause Analysis: The Short Answer快速回答:异常检测与根因分析
Anomaly detection identifies observations, sequences, or system states that depart materially from an appropriate baseline; root cause analysis then tests why the departure occurred and which corrective action can prevent recurrence. A dependable program therefore joins two disciplines. Machine-learning detectors rank suspicious events under high-dimensional, nonlinear, temporal, or large-scale conditions. Diagnostic frameworks organize evidence, distinguish causes from correlations, and convert findings into owned, verifiable actions. Detection without diagnosis produces alerts; diagnosis without reliable detection starts from an incomplete event record.
异常检测用于识别明显偏离适当基线的观测、序列或系统状态;根因分析随后验证偏离为何发生,以及哪项纠正措施能够防止复发。可靠体系需要把两门学科连接起来:机器学习检测器在高维、非线性、时序或大规模条件下排列可疑事件,诊断框架则组织证据、区分原因与相关性,并把发现转化为有负责人且可验证的行动。只有检测没有诊断会堆积告警,只有诊断没有可靠检测则会从残缺事件记录出发。
Naming the controllable cause, before the fix, is root cause identification.
动手修正之前点名那个可控制的原因,就是根因识别。
Begin with an operational definition of normal, the unit of detection, decision latency, and the cost of false positives versus missed anomalies. Preserve raw observations, context, model version, score, threshold, and alert decision. After triage, build a timeline, gather changes and dependencies, form several causal hypotheses, test them against evidence, implement containment and corrective actions, and verify whether risk falls. The detector is successful only when it supports a useful decision; the RCA is successful only when its actions are completed and their effects are measured.
首先定义正常状态、检测单元、决策时效,以及误报与漏报的成本;保存原始观测、上下文、模型版本、分数、阈值和告警决策。初筛之后,应构建时间线,收集变更与依赖关系,提出多个因果假设,用证据逐一检验,实施遏制和纠正措施,再验证风险是否下降。检测器只有在支持有效决策时才算成功;RCA只有在行动落地且效果得到测量时才算成功。
No single model or RCA tool fits every system. Time-series residuals and control charts are transparent for stable processes; Isolation Forest handles broad tabular screening; autoencoders model complex representations but need careful validation; Local Outlier Factor finds local density departures; change-point methods identify persistent regime shifts. Five Whys supports a narrow causal chain, fishbones broaden brainstorming, and fault trees analyze how combinations of events can produce a top event. Complex incidents usually require a combination plus domain review.
不存在适用于所有系统的单一模型或RCA工具。时间序列残差和控制图适合稳定过程且便于解释;隔离森林适合广泛的表格数据筛查;自编码器能够学习复杂表示,但验证要求更高;局部离群因子发现局部密度偏离;变点方法识别持续的状态转换。5 Whys适合追踪较窄的因果链,鱼骨图用于扩展原因探索,故障树用于分析事件组合如何产生顶事件。复杂事故通常需要组合使用并接受领域复核。
1. From Statistical Anomaly Detection to ML Anomaly Detection1. 从统计异常检测到ML异常检测
Statistical rules remain the right starting point when the comparison group is clear and assumptions are defensible. A Z-score, IQR fence, MAD score, control chart, or Mahalanobis distance can show exactly how a point differs from a reference. The preceding outlier definition states the comparison group; the complete guide to outlier definition, detection, and statistical methods explains the methods. Machine learning is not a replacement for data provenance, visualization, robust summaries, or domain thresholds; it extends the toolkit when a simple distribution or fixed rule cannot represent normal behavior.
当比较群体清楚且统计假设可辩护时,统计规则仍然是正确起点。Z分数、IQR围栏、MAD分数、控制图或Mahalanobis距离能够明确说明某个点为何偏离参考。前一篇异常值定义、检测与统计方法完整指南讲解了这些基础。机器学习并不替代数据来源核查、可视化、稳健统计或领域阈值;当简单分布或固定规则无法表达正常行为时,它才扩展工具箱。
Four conditions commonly justify an ML detector. First, high-dimensional records can be ordinary in every column yet unusual as a combination. Second, temporal behavior includes seasonality, lagged effects, sequences, and context-dependent baselines. Third, nonlinear boundaries make distance from a mean misleading. Fourth, large streams require consistent ranking and near-real-time scoring. Even then, the team must define the feature window, reference population, training period, contamination risk, score direction, threshold policy, and review process before comparing algorithms.
四类条件通常支持采用机器学习检测器。第一,高维记录可能每一列都正常,但组合起来异常;第二,时序行为包含季节性、滞后效应、序列和上下文基线;第三,非线性边界会让均值距离产生误导;第四,大规模数据流需要持续排序和接近实时的评分。即使如此,团队也必须先定义特征窗口、参考总体、训练期、污染风险、分数方向、阈值策略和复核流程,再比较算法。
Treat statistical and ML methods as a progression, not opposing camps. Use simple rules as baselines, challenge cases, and monitoring controls. Ask whether the ML model catches materially different events, reduces review burden at the same miss cost, or identifies combinations a reviewer can validate. Evaluate it on time-separated data to avoid leakage, segment results by operating regime, and retain a fallback rule for unavailable features or model failure. A more complex score is justified only by measurable decision value and manageable operational risk.
统计方法与机器学习方法应被视为递进关系,而不是对立阵营。简单规则可作为基线、挑战样例和监控控制。应判断ML模型是否捕获了实质不同的事件,是否在相同漏报成本下降低复核负担,或是否识别出复核人员能够验证的异常组合。使用时间隔离数据评估以避免泄漏,按运行状态分段观察结果,并为特征缺失或模型故障保留回退规则。复杂分数只有在带来可测量的决策价值且运营风险可控时才合理。
Before feature engineering, write an anomaly specification. State the entity being scored, observation window, peer group, excluded operating states, earliest permissible data, decision deadline, expected prevalence range, and downstream action. List known failure modes and examples that must remain normal. This specification prevents teams from optimizing an abstract benchmark that does not match operations. It also creates review criteria when stakeholders disagree: the question becomes whether the detector serves the approved event and action definition, not whether its embedding or score visualization appears sophisticated.
在特征工程前应编写异常规范:说明被评分实体、观测窗口、同类群体、排除的运行状态、最早可用数据、决策时限、预期发生范围和下游行动;列出已知故障模式以及必须保持正常的案例。该规范防止团队优化与运营不符的抽象基准,也在利益相关者意见不一致时提供评审标准:关键是检测器是否服务于批准的事件与行动定义,而不是其嵌入或分数图是否显得复杂。
2. Time-Series Anomaly Detection2. 时间序列异常检测
Time-series anomaly detection must separate trend, seasonality, calendar effects, noise, and structural change before judging a point. A fixed three-sigma limit assumes that the reference center and spread remain meaningful; it can over-alert during predictable peaks, miss gradual drift, and fail when variance changes with load. Start with timestamp quality, sampling cadence, missing intervals, aggregation, known maintenance, holidays, and operating states. Define whether the target is a point anomaly, an unusual window, a forecast error, or a persistent level change, because each requires different labels and response logic.
时间序列异常检测必须先分离趋势、季节性、日历效应、噪声与结构变化,再判断某个点。固定三西格玛限值假设参考中心和离散程度持续有效;在可预测高峰期它可能过度告警,也可能漏掉缓慢漂移,并在方差随负载变化时失效。应先检查时间戳质量、采样频率、缺失区间、聚合方式、已知维护、节假日和运行状态。还要明确目标是点异常、异常窗口、预测误差还是持续水平变化,因为它们需要不同标签和响应逻辑。
STL decomposes a series into trend, seasonal, and residual components using locally estimated smoothing. The residual can then be scored with robust scale or another detector, while the trend and seasonal components remain available for explanation. Robust fitting can reduce the influence of large residuals, but the period and smoothing windows still encode assumptions. Statistical process control complements decomposition: Shewhart-style limits make large shifts visible, while CUSUM accumulates small deviations and can detect modest sustained shifts more efficiently. Control limits are process signals, not specification limits.
STL使用局部估计平滑把序列分解为趋势、季节项和残差。随后可使用稳健尺度或其他检测器对残差评分,同时保留趋势和季节项用于解释。稳健拟合能降低大残差的影响,但周期和窗口仍然包含假设。统计过程控制可补充分解:Shewhart类限值适合显示大偏移,CUSUM累积小偏差,更容易发现较小但持续的均值变化。控制限是过程信号,不是规格限。
A production workflow usually fits the baseline on a clean historical interval, creates lag, rolling, seasonal, and context features without future information, produces a score at the required latency, and calibrates a threshold against labeled incidents or review capacity. Backtest chronologically, including quiet periods and known changes. Report event-level precision and recall, detection delay, alert duration, duplicate-alert rate, and performance by regime. Monitor residual distribution, missingness, feature freshness, and score volume after deployment; recalibrate only through a versioned policy rather than silently moving thresholds.
生产流程通常在相对干净的历史区间拟合基线,在不使用未来信息的前提下生成滞后、滚动、季节和上下文特征,按所需时效输出分数,并根据已标注事故或复核容量校准阈值。回测必须按时间顺序进行,包含平静期和已知变化。应报告事件级精确率与召回率、检测延迟、告警持续时间、重复告警率及分状态表现;上线后监控残差分布、缺失率、特征新鲜度和分数量,只能通过版本化策略重新校准。
Handle data gaps as a separate state rather than quietly interpolating every missing interval. Interpolation can erase an outage, invent a smooth recovery, or leak future values into an online score. Record whether a point is observed, delayed, imputed, or backfilled, and test the detector under each condition. For multi-resolution monitoring, define how minute, hourly, and daily signals interact so the same incident is not counted three times. Planned maintenance and releases should remain in the history, labeled as known context, because production performance includes behaving sensibly around authorized changes.
应把数据缺口视为独立状态,而不是对每个缺失区间静默插值。插值可能抹去中断、虚构平滑恢复或把未来值泄漏进在线分数。应记录数据点是实际观测、延迟、插补还是回填,并在各条件下测试检测器。多时间粒度监控还要定义分钟、小时和日信号如何交互,避免同一事故被计算三次。计划维护与发布应保留在历史中并标记为已知上下文,因为生产表现也包括在授权变更附近合理运行。
Planned child guides: time series anomaly detection
规划中的子文章: 时间序列异常检测
3. Method 1: Isolation Forest3. 方法1:Isolation Forest(隔离森林)
Isolation Forest detects anomalies by repeatedly choosing a feature and a random split value, building trees that isolate observations. Points that require shorter average paths across the forest are easier to separate and receive more anomalous scores. This avoids estimating a full density and works well as an unsupervised baseline for many numeric tabular datasets. It can scale through subsampling and does not require labels to fit, although labels or expert review are still needed to set thresholds and judge whether flagged cases matter.
隔离森林通过反复随机选择特征和切分值,构建能够隔离观测的树。跨森林平均路径更短的点更容易被单独分离,因此获得更异常的分数。该方法不需要估计完整概率密度,适合许多数值型表格数据的无监督基线;它可通过子采样扩展,也不需要标签完成拟合,但阈值设置和业务价值判断仍需要标签或专家复核。
Tune parameters for the decision, not for visual separation alone. More trees reduce score variance at additional compute cost. The sample size controls how much local structure each tree sees; the original method's small subsamples are efficient, but very heterogeneous populations may require segmentation first. The contamination parameter typically determines a decision threshold rather than discovering the true anomaly prevalence. Feature subsampling can add diversity, while irrelevant or duplicated features can distort how often useful dimensions are selected. Record random seeds, preprocessing, feature versions, and score orientation.
参数调优应服务于决策,而不是只追求图形分离。更多树可以降低分数方差,但增加计算成本;样本量决定每棵树能看到多少局部结构,较小子样本效率高,但高度异质总体可能应先分群。contamination参数通常用于确定决策阈值,并不能发现真实异常比例。特征子采样能增加多样性,但无关或重复特征会影响有用维度被选中的频率。应记录随机种子、预处理、特征版本和分数方向。
Isolation Forest is attractive for high-volume screening, broad feature sets, and unknown anomaly shapes. It is weaker when anomalies are defined mainly by local density, sequence order, causal context, or a small subgroup hidden inside a dominant population. Categorical variables need a defensible representation, and missing values need an explicit policy. Explain alerts with the features and partitions that contributed, but do not present feature contribution as causal proof. Compare results with simple rules and LOF, then review both flagged and unflagged cases from each important segment.
隔离森林适合高吞吐筛查、较广特征集和未知异常形状。当异常主要由局部密度、序列顺序、因果上下文或被主流总体掩盖的小群体定义时,它可能较弱。分类变量需要合理编码,缺失值需要明确策略。可以用相关特征和分区解释告警,但不能把特征贡献当作因果证明。应与简单规则和LOF比较,并从各重要分段同时抽查被标记和未标记案例。
Inspect score stability before deployment. Refit the forest across several seeds and adjacent training windows, then compare rank correlation, threshold crossings, and the identities of top cases. Large instability can indicate too little data, weak features, population mixtures, or a threshold placed inside a dense score region. Create challenge sets for rare but legitimate operations, duplicated records, missing-feature patterns, and extreme single features. A robust detector should flag the intended joint behavior without turning predictable operating modes into permanent alerts or changing decisions drastically after an innocuous refit.
部署前要检查分数稳定性。在多个随机种子和相邻训练窗口上重新拟合森林,比较排名相关、阈值穿越和最高分案例身份。显著不稳定可能表示数据不足、特征薄弱、总体混合或阈值落在密集分数区。应为稀有但合法运行、重复记录、缺失特征模式和单一极端特征建立挑战集。稳健检测器应标记目标联合行为,而不是把可预测运行模式变成永久告警,也不应在无害重拟合后大幅改变决策。
Planned child guides: isolation forest anomaly detection
规划中的子文章: 隔离森林异常检测
4. Method 2: Autoencoder4. 方法2:Autoencoder(自编码器)
An autoencoder learns an encoder that compresses an input and a decoder that reconstructs it. In a common anomaly-detection design, the network is trained predominantly on representative normal examples. Reconstruction error—such as absolute or squared error across features or a sequence window—becomes the anomaly score. The working hypothesis is that regular patterns are reconstructed better than patterns outside the learned normal manifold. That hypothesis must be tested: a high-capacity network can sometimes reconstruct anomalies well, while contaminated training data can teach the model that recurring failures are normal.
自编码器学习把输入压缩到潜在表示的编码器,以及把表示还原为输入的解码器。常见异常检测设计主要使用具有代表性的正常样本训练,并以各特征或序列窗口的绝对误差、平方误差等重构误差作为异常分数。基本假设是规律模式比偏离正常流形的模式更容易重构。该假设必须验证:容量过大的网络有时也能很好重构异常,而被污染的训练集会让模型把重复故障学成正常。
Prepare features carefully. Normalize continuous inputs using statistics fitted only on training data, preserve transformations for scoring, and decide how to represent categories, missingness, and masks. For multivariate time series, choose the window length, stride, temporal architecture, and whether the score is assigned to a window or redistributed to timestamps. Control capacity with a meaningful bottleneck, regularization, early stopping, and time-separated validation. Examine per-feature residuals alongside the aggregate score so investigators can see which signals contributed to an alert.
特征准备必须谨慎。连续输入应使用只在训练数据上拟合的统计量归一化,并保留同样的变换用于评分;分类值、缺失和值掩码需要明确表示。对于多变量时间序列,还要选择窗口长度、步长、时间结构,以及分数属于窗口还是重新分配到时间点。通过有意义的瓶颈、正则化、早停和时间隔离验证控制容量,并在总分之外检查各特征残差,使调查人员看到哪些信号推动了告警。
Set the threshold from operational evidence rather than the maximum training loss. Use a clean validation distribution, known incidents, synthetic challenge cases where defensible, and review capacity to compare candidate cutoffs. Measure event-level detection, delay, false-alert burden, stability, and behavior under drift. Autoencoders are useful for images, waveforms, and nonlinear multivariate sequences when enough representative data and ML operations discipline exist. Prefer a simpler detector when samples are scarce, explanations must be immediate, or normal behavior changes too quickly for reliable retraining.
阈值不应简单取训练损失最大值,而应依据运营证据确定。使用相对干净的验证分布、已知事故、在合理情况下构造的挑战样例以及复核容量比较候选阈值;测量事件级检测、延迟、误报告警负担、稳定性和漂移下的行为。当图像、波形或非线性多变量序列拥有足够代表性数据且团队具备ML运维能力时,自编码器很有价值;当样本稀少、解释必须即时或正常行为变化太快时,应优先选择更简单的检测器。
Diagnose reconstruction behavior, not just aggregate loss. Plot normal and anomalous residual distributions by feature, subgroup, and window position. Check whether one high-variance feature dominates the score, whether padding or masks create edge artifacts, and whether the decoder learns an identity-like shortcut. Compare loss functions that match measurement meaning and consider feature weights only with documented justification. When error separation is weak, reducing capacity, cleaning the reference set, redesigning the window, or abandoning the autoencoder may be better than forcing a threshold through overlapping distributions.
诊断重构行为,而不只看总损失。按特征、亚组和窗口位置绘制正常与异常残差分布,检查是否某个高方差特征主导分数、填充或掩码是否制造边缘伪影,以及解码器是否学到近似恒等的捷径。损失函数应符合测量含义,特征权重只能在有文档依据时使用。如果误差分离很弱,降低容量、清理参考集、重新设计窗口或放弃自编码器,都可能比在重叠分布中强行设阈值更好。
Planned child guides: autoencoder anomaly detection
规划中的子文章: 自编码器异常检测
5. Method 3: Local Outlier Factor (LOF)5. 方法3:Local Outlier Factor(LOF)
Local Outlier Factor is a density-based method. For each observation, it uses distances to nearby neighbors to estimate local reachability density, then compares that density with the densities of those neighbors. A score near the neighborhood norm suggests an inlier; a much lower local density suggests an outlier. The value of locality is important: a point can be normal relative to the entire dataset yet sparse within its own peer region, or look globally extreme while belonging to a legitimate low-density cluster.
局部离群因子是一种基于密度的方法。它利用观测与邻居的距离估计局部可达密度,再把该密度与邻居密度比较。接近邻域常态的分数表示内点,明显较低的局部密度则提示离群。局部性非常重要:某个点相对整个数据集可能正常,却在自己的同类区域稀疏;也可能全局看似极端,但实际属于合法的低密度簇。
The number of neighbors controls the scale of comparison. Too few neighbors make scores unstable and sensitive to noise; too many blur small subpopulations into the global structure. Distance metrics and feature scaling matter because neighborhoods are built geometrically. Remove identifiers, control correlated duplicates, scale meaningful numeric dimensions, and segment contexts that should not compete for neighbors. In scikit-learn, standard outlier detection and novelty detection use different modes: when novelty is enabled, score only unseen samples according to the documented API.
邻居数量控制比较尺度。邻居太少会让分数不稳定并对噪声敏感,太多则会把小群体模糊进全局结构。由于邻域依赖几何距离,距离度量和特征缩放很关键。应移除标识符,控制相关重复特征,缩放有意义的数值维度,并把不应互为邻居的情境分开。在scikit-learn中,训练集离群检测与新样本新颖性检测使用不同模式;启用novelty时,应按文档只对未见样本评分。
Use LOF when local peer comparison is the actual definition of abnormality, cluster densities differ, and the dataset is small enough for neighbor search. Isolation Forest is often easier to scale and less dependent on a distance metric; LOF can be more sensitive to a sparse point beside a dense local cluster. Compare both with the same time split, review budget, and event definition. Do not interpret a large LOF score as a root cause: it describes local geometry and should become evidence for a later investigation.
当异常的实际定义就是局部同类比较、不同簇密度不同且数据规模允许邻居搜索时,LOF较合适。隔离森林通常更易扩展,也较少依赖距离度量;LOF则可能更敏感地发现紧邻高密度簇的稀疏点。两者应使用相同时间切分、复核预算和事件定义比较。较大的LOF分数不是根因,它只描述局部几何关系,应作为后续调查证据。
Test sensitivity across a reasonable neighborhood range rather than reporting one chosen k. Track whether a case remains anomalous, moves between peer groups, or disappears when the scale changes. Visualize nearest neighbors for reviewed alerts and ask domain owners whether those records are truly comparable. Approximate neighbor indexes can improve scale but introduce another accuracy and versioning tradeoff. In very high dimensions, distances can become less discriminative; feature selection, representation learning, or a detector that does not rely directly on neighborhoods may be more reliable.
应在合理邻居范围内测试敏感性,而不是只报告一个选定k。观察案例在尺度变化时是否仍异常、是否移动到不同同类组或是否消失。对已复核告警可视化最近邻,并让领域负责人判断这些记录是否真正可比。近似邻居索引可提高扩展性,但会引入准确性与版本权衡。在很高维度中,距离区分度可能下降,此时特征选择、表示学习或不直接依赖邻域的检测器可能更可靠。
Related guide: local outlier factor
相关指南: 局部离群因子
6. Method 4: Change Point Detection6. 方法4:Change Point Detection(变点检测)
A point anomaly is a short-lived observation that differs from its context; a change point marks a boundary after which the data-generating regime changes. The new level, variance, trend, frequency, or relationship may be perfectly consistent after that boundary. Treating every post-change sample as a separate anomaly floods responders, while averaging the change away misses a persistent shift. Define the monitored statistic, minimum meaningful change, acceptable delay, and whether changes can reverse before selecting an algorithm.
点异常是短暂偏离上下文的观测;变点则表示数据生成状态在某个边界后发生改变。新水平、方差、趋势、频率或变量关系在边界之后可能完全稳定。如果把变点后的每个样本都当作独立异常,会淹没响应人员;若把变化平均掉,则会漏掉持续偏移。选算法前必须定义监控统计量、最小有意义变化、可接受延迟和变化是否可能反转。
CUSUM accumulates deviations from an in-control target and signals when the cumulative evidence crosses a decision limit. It is effective for detecting small sustained mean shifts when its reference value and limit match the process. Bayesian change-point approaches express uncertainty about when and how regimes change, updating beliefs as evidence arrives; their usefulness depends on priors, likelihood assumptions, and computational design. Offline methods segment a completed history, while online methods trade certainty for prompt detection and need explicit reset, suppression, and late-data behavior.
CUSUM累积相对于受控目标的偏差,并在累计证据越过决策限时发出信号。当参考值和限值与过程匹配时,它能有效发现较小但持续的均值偏移。贝叶斯变点方法表达状态何时以及如何变化的不确定性,并随新证据更新判断;效果依赖先验、似然假设和计算设计。离线方法分割完整历史,在线方法则用部分确定性换取及时检测,因此需要明确重置、抑制和迟到数据处理。
Validate change-point detection at the event level. A prediction within an agreed tolerance window may count as one detection; repeated alerts for the same regime should not inflate precision. Measure detection delay, false changes per unit time, segmentation error, stability after backfill, and performance across planned changes. Connect each detected boundary to deployment, configuration, maintenance, demand, and topology records. Temporal coincidence narrows hypotheses, but it does not prove that the coincident change caused the observed effect.
变点检测应按事件级验证。在约定容差窗口内的预测可计为一次检测,同一状态的重复告警不能抬高精确率。应测量检测延迟、单位时间误报变点数、分割误差、回填后的稳定性以及在计划变更中的表现。把每个边界与部署、配置、维护、需求和拓扑记录连接起来;时间重合可以缩小假设范围,但不能证明重合变化就是原因。
Decide what happens after a signal. A confirmed change may require adopting a new baseline, reverting a change, splitting the series into regimes, or escalating an investigation. Automatic baseline reset is dangerous when the new regime represents degradation: the monitor can normalize failure. Require evidence and approval for resets, retain the old reference, and monitor post-reset risk. For gradual drift, combine change-point logic with slope, residual, or cumulative indicators rather than expecting one abrupt boundary. The response policy is part of detector design and should be backtested with the score.
应预先决定信号后的处理。已确认变化可能需要采用新基线、回滚变更、把序列拆分为不同状态或升级调查。若新状态代表退化,自动重置基线很危险,因为监控会把故障正常化。重置应有证据与批准,保留旧参考并监控重置后风险。对于缓慢漂移,应把变点逻辑与斜率、残差或累积指标结合,而不是期待一个突变边界。响应策略本身属于检测器设计,也应与分数一起回测。
Planned child guides: change point detection
规划中的子文章: 变点检测
7. Method Comparison and Selection Guide7. 方法对比与选型指南
Choose the detector from the anomaly definition and operating constraint, not from algorithm popularity. If labels cover representative failures and normal cases, supervised classification may provide direct decision optimization, but label delay, changing failure modes, and class imbalance require care. Unsupervised methods rank departures without labels but cannot decide whether a rare pattern is harmful. Semi-supervised novelty detection learns a normal reference and is appropriate only when the training set is sufficiently clean. Every option still needs a threshold or review rule.
检测器应根据异常定义和运行约束选择,而不是根据算法热度。如果标签覆盖有代表性的故障和正常案例,监督分类可以直接优化决策,但必须处理标签延迟、故障模式变化和类别不平衡。无监督方法无需标签即可排列偏离程度,却无法判断稀有模式是否有害。半监督新颖性检测学习正常参考,只有训练集足够干净时才适用。每种方案仍需要阈值或复核规则。
| Method | Best fit | Explainability | Compute/data | Main risk |
|---|---|---|---|---|
| Residuals + SPC | Stable univariate or low-dimensional process | High | Low; reliable baseline | Seasonality or regime changes violate limits |
| Isolation Forest | Broad tabular screening | Medium | Moderate; subsampling scales | Context and local density may be missed |
| Autoencoder | Nonlinear high-dimensional signals | Low to medium | High; much representative data | Reconstructs anomalies or learns contamination |
| LOF | Local-density departures | Medium | Neighbor search; scaled features | Sensitive to k, metric, dimensionality |
| Change-point method | Persistent regime transition | Medium to high | Ordered data and latency design | Confuses planned changes or gradual drift |
| 方法 | 适合场景 | 可解释性 | 计算/数据 | 主要风险 |
|---|---|---|---|---|
| 残差+SPC | 稳定单变量或低维过程 | 高 | 低;需要可靠基线 | 季节性或状态变化破坏限值 |
| 隔离森林 | 广泛表格筛查 | 中 | 中;子采样可扩展 | 可能遗漏上下文和局部密度 |
| 自编码器 | 非线性高维信号 | 低到中 | 高;需大量代表性数据 | 重构异常或学习污染 |
| LOF | 局部密度偏离 | 中 | 邻居搜索;需缩放 | 对k、度量和维度敏感 |
| 变点方法 | 持续状态转换 | 中到高 | 需有序数据和时效设计 | 混淆计划变化或缓慢漂移 |
Use a short decision path. For a stable single metric, begin with visualization, decomposition, and SPC. For heterogeneous tabular records, segment known contexts and benchmark Isolation Forest against transparent rules. For local peer departures, try LOF after defensible scaling. For sequences, decide whether the target is a residual spike, unusual window, or regime boundary before choosing a forecasting model, autoencoder, or change-point detector. If a human must act immediately, explanation latency and evidence availability can outweigh a small offline accuracy gain.
可采用简短决策路径:稳定单指标从可视化、分解和SPC开始;异质表格记录先分离已知上下文,再用透明规则与隔离森林比较;局部同类偏离在合理缩放后尝试LOF;序列数据先判断目标是残差尖峰、异常窗口还是状态边界,再选择预测模型、自编码器或变点检测器。若人员必须立即行动,解释时效和证据可用性可能比小幅离线准确率提升更重要。
Run champion-challenger evaluation on chronological data. Compare simple and complex methods under the same alert budget, merge nearby scores into events, and include the operational costs of investigation, delay, and missed impact. Keep shadow deployment long enough to observe normal seasons and planned changes. Promote a model only with a documented rollback, monitoring dashboard, ownership, retraining trigger, and approved threshold. The best method is the least complex approach that meets the decision target reliably.
在时间顺序数据上进行主模型与挑战模型评估。在相同告警预算下比较简单与复杂方法,把相邻分数合并成事件,并计入调查、延迟和漏报影响的运营成本。影子部署应覆盖正常季节和计划变更。只有在回滚、监控、负责人、重训触发条件和阈值均文档化后才能升级模型。最佳方法是能够稳定满足决策目标的最简单方案。
Evaluation labels need their own quality review. Incident tickets can be incomplete, created after detection, merged inconsistently, or biased toward events that existing monitors already catch. Build labeling guidance, include uncertain and benign outcomes, measure reviewer agreement, and preserve label timestamps so future information does not leak into training. When ground truth is sparse, combine expert adjudication, challenge sets, counterfactual checks, and operational metrics rather than presenting a single accuracy number. State which conclusions are observed and which remain inferred from limited feedback.
评估标签本身也需要质量审查。事故工单可能不完整、在检测后才创建、合并方式不一致,或偏向现有监控已能捕获的事件。应制定标注指南,包含不确定和良性结果,测量复核一致性,并保存标签时间戳,避免未来信息泄漏进训练。真实标签稀少时,应结合专家裁定、挑战集、反事实检查和运营指标,而不是只展示一个准确率数字;明确哪些结论来自观测,哪些仍由有限反馈推断。
Planned child guides: outlier detection
规划中的子文章: 异常值检测方法
8. What Is Root Cause Analysis (RCA)?8. 什么是根因分析(RCA)?
Root cause analysis is a structured investigation that explains how an undesired event occurred, identifies causal and contributing conditions that can be changed, and produces corrective actions whose effectiveness can be verified. The phrase “root cause” should not force a search for one culprit. Complex systems often fail through interacting design weaknesses, process conditions, triggers, and missing defenses. A useful RCA separates the observed impact, symptoms, proximate mechanism, contributing factors, latent conditions, and evidence for each claim.
根因分析是一种结构化调查,用于解释不期望事件如何发生,识别能够被改变的因果与促成条件,并形成效果可验证的纠正措施。“根因”一词不应迫使团队寻找单一责任点。复杂系统往往由相互作用的设计弱点、过程条件、触发因素和缺失防线共同导致失败。有效RCA会区分实际影响、症状、近端机制、促成因素、潜在条件以及支持每项结论的证据。
Anomaly detection answers where and when behavior departed from expectation; it does not establish why. A spike in latency can coincide with a deployment, increased demand, dependency slowdown, telemetry change, or several interacting events. Feature importance explains a model score, not the physical or organizational cause. RCA begins after triage by preserving evidence, defining the event precisely, constructing a timeline, mapping dependencies, and generating competing hypotheses. Investigators then seek observations that would support or falsify each hypothesis.
异常检测回答行为在何时何处偏离预期,但不能确定原因。延迟尖峰可能与部署、需求增加、依赖变慢、遥测变化或多个交互事件同时出现。特征重要性解释的是模型分数,而不是物理或组织原因。RCA在初筛后开始:保存证据、精确定义事件、构建时间线、映射依赖关系并提出相互竞争的假设,再寻找能够支持或否定各假设的观测。
A complete RCA record includes scope, impact, detection path, chronology, data sources, hypotheses considered, evidence, causal reasoning, containment, corrective and preventive actions, owners, due dates, verification measures, residual risk, and review approval. Avoid blame-oriented language and vague actions such as “be more careful.” Prefer controls that change system design, automation, validation, monitoring, training, or governance. Close the analysis only after actions are implemented and the chosen leading and lagging indicators show whether recurrence risk has actually changed.
完整RCA记录包含范围、影响、检测路径、时间线、数据来源、已考虑假设、证据、因果推理、遏制措施、纠正与预防行动、负责人、截止日期、验证指标、剩余风险和评审批准。应避免归责语言和“以后更小心”之类模糊行动,优先采用改变系统设计、自动化、验证、监控、培训或治理的控制措施。只有行动实施且先行与滞后指标显示复发风险确实改变后,分析才能关闭。
Separate containment, correction, corrective action, and prevention. Containment limits current harm; correction restores the affected item or service; corrective action changes the causal condition; prevention extends learning to similar risks elsewhere. One activity can support several goals, but the record should state which. Rank proposed actions using the hierarchy of controls: eliminating a hazard or redesigning a system is generally stronger than warnings, reminders, or retraining alone. For every action, name the mechanism by which it reduces risk and the evidence that will confirm that mechanism.
应区分遏制、修复、纠正行动与预防。遏制限制当前伤害,修复恢复受影响对象或服务,纠正行动改变因果条件,预防则把经验扩展到其他相似风险。一项活动可能支持多个目标,但记录必须说明其作用。可按控制层级排序行动:消除危险或重新设计系统通常强于单纯警告、提醒或再培训。每项行动都要说明降低风险的机制,以及能够确认该机制的证据。
9. RCA Framework 1: 5 Whys Analysis9. RCA框架1:5 Whys分析法
The 5 Whys technique follows a causal chain by repeatedly asking why the preceding condition existed. Five is a prompt, not a required count; a valid chain may need fewer or more questions and may branch. Begin with a specific, observable problem statement, not a proposed cause. For each answer, cite evidence and ask whether the relationship is causal, merely correlated, or still hypothetical. Stop at a condition that the organization can influence and whose change plausibly prevents recurrence, not at an individual action or an untestable abstraction.
5 Whys通过反复追问前一条件为何存在来追踪因果链。“五次”只是提示,并非固定数量;有效链条可能更短、更长或产生分支。起点应是具体可观察的问题陈述,而不是预设原因。每个回答都要引用证据,并判断关系是因果、仅相关还是仍属假设。应在组织能够影响且改变后有望防止复发的条件处停止,而不是止于个人行为或无法检验的抽象说法。
Consider a hypothetical service outage. The customer API failed because connection pools were exhausted. Pools exhausted because retries multiplied during a dependency slowdown. Retries multiplied because the client lacked bounded exponential backoff. That control was absent because the service template did not require it. The template lacked the control because resilience requirements had no owner or release gate. The chain directs action toward reusable engineering standards, but investigators should still test alternative branches such as capacity, timeout settings, and dependency behavior.
以一个假设性的服务中断为例:客户API因连接池耗尽而失败;连接池耗尽是因为依赖变慢时重试被放大;重试被放大是因为客户端缺少有界指数退避;该控制缺失是因为服务模板没有强制要求;模板缺少控制则源于韧性要求没有负责人或发布门禁。该链条把行动指向可复用工程标准,但调查仍应检验容量、超时设置和依赖行为等其他分支。
A practical 5 Whys template has columns for level, why question, answer, evidence, confidence, alternative explanation, and required follow-up. Add the final causal statement, containment, corrective action, owner, deadline, and effectiveness measure. Use a fishbone first when the team has many plausible categories, then apply 5 Whys to the strongest branches. Do not force every event into one linear story, confuse policy absence with a cause without testing, or close an action merely because a document was updated.
实用5 Whys模板可设置层级、为什么问题、回答、证据、置信度、替代解释和待办验证等列,并补充最终因果陈述、遏制措施、纠正行动、负责人、期限与有效性指标。当原因类别很多时,先用鱼骨图扩展,再对最强分支使用5 Whys。不要把每个事件强行压成单一线性故事,不要未经检验就把政策缺失当作原因,也不要仅因文档更新就关闭行动。
Child guide: 5 Whys template (method + worksheet)
子文章: 5 Whys 模板(方法 + 工作表)
10. RCA Framework 2: Fishbone Diagram (Ishikawa/Fishbone Diagram)10. RCA框架2:鱼骨图(Ishikawa/Fishbone Diagram)
A fishbone diagram organizes many possible causes around a clearly defined effect. A filled walkthrough is this fishbone RCA example. In manufacturing, the familiar 6M categories are Manpower, Machine, Material, Method, Measurement, and Mother Nature or Environment. The categories are prompts, not conclusions. An IT team might adapt them to People, Platform, Process, Code or Change, Dependencies, Data, and Environment. Put the observable effect at the head, draw major category bones, add specific candidate causes, and keep asking what evidence would distinguish one branch from another.
鱼骨图围绕一个清楚定义的结果组织大量可能原因。填好的案例见这份鱼骨图 RCA 示例。制造业常用6M分类:人员、机器、材料、方法、测量与环境。这些类别只是提示,不是结论。IT团队可改为人员、平台、流程、代码或变更、依赖、数据与环境。应把可观察结果放在鱼头,绘制主要类别骨架,添加具体候选原因,并持续询问需要什么证据才能区分不同分支。
For a manufacturing defect, Machine may include worn tooling and unstable temperature; Material may include lot variation; Measurement may include gauge drift; Method may include an uncontrolled setup sequence. For an IT latency incident, candidates could include thread saturation, a schema change, cache invalidation, retry behavior, a dependency slowdown, or altered telemetry. The diagram prevents premature fixation, especially when a striking recent change attracts attention. However, every branch remains a hypothesis until logs, records, experiments, inspections, or controlled comparisons support it.
制造缺陷案例中,机器分支可包含刀具磨损和温度不稳,材料分支包含批次差异,测量分支包含量具漂移,方法分支包含未受控的设置顺序。IT延迟事故中,候选原因可能是线程饱和、模式变更、缓存失效、重试行为、依赖变慢或遥测改变。鱼骨图能防止团队过早锁定某个醒目的近期变更,但所有分支在日志、记录、实验、检查或受控比较支持之前都只是候选假设。
A reusable fishbone template should capture the effect, scope, time window, facilitator, participants, categories, candidate causes, evidence status, next test, owner, and disposition. After brainstorming, remove duplicates, phrase causes at a testable level, rank by evidence and potential impact, and transfer the most credible branches into 5 Whys, fault-tree, or experimental analysis. Redraw the diagram when relationships become clearer. A polished diagram is not an RCA outcome unless the team verifies causes and assigns corrective actions.
可复用鱼骨图模板应记录结果、范围、时间窗口、主持人、参与者、分类、候选原因、证据状态、下一项检验、负责人和处置结果。头脑风暴后,应去重,把原因改写到可检验层级,按证据与潜在影响排序,并把最可信分支转入5 Whys、故障树或实验分析。关系更清楚时应重绘。除非团队验证原因并分配纠正行动,否则一张精美图并不等于RCA成果。
Planned child guides: fishbone diagram template
规划中的子文章: 鱼骨图模板
11. RCA Framework 3: Fault Tree Analysis (FTA)11. RCA框架3:故障树分析(FTA)
Fault tree analysis is a top-down deductive method. Start with an undesired top event, then decompose the conditions that can produce it using logical gates. An OR gate means any listed input can produce the parent event; an AND gate means the specified inputs must occur together. Basic events terminate branches where further decomposition is outside scope or unnecessary. Transfer and conditioning symbols can help manage large trees, but notation should follow the organization's selected standard and remain understandable to reviewers.
故障树分析是一种自上而下的演绎方法。它从不期望的顶事件开始,利用逻辑门分解能够产生该事件的条件。OR门表示任一输入都能产生父事件,AND门表示指定输入必须共同发生。基本事件在超出范围或无需继续分解处结束分支。转移符号和条件符号可帮助管理大型树,但符号体系应遵循组织选定标准,并确保评审者能够理解。
A fault tree differs from a fishbone diagram in purpose and logic. Fishbones broaden discovery and categorize candidate causes; fault trees model combinations sufficient to produce a defined event. Qualitative analysis identifies minimal cut sets—smallest event combinations that can lead to the top event—and highlights single points of failure. Quantitative analysis can estimate top-event probability from event probabilities, but simple multiplication assumes conditions such as independence that often fail when events share power, software, environment, maintenance, or organizational controls.
故障树与鱼骨图在目的和逻辑上不同。鱼骨图扩展探索并分类候选原因;故障树则建模足以产生明确定义事件的组合。定性分析识别最小割集,即能够导致顶事件的最小事件组合,并突出单点故障。定量分析可从事件概率估计顶事件概率,但简单相乘通常假设独立性;当事件共享电源、软件、环境、维护或组织控制时,这一假设容易失效。
For a hypothetical loss of service, the top event might occur through total application failure OR loss of all network paths. Application failure might require an unsafe deployment AND ineffective rollback, while network loss might require two redundant paths to fail through a common configuration mechanism. Validate each gate against architecture and incident evidence. Document probability sources, uncertainty, dependencies, mission time, and model boundaries. Use sensitivity and importance analysis to prioritize defenses, then verify that implemented controls actually change the relevant cut sets.
在假设的服务丢失案例中,顶事件可能由应用完全失败OR所有网络路径丢失产生。应用失败可能需要不安全部署AND回滚失效;网络丢失可能源于两条冗余路径通过共同配置机制同时失败。每个逻辑门都应依据架构与事故证据验证,并记录概率来源、不确定性、依赖、任务时间和模型边界。可使用敏感性与重要度分析确定防御优先级,再验证已实施控制是否真正改变相关割集。
Planned child guides: fault tree analysis fault tree analysis example
12. RCA Methodology12. RCA方法论
Select an RCA technique according to uncertainty, system structure, consequence, and evidence. Use 5 Whys for a relatively narrow mechanism that can be followed with concrete evidence. Use a fishbone when the investigation needs breadth across disciplines. Use a fault tree when combinations, redundancy, barriers, or risk quantification matter. Use timeline and change analysis for temporally complex incidents, barrier analysis when a hazard should have been prevented, and causal graphs or designed experiments when relationships can be formally tested. High-consequence events merit more rigor than routine defects.
RCA技术应根据不确定性、系统结构、后果和证据选择。相对狭窄且可用具体证据追踪的机制适合5 Whys;需要跨专业扩展原因时使用鱼骨图;涉及组合、冗余、防线或风险量化时使用故障树;时间复杂事故需要时间线与变更分析;本应被阻止的危险适合屏障分析;关系可被正式检验时可使用因果图或设计实验。高后果事件应比日常缺陷采用更高严谨度。
| Technique | Primary question | Useful when | Do not confuse with |
|---|---|---|---|
| 5 Whys | What upstream condition explains this step? | Narrow, evidence-rich chain | A fixed five-line form |
| Fishbone | What categories of causes should we test? | Broad team exploration | Proof of every branch |
| Fault tree | What event combinations produce the top event? | Logical barriers and combinations | A free-form brainstorm |
| Causal graph / experiment | Would changing X change Y? | Data and assumptions support testing | Correlation ranking |
| Timeline / change analysis | What changed before and during impact? | Dynamic incidents | Temporal coincidence as proof |
| 技术 | 主要问题 | 适用条件 | 不能混淆为 |
|---|---|---|---|
| 5 Whys | 哪个上游条件解释这一步? | 狭窄且证据丰富的链条 | 固定五行表格 |
| 鱼骨图 | 哪些原因类别需要检验? | 团队广泛探索 | 所有分支都已证明 |
| 故障树 | 哪些事件组合产生顶事件? | 逻辑防线与组合 | 自由头脑风暴 |
| 因果图/实验 | 改变X是否改变Y? | 数据和假设支持检验 | 相关性排序 |
| 时间线/变更分析 | 影响前后发生了什么变化? | 动态事故 | 把时间重合当证明 |
Combine methods in a controlled sequence. Define the event and timeline, use a fishbone to prevent tunnel vision, apply 5 Whys to credible branches, build a fault tree for interacting defenses, and use data or experiments to test contested relationships. Maintain one evidence table linking each causal statement to source, timestamp, reliability, alternative explanation, and reviewer. Then rank actions by risk reduction, feasibility, verification strength, and unintended consequences. The methodology should remain proportionate, reproducible, and independent of the preferred narrative.
方法可按受控顺序组合:先定义事件和时间线,用鱼骨图避免视野狭窄,对可信分支使用5 Whys,为交互防线建立故障树,再用数据或实验检验有争议关系。维护一张证据表,把每项因果陈述与来源、时间戳、可靠性、替代解释和评审人连接起来;随后按风险降低、可行性、验证强度和意外后果排序行动。方法论应保持适度、可复现,并独立于团队偏好的故事。
Use a formal root cause analysis format to make cases comparable without turning the template into a checkbox exercise. Required fields can enforce scope, evidence, ownership, and effectiveness review, while optional annexes hold detailed logs, calculations, diagrams, and interviews. Establish review gates for event definition, causal acceptance, action approval, and closure. An independent reviewer should be able to trace every major conclusion to evidence and reproduce key calculations. If evidence remains insufficient, record the cause as unresolved or probabilistic rather than converting confidence into certainty for administrative convenience.
采用正式根因分析格式可提高案例可比性,但不能把模板变成勾选练习。必填字段用于约束范围、证据、责任和有效性评审,可选附件保存详细日志、计算、图表和访谈。为事件定义、因果接受、行动批准和关闭设置评审门。独立评审者应能把每项主要结论追溯到证据并复现关键计算。如果证据不足,应把原因记录为未解决或概率性结论,而不能为了管理便利把置信度改写成确定性。
Planned child guides: root cause analysis methodology root cause analysis techniques
13. Automated Root Cause Analysis (Automated RCA)13. 自动化根因分析(Automated RCA)
Automated root cause analysis aims to reduce the time between detection and a ranked, evidence-linked set of causal hypotheses. A useful system correlates alerts into incidents, reconstructs topology and dependency context, aligns deployments and configuration changes, compares affected with unaffected cohorts, and retrieves similar resolved cases. It can summarize evidence and recommend next checks. It should not silently declare one root cause from correlation, because shared dependencies, delayed telemetry, feedback loops, and missing variables create plausible but incorrect explanations.
自动化根因分析旨在缩短从检测到获得带证据排序的因果假设集合之间的时间。有效系统会把告警关联成事故,重建拓扑与依赖上下文,对齐部署和配置变更,比较受影响与未受影响群体,并检索相似已解决案例;还可总结证据并建议下一项检查。但它不能仅凭相关性静默宣布单一根因,因为共享依赖、遥测延迟、反馈环和缺失变量会产生看似合理但错误的解释。
Correlation and temporal precedence are screening signals. Causal inference asks stronger questions: under explicit assumptions, would intervening on a candidate change the target outcome, and would the anomaly remain if that node behaved differently? Graphical causal models encode proposed relationships and mechanisms, while attribution methods estimate contributions to an anomalous observation or distribution change. Their outputs depend on graph quality, measurement, causal sufficiency, stability, and identification assumptions. Domain experts must review the graph, tests, uncertainty, and alternative pathways.
相关性和时间先后只是筛选信号。因果推断提出更强问题:在明确假设下,干预候选变量是否会改变目标结果?如果某节点表现不同,异常是否仍会发生?图形因果模型编码拟议关系和机制,归因方法则估计各节点对异常观测或分布变化的贡献。输出依赖因果图质量、测量、因果充分性、稳定性和可识别性假设,因此领域专家必须复核因果图、检验、不确定性与替代路径。
AI-assisted RCA is safest as a copilot with constrained data access, source citations, confidence labels, and human approval. Evaluate it on historical incidents using blinded cause and action records; measure time to a useful hypothesis, evidence precision, missed critical factors, unsupported claims, analyst effort, and action quality. Protect sensitive logs, enforce least privilege, and retain prompts, retrieved evidence, model versions, edits, and final decisions for audit. Never allow generated summaries to overwrite raw evidence or automatically close corrective actions.
AI辅助RCA最安全的定位是具有受限数据访问、来源引用、置信度标签和人工批准的副驾驶。可在历史事故上隐藏原因和行动记录进行评估,测量形成有效假设的时间、证据精确度、遗漏关键因素、无依据陈述、分析人员工作量和行动质量。应保护敏感日志、执行最小权限,并保留提示词、检索证据、模型版本、人工编辑和最终决定用于审计;绝不能让生成摘要覆盖原始证据或自动关闭纠正行动。
Automation also depends on a shared event model. Normalize entity identifiers, clocks, severity, deployment records, topology versions, and incident boundaries before ranking causes. Record data latency and lineage so an apparently absent signal is not treated as proof. Provide investigators with the raw query and retrieval window behind every summarized fact. Where feedback is used to improve ranking, protect against confirmation bias: rejected hypotheses and corrected recommendations are as important as accepted ones. Periodically evaluate whether automation narrows investigation fairly across systems and teams rather than favoring the best-instrumented components.
自动化还依赖共享事件模型。排列原因前应统一实体标识、时钟、严重度、部署记录、拓扑版本和事故边界;记录数据延迟与血缘,避免把表面缺失信号当作证据。每个摘要事实都应向调查人员提供底层查询和检索窗口。利用反馈改进排序时要防止确认偏见:被拒绝假设和被纠正建议与被接受结果同样重要。还应定期评估自动化是否在不同系统与团队间公平缩小调查范围,而不是偏向遥测最完善的组件。
Planned child guides: automated root cause analysis AI root cause analysis
14. RCA Tools and Software14. RCA工具与软件
A tool list is useful only after the product category is chosen. IT observability, pipeline quality, security analytics, network detection, and business metrics each keep their own shortlist. Root cause analysis tools fall into several categories. Visual collaboration tools support fishbones, 5 Whys, timelines, and workshops. Case-management systems track incidents, evidence, approvals, actions, owners, and due dates. Observability and analytics platforms connect metrics, logs, traces, events, topology, and change records. Reliability or quality software supports fault trees, FMEA, statistical analysis, and controlled reports. AI platforms can retrieve evidence and rank hypotheses. Most organizations need an integrated workflow rather than one application that claims to do everything.
工具名单只有在选定产品类别之后才有用。IT 观测、管道质量、安全分析、网络检测和业务指标不共用一份厂商短名单。根因分析工具大致分为几类:可视化协作工具支持鱼骨图、5 Whys、时间线和研讨;案例管理系统跟踪事故、证据、批准、行动、负责人和期限;可观测性与分析平台连接指标、日志、追踪、事件、拓扑和变更记录;可靠性或质量软件支持故障树、FMEA、统计分析和受控报告;AI平台可检索证据并排列假设。多数组织需要集成工作流,而不是声称包办一切的单一应用。
Evaluate RCA software against the process. Require data-source coverage, timestamp normalization, identity and access control, evidence immutability, templates, versioning, action tracking, APIs, export, retention, audit logs, and separation of hypothesis from verified cause. Test search and retrieval with real incident vocabulary. Confirm whether causal claims expose assumptions and evidence, whether model outputs can be reproduced, and whether investigators can correct them. Include deployment model, security review, regional requirements, administration effort, pricing basis, portability, and exit plan.
应根据流程评估RCA软件:数据源覆盖、时间戳归一化、身份与访问控制、证据不可篡改、模板、版本、行动跟踪、API、导出、保留策略、审计日志,以及候选假设与已验证原因的分离。使用真实事故术语测试搜索和检索,确认因果声明是否展示假设与证据、模型输出是否可复现、调查人员是否能纠正。还要考虑部署模式、安全评审、区域要求、管理工作量、计费基础、可移植性与退出计划。
Run a bounded proof of concept with representative incidents: one simple event, one cross-system event, one noisy false alarm, and one case with multiple contributing factors. Measure evidence collection time, hypothesis quality, investigator steps, action completion, integration effort, and audit completeness. A tool is valuable if it improves the controlled investigation and learning loop, not because it draws a diagram automatically. Keep the methodology and evidence portable so process ownership does not become dependent on a vendor-specific score or proprietary incident format.
可使用具有代表性的事故开展有限概念验证:一个简单事件、一个跨系统事件、一个噪声误报以及一个多促成因素案例。测量证据收集时间、假设质量、调查步骤、行动完成、集成工作量与审计完整性。工具的价值在于改善受控调查和学习闭环,而不是自动画图。方法论与证据应保持可移植,避免流程所有权依赖某个供应商特有分数或专有事故格式。
Planned child guides: root cause analysis tools RCA tools RCA software
15. RCA Practice: Industry Applications15. RCA实践:各行业应用
In manufacturing, anomaly detection may score vibration, temperature, current, acoustic, image, dimensional, or yield data. The event definition must respect product, machine state, tool, recipe, material lot, operator context, and measurement system. RCA then joins maintenance history, calibration, process parameters, material certificates, environmental conditions, and inspections. Root cause failure analysis may use a fishbone to broaden candidates, fault trees or FMEA to model failure pathways, and physical examination or designed experiments to verify mechanisms. A model alert alone cannot distinguish sensor drift from equipment degradation.
制造业异常检测可对振动、温度、电流、声学、图像、尺寸或良率数据评分。事件定义必须考虑产品、机器状态、刀具、配方、材料批次、操作上下文和测量系统。RCA随后连接维护历史、校准、过程参数、材料证明、环境条件和检查结果。根因失效分析可用鱼骨图扩展候选,用故障树或FMEA建模失效路径,再通过物理检查或设计实验验证机制。仅凭模型告警无法区分传感器漂移与设备退化。
In IT operations, detectors watch latency, error rate, saturation, traffic, logs, traces, and deployment behavior. Triage should center customer symptoms and actionability, then correlate service topology, configuration, releases, dependencies, quotas, and demand. Build a blameless timeline and distinguish latent hazards from triggers. A configuration push may trigger an outage whose deeper causes include unsafe defaults, inadequate testing, shared failure domains, or ineffective rollback. Corrective actions should strengthen design and recovery, not simply instruct an operator to avoid repeating a mistake.
IT运维检测器监控延迟、错误率、饱和度、流量、日志、追踪和部署行为。初筛应以客户症状和可行动性为中心,再关联服务拓扑、配置、发布、依赖、配额和需求。应构建无责时间线,并区分潜在危险与触发因素。配置推送可能触发中断,但更深层原因可能是不安全默认值、测试不足、共享故障域或回滚无效。纠正行动应增强设计与恢复能力,而不是只要求操作人员不要再犯。
Root cause analysis in healthcare requires patient-safety governance, privacy controls, multidisciplinary participation, and careful handling of hindsight and blame. Sources can include clinical workflows, orders, medication administration, device records, staffing, environment, communication, policies, and outcomes. Five Whys and fishbones can help practices explore factors, but serious adverse events need a structured process that produces strong actions and risk reduction. That process is the capability set for a patient-safety event. Automated signals must be clinically validated, reviewed for subgroup performance, and treated as decision support rather than autonomous diagnosis.
医疗根因分析需要患者安全治理、隐私控制、多学科参与,并谨慎处理事后偏见与归责。证据来源可包括临床流程、医嘱、用药执行、设备记录、人员配置、环境、沟通、政策和结局。5 Whys与鱼骨图可帮助机构探索因素,但严重不良事件需要形成强行动和风险降低的结构化流程。这套流程就是患者安全事件所需的能力组合。自动化信号必须经过临床验证,检查不同亚组表现,并作为决策支持而非自主诊断。
Planned child guides: root cause capabilities for patient-safety events root cause failure analysis
规划中的子文章: 患者安全事件的根因能力 根因失效分析
16. End-to-End Anomaly Detection + RCA Workflow16. 异常检测 + RCA端到端流程
A reliable program connects seven stages: collect, monitor, detect, alert, identify causes, fix, and review. At collection, define ownership, schemas, timestamps, units, lineage, access, retention, and quality checks. At monitoring, establish comparable cohorts, baselines, freshness, and known operating states. At detection, version features, models, thresholds, and score interpretation. At alerting, group related scores into incidents, suppress duplicates, show impact and evidence, and route only actionable notifications to the right responder.
可靠体系连接七个阶段:采集、监控、检测、告警、根因定位、修复与复盘。采集阶段定义所有权、模式、时间戳、单位、血缘、访问、保留和质量检查;监控阶段建立可比较群体、基线、新鲜度和已知运行状态;检测阶段对特征、模型、阈值和分数解释做版本管理;告警阶段把相关分数合并成事故、抑制重复、展示影响与证据,并只把可行动通知路由给正确响应者。
- 1. Define the adverse event and decision target before modeling.
- 2. Preserve raw data and context; create a reproducible event package.
- 3. Triage impact and contain harm without destroying evidence.
- 4. Build the timeline, topology, changes, and candidate causal paths.
- 5. Test hypotheses with records, comparisons, experiments, or inspection.
- 6. Assign corrective actions with owners, due dates, and verification metrics.
- 7. Review outcomes, update controls and knowledge, and monitor recurrence.
- 1. 建模前定义不良事件与决策目标。
- 2. 保存原始数据与上下文,形成可复现事件包。
- 3. 评估影响并遏制伤害,同时避免破坏证据。
- 4. 构建时间线、拓扑、变更与候选因果路径。
- 5. 使用记录、对照、实验或检查检验假设。
- 6. 分配带负责人、期限和验证指标的纠正行动。
- 7. 复盘结果、更新控制与知识,并监测复发。
Keep detection and RCA artifacts linked through stable identifiers. An incident package should include the raw observation window, feature snapshot, model and threshold version, alert history, affected entities, topology, recent changes, investigation notes, evidence citations, causal graph or diagram versions, decisions, actions, and effectiveness results. This supports reproducibility and later learning. It also lets teams distinguish detector failure, telemetry failure, response failure, and underlying system failure rather than collapsing every poor outcome into one category.
检测与RCA产物应通过稳定标识符连接。事故包应包含原始观测窗口、特征快照、模型与阈值版本、告警历史、受影响实体、拓扑、近期变更、调查笔记、证据引用、因果图或图表版本、决定、行动和有效性结果。这既支持复现与后续学习,也帮助团队区分检测器故障、遥测故障、响应故障和底层系统故障,而不是把所有不良结果归为一类。
Measure the whole loop. Detection metrics include event precision and recall, time to detect, false alerts, and coverage. Response metrics include time to acknowledge, contain, and restore. RCA metrics include time to a supported hypothesis, evidence completeness, action strength, overdue actions, recurrence, and verified risk reduction. Avoid rewarding teams for closing many investigations quickly if causal claims are weak or actions remain incomplete. A slower analysis that prevents recurrence may deliver more value than a fast label attached to an alert.
应测量整个闭环。检测指标包括事件精确率与召回率、发现时间、误报和覆盖;响应指标包括确认、遏制和恢复时间;RCA指标包括形成受支持假设的时间、证据完整度、行动强度、逾期行动、复发与已验证风险降低。如果因果声明薄弱或行动未完成,不能用快速关闭大量调查来奖励团队。一项较慢但能防止复发的分析,可能比迅速给告警贴上原因标签更有价值。
17. Best Practices17. 最佳实践
Optimize thresholds as a decision policy. Plot score distributions by time and segment, map thresholds to alert volume and known-event capture, and include the capacity and consequence of review. Use hysteresis, persistence, cooldowns, deduplication, and event grouping where appropriate. Alert fatigue is not solved by raising every threshold; remove non-actionable alerts, improve routing and context, and monitor silent misses. Recalibration should be approved, versioned, backtested, and reversible, with previous decisions reproducible under their original policy.
阈值优化应被视为决策策略。按时间和分段绘制分数分布,把阈值与告警量、已知事件捕获相连接,并纳入复核容量与后果。适当使用迟滞、持续时间、冷却、去重和事件分组。解决告警疲劳不能简单提高所有阈值;应删除不可行动告警、改善路由和上下文,并监控静默漏报。重新校准必须经过批准、版本化、回测且可回滚,历史决策应能按原策略复现。
Design explainability for the responder. Show the baseline, current observation, score direction, threshold, contributing signals, comparable peers, recent changes, data quality status, and uncertainty. For sequence models, show the relevant window and residuals; for Isolation Forest or LOF, show useful feature and neighbor context; for automated RCA, separate retrieved facts, model interpretation, causal hypotheses, and verified findings. Explanations must support the next check and must not imply causality that the method cannot establish.
可解释性应面向响应者设计。展示基线、当前观测、分数方向、阈值、贡献信号、可比同类、近期变更、数据质量状态和不确定性。序列模型展示相关窗口与残差;隔离森林或LOF展示有用特征和邻居上下文;自动化RCA则分离检索事实、模型解释、因果假设和已验证发现。解释应支持下一项检查,且不能暗示方法无法确立的因果关系。
Operate models and knowledge continuously. Monitor data and concept drift, missingness, feature freshness, score calibration, subgroup behavior, feedback latency, and reviewer disagreement. Retraining requires a defined trigger, clean reference interval, reproducible pipeline, approval, shadow evaluation, and rollback. Feed resolved incidents into a governed knowledge base with taxonomy, symptoms, conditions, evidence, actions, and verification results. Review recurring patterns across incidents, but do not copy an old root cause onto a new event merely because symptoms resemble each other.
模型和知识都需要持续运营。监控数据与概念漂移、缺失、特征新鲜度、分数校准、亚组表现、反馈延迟和复核分歧。重训需要明确触发、干净参考期、可复现管线、批准、影子评估与回滚。把已解决事故以分类、症状、条件、证据、行动和验证结果写入受治理知识库;跨事故审查重复模式,但不能仅因症状相似就把旧根因复制到新事件。
Build governance around change. Assign owners for data, model, threshold, alert route, investigation, corrective action, and audit. Protect sensitive data with least privilege and retention controls. Review performance after planned releases, seasonal transitions, and major operational changes. Exercise the process with simulations or known challenge events. Finally, preserve the ability to fall back to transparent rules and manual investigation when models, integrations, or AI services are unavailable. Resilience applies to the diagnostic system as well as the system it monitors.
围绕变更建立治理。为数据、模型、阈值、告警路由、调查、纠正行动和审计分配负责人;以最小权限与保留控制保护敏感数据;在计划发布、季节转换和重大运营变化后评审表现;使用演练或已知挑战事件测试流程。当模型、集成或AI服务不可用时,必须能够回退到透明规则和人工调查。韧性不仅适用于被监控系统,也适用于诊断系统本身。
Schedule periodic audits of both detection and diagnosis. Sample alerts that were closed quickly, incidents that detectors missed, repeated actions, and cases whose root cause was later revised. Check whether evidence links still resolve, access remains appropriate, models can be reconstructed, and action verification was completed. Compare recurrence by causal category, not only by identical symptom. Publish lessons at the level permitted by governance and retire obsolete thresholds, templates, and playbooks. A living program deliberately removes controls that no longer work instead of accumulating dashboards and rules indefinitely.
应定期审计检测与诊断。抽样检查快速关闭的告警、检测器漏掉的事故、重复行动以及后来修订根因的案例;确认链接证据仍可访问、权限仍适当、模型可重建且行动验证已完成。复发应按因果类别比较,而不只看相同症状。在治理允许范围内发布经验,并淘汰过时阈值、模板和手册。一个有生命力的体系会主动移除失效控制,而不是无限累积仪表板与规则。
18. Summary and Next Steps18. 总结与下一步
Advanced anomaly detection and root cause analysis form one decision system. Start with statistical baselines, introduce ML only for high-dimensional, nonlinear, temporal, or scale requirements, and compare every model under the same event definition and alert budget. Isolation Forest offers a strong tabular baseline, autoencoders learn complex representations, LOF detects local density departures, and change-point methods identify regime boundaries. None explains cause by itself. RCA converts detected events into tested causal statements, corrective actions, and verified learning.
高级异常检测与根因分析共同构成一个决策系统。先从统计基线开始,仅在高维、非线性、时序或规模需要时引入ML,并在相同事件定义和告警预算下比较模型。隔离森林是有力的表格基线,自编码器学习复杂表示,LOF发现局部密度偏离,变点方法识别状态边界;它们都不能独立解释原因。RCA把检测事件转化为经过检验的因果陈述、纠正行动和已验证学习。
Use 5 Whys for a tested chain, fishbones for breadth, fault trees for event combinations, and causal or experimental methods when stronger attribution is required. Preserve evidence, alternatives, uncertainty, ownership, and effectiveness measures. Continue with the 21 focused child guides below; their routes are staged until those pages are deployed. Together they cover each detector, diagnostic framework, tool category, template, example, and industry application addressed in this guide.
使用5 Whys追踪经验证链条,使用鱼骨图扩展范围,使用故障树分析事件组合,在需要更强归因时使用因果或实验方法。保存证据、替代解释、不确定性、负责人和有效性指标。可继续阅读下方21篇聚焦子文章;这些路由在页面部署前保持规划状态。它们共同覆盖本指南涉及的每种检测器、诊断框架、工具类别、模板、示例和行业应用。
Once anomaly scores, alert evidence, investigation records, and action outcomes are stored in connected databases, InfiniSynapse supports direct database connections and authorized analysis across multiple sources without requiring a complex migration first. Teams can prepare governed datasets for joint review alongside relevant operational records. This verified capability does not mean InfiniSynapse performs the anomaly models or automatically proves root causes; model selection, causal validation, and corrective-action approval remain responsibilities of the implementation team.
当异常分数、告警证据、调查记录和行动结果存储在已连接数据库中后,InfiniSynapse支持直接数据库连接,并允许获得授权的团队在无需先进行复杂迁移的情况下开展多源联合分析。团队可准备受治理数据集,与相关运营记录共同复核。该已验证能力并不表示InfiniSynapse执行异常模型或自动证明根因;模型选择、因果验证与纠正行动批准仍由实施团队负责。
Connect the databases that contain validated scores, alerts, incident evidence, and RCA actions, then analyze authorized records together without a complex migration first.
连接保存已验证分数、告警、事故证据和RCA行动的数据库,在无需先进行复杂迁移的情况下联合分析获授权记录。
Book a Demo预约演示Planned child guides: isolation forest anomaly detection autoencoder anomaly detection time series anomaly detection change point detection root cause analysis tools RCA tools RCA software root cause analysis techniques root cause analysis methodology root cause analysis format root cause identification root cause failure analysis automated root cause analysis AI root cause analysis fishbone diagram template fishbone diagram examples fault tree analysis fault tree analysis example 5 whys template root cause capabilities for patient-safety events
规划中的子文章: 隔离森林异常检测 自编码器异常检测 时间序列异常检测 变点检测 根因分析工具 RCA工具 RCA软件 根因分析技术 根因分析方法论 根因分析格式 根因识别 根因失效分析 自动化根因分析 AI根因分析 鱼骨图模板 鱼骨图示例 故障树分析 故障树分析示例 5 Whys模板 患者安全事件的根因能力
Frequently Asked Questions常见问题
Five categories share the label: IT observability, data-pipeline quality, security analytics, network anomaly detection, and business metrics. The first four can trace a technical root cause to a service, job, account, or device. Business-metric anomalies often stop at a commercial cause. Pick the category before Isolation Forest, change points, 5 Whys, fishbones, or fault trees.
五个类别共用这个名字:IT 观测、数据管道质量、安全分析、网络异常和业务指标。前四类可以把技术根因追到服务、作业、账号或设备。业务指标异常常常停在商业原因。先选类别,再用隔离森林、变点、5 Whys、鱼骨图或故障树。
Anomaly detection identifies a material departure from an expected pattern; root cause analysis tests why it happened and which corrective action can prevent recurrence.
异常检测识别相对于预期模式的实质偏离;根因分析检验偏离为何发生,以及哪项纠正行动能够防止复发。
Start with the simplest method that matches the anomaly definition: residuals or SPC for stable processes, Isolation Forest for broad tabular screening, LOF for local density, autoencoders for complex representations, and change-point methods for regime shifts.
从符合异常定义的最简单方法开始:稳定过程用残差或SPC,广泛表格筛查用隔离森林,局部密度用LOF,复杂表示用自编码器,状态转换用变点方法。
No. An anomaly score ranks departure from a model or baseline. Root cause claims require event context, competing hypotheses, evidence, causal reasoning, and verification.
不能。异常分数只排列相对于模型或基线的偏离;根因声明需要事件上下文、竞争假设、证据、因果推理与验证。
Calibrate thresholds against time-separated validation data, known events, false-positive and miss costs, alert capacity, event grouping, and required detection delay; version every change.
应依据时间隔离验证数据、已知事件、误报与漏报成本、告警容量、事件分组和检测延迟校准阈值,并对每次变更做版本管理。
Use 5 Whys for a narrow evidence-backed chain, a fishbone to explore broad cause categories, and a fault tree to model logical combinations that can produce a defined top event.
狭窄且有证据支持的链条使用5 Whys,广泛探索原因类别使用鱼骨图,建模能够产生明确定义顶事件的逻辑组合使用故障树。
Parts can be automated, including incident correlation, topology reconstruction, change alignment, evidence retrieval, and hypothesis ranking, but verified causal conclusions and corrective actions require accountable human review.
事故关联、拓扑重建、变更对齐、证据检索和假设排序可以自动化,但已验证因果结论与纠正行动仍需要有责任主体的人工复核。
It should contain scope, impact, timeline, sources, hypotheses, evidence, causal reasoning, containment, corrective actions, owners, due dates, verification measures, residual risk, and approval.
应包含范围、影响、时间线、来源、假设、证据、因果推理、遏制、纠正行动、负责人、期限、验证指标、剩余风险与批准。
Define an effectiveness measure before implementation, monitor leading and lagging indicators for an appropriate period, check for recurrence and unintended effects, and document the evidence used to close the action.
实施前定义有效性指标,在适当周期内监控先行与滞后指标,检查复发与意外影响,并记录关闭行动所依据的证据。
Sources and Evidence Notes资料来源与证据说明
Algorithm references include the original Isolation Forest paper, current scikit-learn Isolation Forest documentation, and scikit-learn Local Outlier Factor documentation. The implementation pages specify score behavior, parameters, and the important difference between LOF outlier and novelty modes. Library versions and defaults can change, so verify the installed version and record every parameter used.
算法资料包括隔离森林原始论文、当前scikit-learn隔离森林文档以及scikit-learn局部离群因子文档。实现页面说明了分数行为、参数和LOF离群模式与新颖性模式的重要差异。库版本与默认值会变化,因此应核对安装版本并记录所有参数。
For time-series methods, see the statsmodels STL decomposition example, the NIST control-chart overview, and the NIST CUSUM guidance. These references support decomposition, control-limit interpretation, and cumulative detection of sustained shifts. They do not remove the need to validate period, baseline, distribution, and operating context for the actual process.
时间序列方法可参考statsmodels STL分解示例、NIST控制图概览和NIST CUSUM指南。这些资料支持分解、控制限解释和持续偏移的累积检测,但不能替代对实际过程周期、基线、分布和运行上下文的验证。
For diagnostic frameworks, consult the CMS Five Whys tool, the CMS quality-improvement resource guide covering fishbones, and NASA's Fault Tree Handbook with Aerospace Applications. Healthcare context is informed by the AHRQ PSNet root cause analysis primer. For automated causal attribution, see DoWhy root-cause analysis documentation; its outputs depend on explicit graph and model assumptions.
诊断框架可参考CMS Five Whys工具、包含鱼骨图的CMS质量改进资源指南以及NASA的航空航天应用故障树手册。医疗语境参考AHRQ PSNet根因分析资料;自动化因果归因可参考DoWhy根因分析文档,其输出依赖明确的因果图与模型假设。