 InfiniSynapse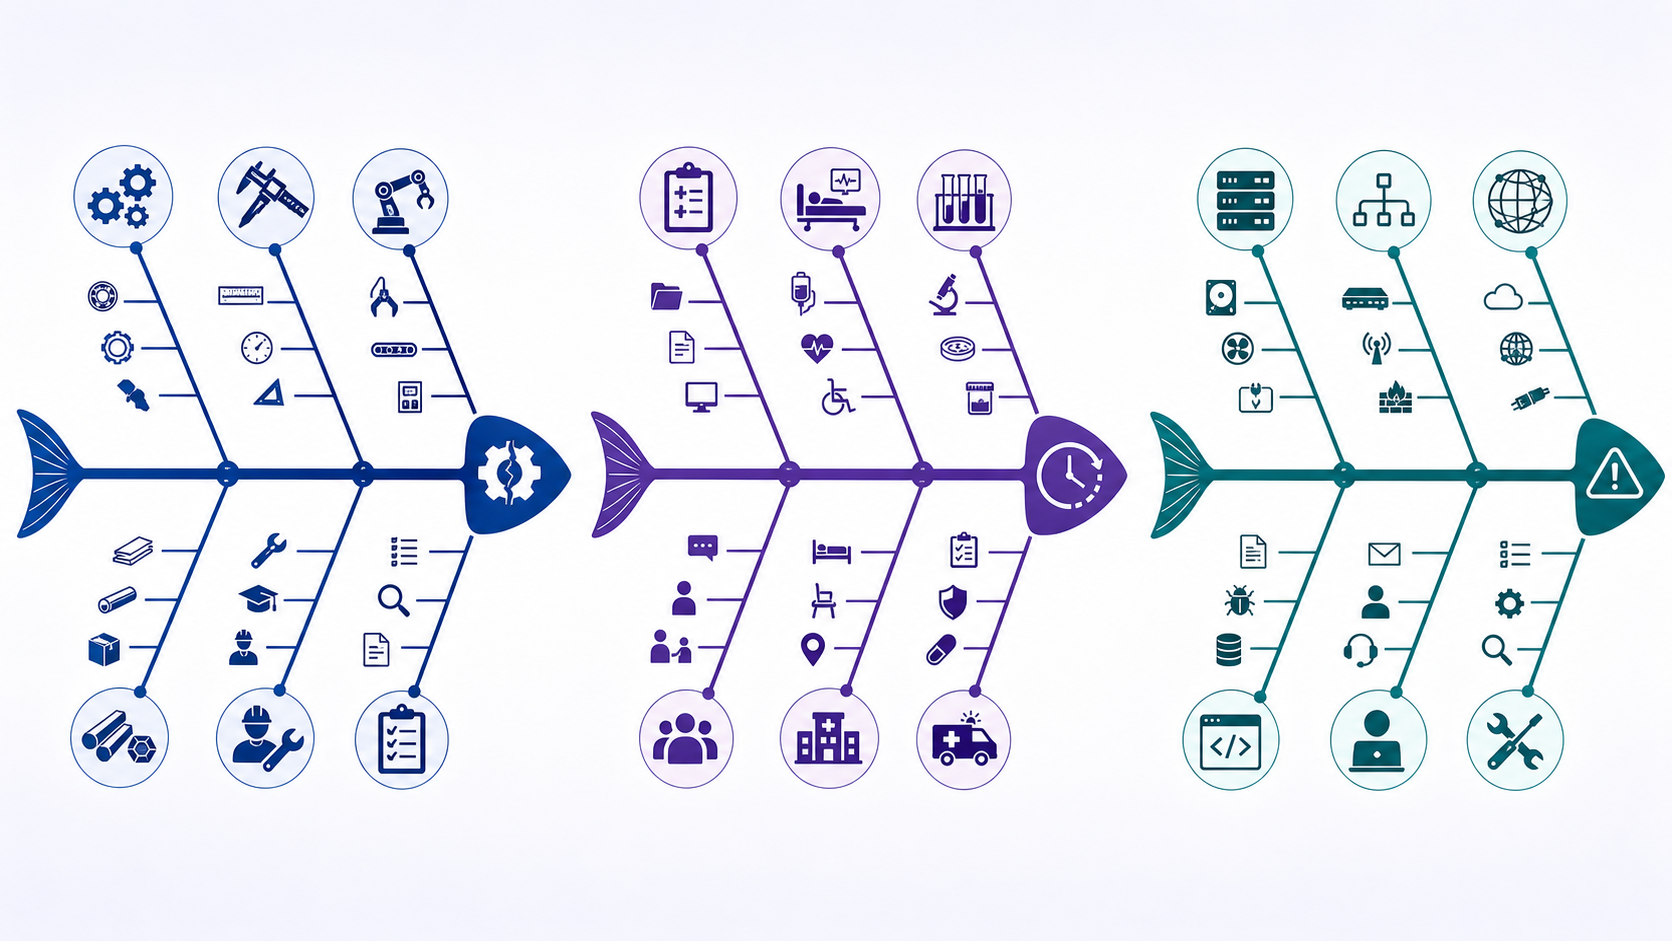
What do good fishbone diagram examples show?优质鱼骨图示例应展示什么?
This focused article is part of the anomaly detection and root cause analysis guide; use the pillar guide to compare related concepts, methods, and implementation decisions across the full topic.
本文是异常检测与根因分析指南内容集群中的专题文章;如需比较完整主题下的相关概念、方法与实施决策,请返回基石指南。
Fishbone diagram examples show how a clearly defined effect can be decomposed into categories of possible causes, then converted into an evidence plan. A finished diagram is not proof of a root cause. It is a structured hypothesis map: each branch should be specific enough to observe, compare, measure, or disprove.
鱼骨图示例展示如何把一个定义清楚的结果拆分为不同类别的可能原因,再转化为证据计划。填写完成的图并不是根因证明,而是一张结构化假设地图:每个分支都应具体到可以观察、比较、测量或证伪。
The examples below are hypothetical teaching cases, not customer stories or reported performance results. They cover manufacturing, healthcare operations, IT services, logistics, customer support, and data quality because category sets should follow the process rather than force every problem into the classic manufacturing 6M model.
以下案例均为教学用途的假设示例,不是客户案例或已报告的绩效结果。内容覆盖制造、医疗运营、IT 服务、物流、客户支持和数据质量,因为类别应服从实际流程,而不是强迫所有问题套用经典制造业 6M 模型。
Read the anatomy before copying an Ishikawa diagram example复制石川图示例前,先读懂图的结构
Put one measurable effect at the head: who or what was affected, what deviated, where it occurred, and during which period. The spine connects that effect to major cause categories. Large ribs hold categories; smaller ribs hold possible causes and deeper “why” branches. Avoid writing solutions, blame, or conclusions as causes.
鱼头只放一个可测量的结果:谁或什么受到影响、发生了何种偏差、在哪里发生、时间范围是什么。主干把结果连接到主要原因类别;大骨承载类别,小骨承载候选原因和更深层的“为什么”。不要把解决方案、指责或结论写成原因。
| Framework框架 | Categories类别 | Best fit适合场景 |
|---|---|---|
| 6M | Manpower, Machine, Method, Material, Measurement, Environment人员、机器、方法、材料、测量、环境 | Manufacturing and physical processes制造与实体流程 |
| 4S | Surroundings, Suppliers, Systems, Skills环境、供应商、系统、技能 | Service and administrative work服务与行政工作 |
| 8P | People, Process, Policies, Procedures, Place, Product, Price, Promotion人员、流程、政策、程序、场所、产品、价格、推广 | Service, marketing, and customer experience服务、营销与客户体验 |
| Custom自定义 | Data, code, infrastructure, dependency, deployment, controls数据、代码、基础设施、依赖、发布、控制 | IT, analytics, and software incidentsIT、分析与软件事件 |
“Manpower” is the traditional label, but “People” is usually clearer and more inclusive. Categories are prompts, not laws. Combine empty categories, split overloaded ones, and rename them in language that participants recognize.
“Manpower(人力)”是传统标签,但“People(人员)”通常更清晰、更具包容性。类别只是提示,不是规则。可合并空类别、拆分过载类别,并使用参与者熟悉的语言重命名。
One fishbone RCA example: leaking seals on Line B一则鱼骨图 RCA 示例:B 线密封泄漏
Effect at the head: “Seal leakage found during final pressure testing on Line B during the second shift.” This is more useful than “poor quality” because it fixes the defect, checkpoint, line, and period. The team uses 6M categories and writes candidate causes without treating any one of them as established.
鱼头结果:“B 线二班产品在最终压力测试中发现密封泄漏。”这比“质量差”更有用,因为它限定了缺陷、检查点、产线和时段。团队采用 6M 类别,记录候选原因,但不把任何一项直接当作已确认事实。
- When: the second shift.时间:二班。
- Where: Line B, final pressure test.地点:B 线,最终压力测试。
- What: seal leakage. The bones use the manufacturing 6Ms. None of them is the cause yet.现象:密封泄漏。鱼骨用制造业 6M。任何一项都还不是已确认原因。
Setup changeover steps unclear; torque sequence differs by operator; inspection handoff is incomplete.
换线设置步骤不清;不同操作员的扭矩顺序不一致;检验交接不完整。
Applicator alignment drift; worn fixture; seal lot dimensions or surface condition vary.
涂胶器对中漂移;夹具磨损;密封批次尺寸或表面状态变化。
Gauge calibration overdue; sampling misses shift transitions; humidity affects cure time.
量具校准逾期;抽样遗漏班次转换;湿度影响固化时间。
Defect rate by line, shift, lot, operator, fixture, humidity, torque trace, and calibration status.
按产线、班次、批次、操作员、夹具、湿度、扭矩曲线和校准状态统计缺陷率。
A strong next test stratifies results by lot and fixture, checks whether leakage begins after changeover, verifies calibration records, and measures applicator alignment. If one seal lot appears associated with defects, quarantine and dimensional inspection can test that branch. Association narrows the investigation; it still does not prove mechanism.
有效的下一步检验会按批次和夹具分层结果,检查泄漏是否始于换线之后,核对校准记录并测量涂胶器对中情况。如果某个密封批次与缺陷相关,可通过隔离和尺寸检验测试该分支。相关性可以缩小调查范围,但仍不能证明机制。
Fishbone diagram example in healthcare: delayed discharge医疗鱼骨图示例:出院延迟
Effect at the head: “Medically cleared patients on Ward C leave more than four hours after the discharge decision.” The diagram should examine the workflow, not blame a profession. Useful categories are People, Process, Equipment, Information, Environment, and Policy.
鱼头结果:“C 病区已达到医学出院条件的患者,在作出出院决定四小时后仍未离院。”图应检查工作流,而不是指责某个职业群体。可用类别包括人员、流程、设备、信息、环境与政策。
- People: role ownership is unclear during shift change; family transport coordination starts late.人员:交班期间职责归属不清;家属交通协调启动过晚。
- Process: pharmacy, education, transport, and paperwork run sequentially when some steps could overlap.流程:药房、宣教、交通和文书按顺序执行,而部分步骤本可并行。
- Information and policy: discharge criteria are recorded in different systems; approval rules create rework.信息与政策:出院标准分散在不同系统中;审批规则造成返工。
- Environment and equipment: peak elevator demand, printer availability, or wheelchair supply may add delay.环境与设备:电梯高峰、打印机可用性或轮椅供应可能增加延迟。
Because healthcare investigations can affect safety, use the diagram to organize questions and follow the organization’s formal quality and privacy procedures. Compare timestamps for decision, medication readiness, education completion, transport request, and actual departure. Do not infer individual fault from aggregate timing data.
医疗调查可能影响安全,因此应把鱼骨图用于组织问题,同时遵循机构正式的质量与隐私程序。比较出院决定、药物准备、宣教完成、交通请求和实际离院时间戳,不要从汇总时间数据推断个人过错。
Fishbone diagram for an IT problem: recurring API timeoutsIT 问题鱼骨图示例:API 反复超时
Effect at the head: “Checkout API p95 latency exceeds the service target for 20–30 minutes after the Monday deployment.” Use categories that match software operations: Application, Infrastructure, Data, Dependencies, Deployment, Observability, and Process.
鱼头结果:“每周一发布后 20–30 分钟内,结账 API 的 p95 延迟超过服务目标。”使用与软件运营相符的类别:应用、基础设施、数据、依赖、发布、可观测性和流程。
| Branch分支 | Candidate cause候选原因 | Test检验 |
|---|---|---|
| Application应用 | Cold cache increases query count冷缓存增加查询次数 | Compare traces and query counts before and after warm-up比较预热前后的链路追踪与查询次数 |
| Dependency依赖 | Payment provider throttles bursts支付提供方限制突发流量 | Align provider response codes and retry volume对齐提供方响应码与重试量 |
| Deployment发布 | Connection pools start below demand连接池初始容量低于需求 | Replay with alternative pool settings in a safe environment在安全环境中用不同连接池设置回放 |
| Observability可观测性 | Dashboard aggregation hides one region看板聚合掩盖某个区域 | Segment latency and errors by region and version按区域与版本拆分延迟和错误 |
The strongest test distinguishes competing explanations. For example, if the timeout repeats after a rollback, a code-only explanation weakens. If warming the cache changes query volume but not latency, the cache branch may be secondary. Preserve deployment IDs, traces, configuration, and external status data so the timeline can be reproduced.
最有效的检验应能区分竞争解释。例如,回滚后超时仍复现,会削弱“仅由代码导致”的解释;如果缓存预热改变了查询量却没有改变延迟,缓存分支可能只是次要因素。应保存发布 ID、链路追踪、配置和外部状态数据,以便重建时间线。
Fishbone RCA examples for logistics, service, and data quality物流、服务与数据质量的鱼骨图 RCA 示例
Logistics: late deliveries物流:配送延迟
Head: “Priority orders miss the promised window in the north zone.” Categories: demand, routing, warehouse, carrier, address data, weather, communication. Test route plans, scan timestamps, capacity, address corrections, and zone-level delay.
鱼头:“北区优先订单未在承诺时间内送达。”类别:需求、路线、仓库、承运商、地址数据、天气、沟通。检验路线计划、扫描时间戳、产能、地址修正和区域延迟。
Customer service: repeat contacts客户服务:重复联系
Head: “Billing cases receive another contact within seven days.” Categories: people, policy, knowledge, channel, system, handoff. Test repeat rate by issue, channel, resolution code, agent tenure, and missing knowledge content.
鱼头:“账单问题在七天内再次收到联系。”类别:人员、政策、知识、渠道、系统、交接。按问题、渠道、解决代码、人员经验和缺失知识内容检验重复率。
Data quality: duplicate records数据质量:重复记录
Head: “Daily customer table contains duplicate active identifiers.” Categories: source, ingestion, matching, schema, scheduling, monitoring, ownership. Test source keys, retry behavior, merge rules, job overlap, and alert thresholds.
鱼头:“每日客户表包含重复的有效标识符。”类别:来源、摄取、匹配、模式、调度、监控、归属。检验源键、重试行为、合并规则、作业重叠和告警阈值。
Service workflow: long approval time服务流程:审批时间过长
Head: “Standard requests exceed the five-day internal target.” Categories: request quality, roles, policy, queue, system, exceptions. Test waiting versus work time, rejection reasons, queue age, handoffs, and exception frequency.
鱼头:“标准请求超过五天内部目标。”类别:请求质量、角色、政策、队列、系统、例外。检验等待与工作时间、退回原因、队列年龄、交接和例外频率。
Notice how every example names an observable effect and uses process-specific categories. A copied diagram becomes useful only after its language, boundaries, evidence sources, and decision are adapted to the real case.
这些示例都命名了可观察的结果,并使用流程特定类别。复制来的图只有在其语言、边界、证据来源和决策适配真实案例后才有价值。
How to build a fishbone diagram from an example如何从示例创建自己的鱼骨图
Copy the head, the six bones, and the next test from the seal case. When you need a blank diagram, start from the fishbone diagram template.
从密封案例抄鱼头、六根骨头和下一步检验。需要空白图时,从鱼骨图模板开始。
- Define one effect定义一个结果Write the deviation, object, location, and time window. Confirm scope and immediate containment separately.写清偏差、对象、地点和时间窗口,并分别确认范围与立即遏制措施。
- Bring the right evidence and perspectives准备合适的证据与视角Prepare logs, records, samples, photos, timelines, process maps, and participants who know different stages.准备日志、记录、样本、照片、时间线、流程图,以及了解不同阶段的参与者。
- Choose and rename categories选择并重命名类别Start with 6M, 4S, 8P, or a custom set. Keep categories mutually understandable, not artificially perfect.从 6M、4S、8P 或自定义组合开始。类别应便于共同理解,不必追求形式上的完美互斥。
- Generate specific candidate causes生成具体候选原因Ask what condition could create the effect and why it might exist. Avoid “operator error,” “bad process,” and other untestable labels.询问什么条件可能产生该结果,以及该条件为何存在。避免“操作员错误”“流程差”等不可检验标签。
- Prioritize without voting causes into truth确定优先级,但不要用投票制造事实Rank by plausibility, consequence, available evidence, and test cost. Voting can choose where to start; it cannot establish causation.按合理性、后果、可用证据和检验成本排序。投票可以选择起点,但不能确立因果。
- Test, update, and verify action检验、更新并验证措施Record supporting and contradicting evidence, remove weak branches, add newly observed ones, and verify whether corrective action changes the defined effect.记录支持与反对证据,删除薄弱分支,加入新观察到的分支,并验证纠正措施是否改变已定义结果。
Turn fishbone branches into an evidence matrix把鱼骨分支转化为证据矩阵
For each candidate, record the predicted observation, data source, comparison, owner, status, and decision rule. A useful prediction is discriminating: it should be more likely if this branch is causal than if an alternative branch is causal. Include evidence that would disconfirm the favored explanation.
针对每个候选原因,记录预期观察、数据来源、比较方式、负责人、状态和决策规则。有用的预测应具有区分性:如果该分支具有因果作用,它出现的可能性应高于替代分支成立时。还要记录能够否定偏好解释的证据。
| Candidate候选原因 | Prediction预测 | Comparison比较 | Decision判断 |
|---|---|---|---|
| Fixture wear夹具磨损 | Leakage concentrates on one fixture and changes after replacement泄漏集中在某夹具,更换后发生变化 | Fixture-level defect rate before and after controlled replacement受控更换前后的夹具级缺陷率 | Support only if timing and mechanism align仅在时间与机制一致时支持 |
| Connection pool startup连接池启动 | Timeout falls when initial capacity changes under equivalent load等效负载下提高初始容量后超时下降 | Safe replay with controlled configuration采用受控配置进行安全回放 | Check side effects and repeatability检查副作用与可重复性 |
When controlled intervention is unsafe or impossible, use converging evidence: sequence, specificity, dose or exposure pattern, mechanism, comparison groups, and recurrence after change. State remaining uncertainty. Corrective action should address both the causal condition and the control gap that allowed it to persist or escape detection.
当受控干预不安全或不可行时,应使用汇聚证据:时间顺序、特异性、剂量或暴露模式、机制、对照组,以及变更后的复发情况。明确剩余不确定性。纠正措施应同时处理因果条件,以及让该条件持续存在或未被发现的控制缺口。
Analyze the evidence behind your fishbone branches分析鱼骨分支背后的证据
Prepare a precise problem statement plus relevant tables, logs, files, timestamps, and category definitions. InfiniSynapse can analyze data you connect or upload and return tables, charts, and written analytical summaries. Use those outputs to compare candidate branches; keep domain review and causal verification in the investigation workflow.
请先准备精确的问题陈述,以及相关表格、日志、文件、时间戳和类别定义。InfiniSynapse 可以分析你连接或上传的数据,并返回表格、图表和书面分析摘要。用这些输出比较候选分支,同时在调查流程中保留领域复核与因果验证。
Analyze your root-cause evidence分析你的根因证据When a fishbone RCA example hands off to 5 Whys鱼骨图 RCA 示例何时交给五问法
On the seal case, 5 Whys follows one bone, such as applicator alignment, down to a setting someone can maintain. The fishbone first lays out People, Machine, Method, Material, Measurement, and Environment so a narrow chain is not the only path examined. Use 5 Whys root cause analysis on a branch the evidence has not already rejected.
在密封案例里,五问法沿着一根骨头往下走,例如涂布对准,直到落到一个可以维护的设置。鱼骨图先铺开人员、机器、方法、材料、测量和环境,避免只检查一条窄链。对证据尚未否定的分支,使用五问法根因分析。
Common mistakes when using fishbone diagram examples使用鱼骨图示例时的常见错误
- Vague head: “Low performance” combines several effects and prevents a clear evidence boundary.鱼头模糊:“性能低”混合多个结果,无法建立清晰证据边界。
- Copying categories mechanically: Material and Machine may add little to a software incident, while deployment and dependency are essential.机械复制类别:材料和机器对软件事件可能帮助很小,而发布与依赖却不可缺少。
- Blame as a branch: “Human error” hides training, interface, workload, authority, procedure, and control conditions.把指责当分支:“人为错误”掩盖培训、界面、工作量、权限、程序和控制条件。
- Voting equals proof: group confidence can reflect familiarity, hierarchy, or recent events rather than causal evidence.把投票当证明:群体信心可能反映熟悉度、层级或近期事件,而不是因果证据。
- Stopping at symptoms: “Database slow” restates an observation; it does not explain the query, resource, configuration, or demand mechanism.停在症状:“数据库慢”只是重复观察,没有解释查询、资源、配置或需求机制。
- Overfilled diagram: hundreds of weak ideas reduce actionability. Archive low-priority ideas and keep the active evidence plan focused.图表过满:数百个薄弱想法会降低可执行性。归档低优先级想法,让当前证据计划保持聚焦。
Limit: a fishbone diagram does not model AND/OR logic, feedback loops, probabilities, or event sequence well. Use a fault tree for logical combinations, a causal loop diagram for feedback, a timeline for sequence, or statistical and experimental methods for effect estimation.
局限:鱼骨图不擅长表达 AND/OR 逻辑、反馈回路、概率或事件顺序。逻辑组合使用故障树,反馈使用因果回路图,顺序使用时间线,效应估计则使用统计或实验方法。
Frequently asked questions about fishbone diagram examples鱼骨图示例常见问题
What is a fishbone RCA example?什么是鱼骨图 RCA 示例?
A fishbone RCA example is a filled cause-and-effect diagram for one effect, such as seal leakage found on Line B during the second shift. The head states the effect. The bones list candidate causes. The root cause is the branch later evidence supports, not the longest list.
鱼骨图 RCA 示例是围绕一个结果填好的因果图,例如 B 线二班在最终压力测试中发现的密封泄漏。鱼头写结果,鱼骨列候选原因。根因是后来有证据支持的那条分支,不是最长的那张清单。
What is a fishbone diagram example?什么是鱼骨图示例?
A fishbone diagram example is a completed cause-and-effect map built around a specific problem statement. It groups possible causes into useful categories, but its branches remain hypotheses until evidence supports or rejects them.
鱼骨图示例是围绕具体问题陈述填写完成的因果地图。它把可能原因归入有用类别,但在证据支持或否定之前,各分支仍然只是候选假设。
What are the 6M categories in a fishbone diagram?鱼骨图的 6M 类别是什么?
The classic manufacturing 6M categories are Manpower, Machine, Method, Material, Measurement, and Mother Nature or Environment. Rename them when another set better matches the process.
经典制造业 6M 类别是人员、机器、方法、材料、测量,以及自然环境。当其他组合更符合流程时,应对类别重命名。
How many causes should a fishbone diagram include?鱼骨图应包含多少个原因?
There is no correct number. Include enough specific, testable causes to cover credible pathways without turning the diagram into an inventory of vague concerns. Merge duplicates and move unsupported ideas into a parking list.
没有唯一正确数量。应包含足够具体、可检验的原因以覆盖可信路径,但不要把图变成模糊担忧清单。合并重复项,把缺乏支持的想法移入候选清单。
Does a fishbone diagram identify the root cause?鱼骨图能识别根因吗?
No. A fishbone diagram organizes candidate causes and supports structured brainstorming. The team still needs observations, logs, records, controlled comparisons, or other evidence to identify which causes contributed to the event.
不能。鱼骨图用于组织候选原因并支持结构化头脑风暴,团队仍需观察、日志、记录、受控比较或其他证据,才能识别哪些原因促成了事件。
When should I use 5 Whys instead of a fishbone diagram?什么时候应使用五问法而不是鱼骨图?
Use 5 Whys when evidence points to a relatively narrow causal chain. Use a fishbone diagram when several categories or perspectives may contribute. Teams often use fishbone first and apply 5 Whys to a supported branch.
当证据指向较窄的因果链时使用五问法;当多个类别或视角都可能有贡献时使用鱼骨图。团队通常先使用鱼骨图,再对有证据支持的分支应用五问法。
Official sources and verification notes官方来源与验证说明
- USDA Agricultural Marketing Service fishbone diagram instructions
- American Society for Quality fishbone resource
These sources support the definition, category guidance, and brainstorming workflow used here. The six examples, evidence matrix, and cautions are editorial teaching material rather than reported customer cases. Revalidate category names, evidence access, privacy controls, and approval requirements for the process and jurisdiction in which the diagram will be used.
这些来源支持本文采用的定义、类别指导与头脑风暴流程。六个案例、证据矩阵和注意事项均为编辑制作的教学材料,并非已报告的客户案例。实际使用时,应依据具体流程和管辖要求重新核对类别名称、证据访问、隐私控制与批准流程。