
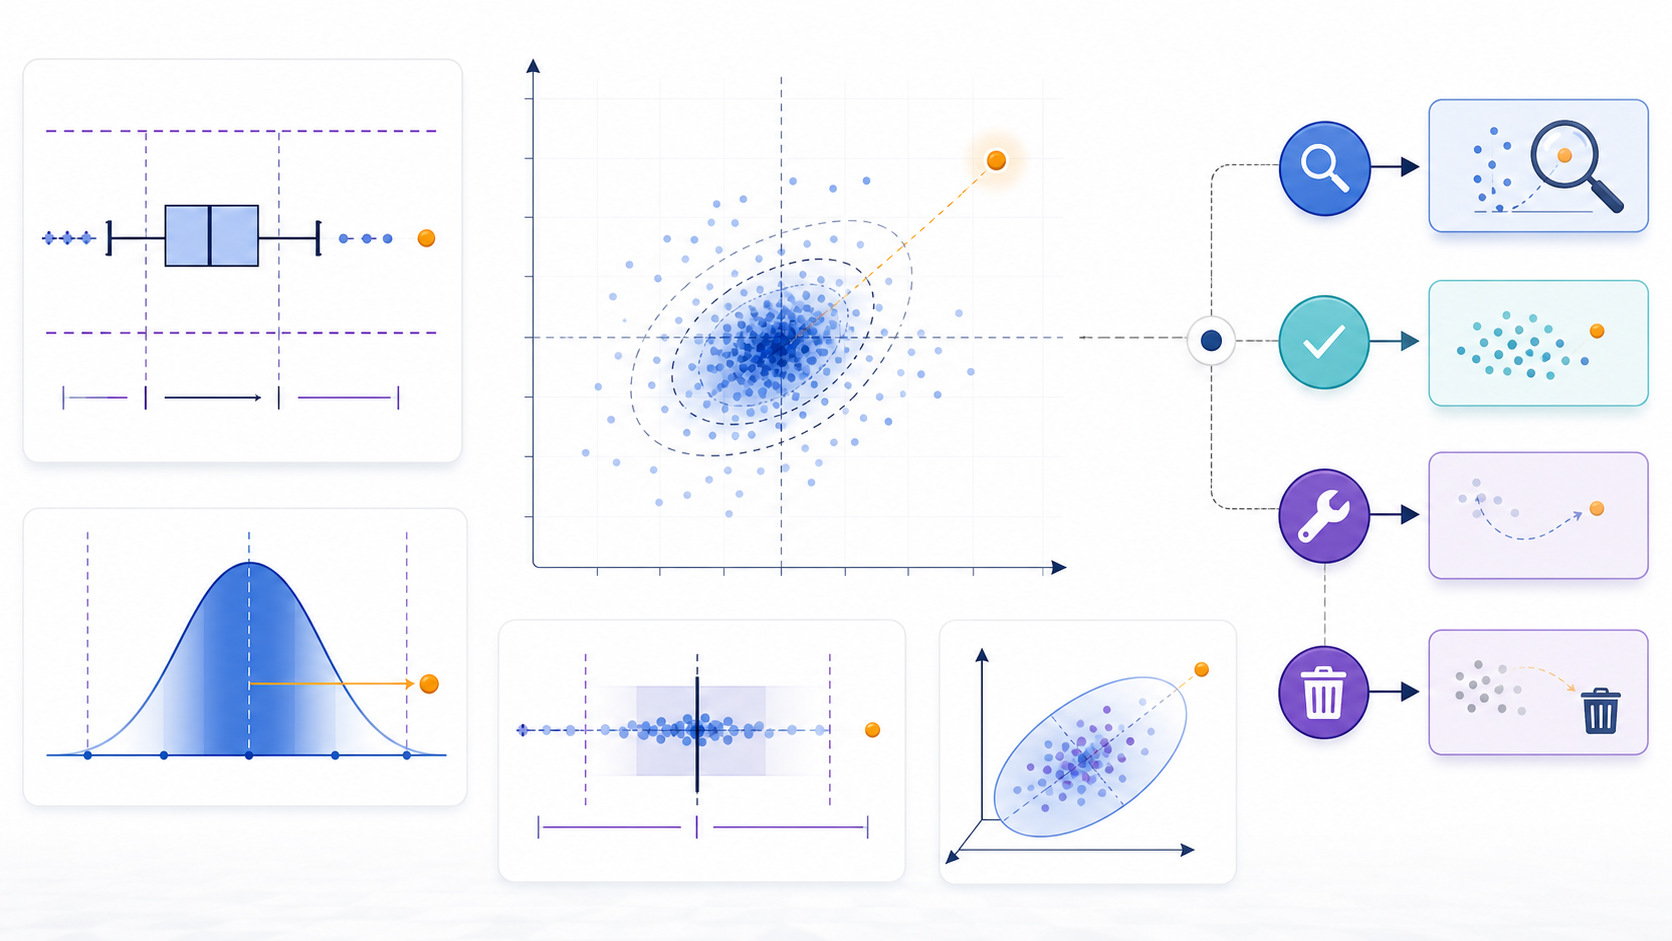
Outlier Definition and Detection: The Short Answer快速回答:异常值的定义与检测
An outlier is an observation that is unusually far from the pattern expected for comparable observations in a defined context. It can be a data error, a rare but valid event, a change in process, or evidence that the assumed model does not describe the data. Detection is therefore a screening step, not an automatic deletion rule. Begin with data provenance and visualization, choose a method whose assumptions match the distribution and question, flag candidates, investigate their causes, and document whether each value is retained, corrected, excluded, transformed, or analyzed separately.
异常值是在明确情境下,相对于可比较观测的预期模式显得异常遥远的数据点。它可能是数据错误、罕见但有效的事件、过程变化,也可能说明所假设模型无法描述数据。因此,检测只是筛选步骤,而不是自动删除规则。应从数据来源与可视化开始,选择与分布和问题假设一致的方法,标记候选点,调查原因,并记录每个值是保留、修正、排除、变换还是单独分析。
For one numerical variable, common introductory methods are a box plot with interquartile-range fences, a Z-score when mean and standard deviation are meaningful, and a median absolute deviation rule when robustness matters. Formal tests such as Grubbs, Dixon, or Tietjen–Moore address narrower hypotheses and require distributional and sample-design assumptions. Multivariate data need a joint measure such as a covariance-aware Mahalanobis distance or a local-density method; checking each column separately can miss unusual combinations.
对于一个数值变量,常见入门方法包括使用四分位距围栏的箱线图、在均值与标准差有意义时使用Z分数,以及在重视稳健性时使用中位数绝对偏差规则。Grubbs、Dixon或Tietjen–Moore等正式检验针对更窄的假设,并依赖分布与抽样设计前提。多变量数据需要使用考虑协方差的Mahalanobis距离或局部密度方法;逐列单独检查可能漏掉异常组合。
No threshold is universally correct. A three-standard-deviation rule, a 1.5×IQR fence, or a modified Z-score cutoff is a convention that creates candidates under particular conditions. The final decision must account for sample size, skewness, seasonality, subgroup, measurement precision, costs of false alarms and missed events, and the effect on downstream estimates. Always compare conclusions before and after treatment and preserve an auditable copy of the original data.
不存在普遍正确的阈值。三倍标准差规则、1.5×IQR围栏或修正Z分数阈值,都是在特定条件下生成候选点的惯例。最终判断还必须考虑样本量、偏度、季节性、分组、测量精度、误报与漏报成本,以及对下游估计的影响。处理前后应比较结论,并保留可审计的原始数据副本。
1. What Is an Outlier?1. 什么是异常值(Outlier)?
The practical outlier definition is relational: a value is unusual relative to a reference population, variable, time, location, or model. A body temperature of 39°C may be an outlier in a healthy screening population but expected in an infectious-disease ward. A large purchase may be ordinary for one corporate customer and suspicious for another. NIST describes an outlier as an observation lying an abnormal distance from other values in a random sample, while emphasizing that the analyst must first characterize what normal observations look like. Context establishes the comparison set and the meaning of abnormal distance.
异常值的实用定义是相对性的:某个值相对于参考总体、变量、时间、地点或模型表现异常。39°C体温在健康筛查人群中可能是异常值,在传染病病房中却可能常见;大额购买对某企业客户可能正常,对另一客户则可疑。NIST把异常值描述为在随机样本中与其他值距离异常远的观测,同时强调分析人员必须先描述正常观测的特征。情境决定比较集合,也决定“异常距离”的含义。
Outlier meaning should not be confused with error. A transcription mistake, unit mismatch, sensor fault, duplicate record, or impossible date is a quality defect when evidence confirms it. A valid extreme—an unusually high sale, a rare disease response, a record-breaking load, or an early failure—can contain the most valuable information in the study. A third possibility is model mismatch: a point appears extreme only because the data are skewed, multimodal, seasonal, heteroscedastic, or divided into subgroups that the current model ignores.
异常值的含义不能与错误混为一谈。当证据确认转录错误、单位不一致、传感器故障、重复记录或不可能日期时,它属于质量缺陷。有效极端值——异常高销售额、罕见疾病反应、创纪录负载或早期故障——可能包含研究中最有价值的信息。第三种情况是模型不匹配:数据本身具有偏态、多峰、季节性、异方差或未建模分组,因此某点只在当前模型下显得极端。
Outliers matter because many summaries and models are sensitive to them. The mean, standard deviation, correlation, least-squares slope, and covariance can shift substantially after one extreme observation, especially in a small sample. That influence is not proof the point is wrong; it is a reason to inspect it. Report robust summaries such as the median and IQR alongside conventional summaries, visualize the raw values, and perform sensitivity analysis. If a conclusion changes when one observation is removed, the result deserves explanation rather than silent editing.
异常值重要,是因为许多统计量与模型对它们敏感。特别在小样本中,一个极端观测就可能明显改变均值、标准差、相关系数、最小二乘斜率和协方差。这种影响并不能证明数据点错误,只说明它值得检查。应把中位数和IQR等稳健统计量与传统统计量一起报告,可视化原始值并进行敏感性分析。如果删除一个观测就改变结论,必须解释原因,而不能静默修改。
A disciplined definition record answers five questions: which observation is being compared; against which reference group or model; on which feature or combination of features; under which time and operating conditions; and by which distance, score, or test. It also separates detection from disposition. Detection produces a candidate and evidence. Disposition determines what to do after reviewing provenance, domain logic, downstream consequences, and uncertainty.
严谨的定义记录应回答五个问题:比较的是哪个观测;参考组或模型是什么;依据哪个变量或变量组合;处于什么时间与运行条件;使用何种距离、分数或检验。它还要区分“检测”和“处置”:检测产生候选点与证据,处置则在检查来源、领域逻辑、下游后果与不确定性后决定如何处理。
Planned child guides: outlier definition outlier meaning what is an outlier
2. Types of Outliers2. 异常值的类型
A univariate outlier is unusual on one measured variable. A transaction amount far above the rest or a laboratory value far below the observed range can be flagged without considering other columns. A multivariate outlier may look ordinary on every individual variable but unusual in combination. Height and weight can each fall within common ranges while their particular pairing is atypical. Univariate screening is easier to explain, but it cannot represent correlation, trade-offs, or joint constraints.
单变量异常值在一个测量变量上表现异常,例如交易金额远高于其他值,或实验室指标远低于观测范围,无需考虑其他列即可标记。多变量异常值可能在每个单独变量上都正常,但组合起来异常。例如身高与体重各自都在常见范围内,特定组合却不典型。单变量筛查更容易解释,却无法表示相关性、权衡或联合约束。
A global outlier differs from the overall dataset. A contextual outlier is unusual only in a specific context such as hour, season, machine state, patient group, or location. Electricity demand that is normal at midday may be exceptional at 3 a.m. A collective outlier is a group or sequence whose joint behavior is unusual even though no single member is extreme: a burst of modest transactions, a run of slowly rising temperatures, or a repeated pattern of small errors. The unit of detection can therefore be a point, a pair, a window, or an entire segment.
全局异常值相对于整体数据异常;上下文异常值只在特定时间、季节、机器状态、患者群体或地点中异常。中午正常的用电量,在凌晨3点可能异常。群体异常是一组或一段序列的联合行为异常,即使其中没有任何单点极端,例如一批金额不大的交易、持续缓慢上升的温度或反复出现的小错误。检测单位因此可能是点、变量对、时间窗口或完整片段。
Outliers can also be categorized by cause: measurement and entry errors; sampling or coverage problems; genuine rare events; structural change; and model misspecification. This classification guides treatment. Confirmed unit errors can be corrected from source evidence. Coverage problems may require reweighting or redesign, not row deletion. Genuine rare events should usually be retained and may deserve separate modeling. Structural changes require a new baseline. Model misspecification requires a better distribution, transformation, subgroup, or nonlinear method.
异常值还可按原因分类:测量与录入错误、抽样或覆盖问题、真实罕见事件、结构变化和模型设定错误。这种分类会指导处置。经来源证据确认的单位错误可被修正;覆盖问题可能需要重新加权或重新设计,而不是删行;真实罕见事件通常应保留,并可能需要单独建模;结构变化需要新基线;模型设定错误则需要更合适的分布、变换、分组或非线性方法。
| Type | What is unusual? | Example | Useful first check |
|---|---|---|---|
| Univariate | One value | One extreme delivery time | Histogram, box plot, Z-score, IQR, MAD |
| Multivariate | A feature combination | Ordinary height and weight with an unusual pairing | Scatter plot, robust covariance, Mahalanobis distance |
| Contextual | A value within context | Nighttime demand that is normal by day | Segmented plots and context-specific baseline |
| Collective | A group or sequence | A sustained run of small deviations | Run chart, windows, sequence or time-series methods |
| 类型 | 异常对象 | 示例 | 适合的初步检查 |
|---|---|---|---|
| 单变量 | 一个值 | 一次极端配送时长 | 直方图、箱线图、Z分数、IQR、MAD |
| 多变量 | 变量组合 | 身高体重单独正常但组合异常 | 散点图、稳健协方差、Mahalanobis距离 |
| 上下文 | 特定情境中的值 | 白天正常但夜间异常的需求 | 分组图与情境基线 |
| 群体 | 一组或序列 | 一段持续的小偏差 | 运行图、窗口、序列或时间序列方法 |
3. Why Detect Outliers?3. 为什么要检测异常值?
Data cleaning is the most familiar purpose. Invalid values can corrupt summaries, model fitting, dashboards, and decisions. Detection helps prioritize verification against source records, units, range rules, timestamps, duplicate keys, and device status. The objective is to diagnose quality problems, not to make every distribution look smooth. A data-cleaning rule should distinguish impossible values from merely rare ones and should preserve the raw field, corrected field, reason, evidence, author, and time of change.
数据清洗是最常见目的。无效值会破坏摘要、模型拟合、仪表板与决策。检测可帮助优先核对来源记录、单位、范围规则、时间戳、重复键和设备状态。目标是诊断质量问题,而不是让每个分布看起来平滑。清洗规则应区分不可能值与罕见值,并保留原始字段、修正字段、原因、证据、修改人和时间。
Fraud and abuse detection search for behavior that departs from an appropriate peer or history. A high amount alone may be weak evidence; amount, time, location, device, merchant, sequence, and account behavior together may be informative. Because genuine behavior changes, thresholds need monitoring and review. A flag is an investigative signal, not proof of misconduct. Evaluate both false positives that burden customers and false negatives that miss harmful events, and protect sensitive data and due process.
欺诈与滥用检测寻找偏离适当同类或历史的行为。单独的大额可能证据很弱,但金额、时间、地点、设备、商户、序列和账户行为组合可能有信息量。真实行为会变化,因此阈值需要监控和复核。标记只是调查信号,不是违规证明。评估既要考虑给客户造成负担的误报,也要考虑漏掉有害事件的漏报,并保护敏感数据与正当程序。
Fault warning uses unusual sensor, quality, or process behavior to trigger inspection before failure. Useful signals can be a single extreme reading, a drift, a variance change, or an unusual relationship among sensors. Physical limits and engineering knowledge often provide stronger controls than generic statistical thresholds. A statistically rare reading within calibration uncertainty may not justify shutdown; a modest deviation in a safety-critical combination may. Connect the score to an operational response, escalation path, and feedback about what inspectors found.
故障预警利用异常传感器、质量或过程行为,在失效前触发检查。有效信号可能是单个极端读数、漂移、方差变化或传感器之间异常关系。物理极限与工程知识往往比通用统计阈值提供更强控制。在校准不确定度内的统计罕见读数未必需要停机,而安全关键组合中的温和偏差可能需要。异常分数必须连接到运营响应、升级路径以及检查发现的反馈。
4. How to Identify Outliers: Visualization Methods4. 如何识别异常值:可视化方法
Start with plots before calculating a final flag. A histogram or density plot shows skewness, heavy tails, multiple modes, gaps, and bounded values that determine whether a symmetric cutoff makes sense. A dot plot or strip plot preserves individual observations in a small sample. A run chart places values in acquisition order and can reveal drift, clusters, and recording changes hidden by a sorted distribution. Always label units, subgroup, time window, missing-data handling, and transformations.
在计算最终标记前先画图。直方图或密度图会展示偏度、厚尾、多峰、间隙与有界值,从而判断对称阈值是否合理;点图或条带图在小样本中保留单个观测;运行图按采集顺序放置数值,可揭示排序分布掩盖的漂移、聚集与记录变化。图表必须标明单位、分组、时间窗口、缺失值处理和变换。
A box plot summarizes the median, lower quartile Q1, upper quartile Q3, and interquartile range IQR = Q3 − Q1. A common fenced box plot marks points below Q1 − 1.5×IQR or above Q3 + 1.5×IQR as potential outliers; outer fences use 3×IQR. The whisker usually reaches the most extreme observed point still inside the inner fence, not automatically the minimum and maximum. Points beyond a fence are candidates. Skewed data can naturally produce many flagged points, and quartile algorithms can differ across software, especially for small samples.
箱线图汇总中位数、下四分位数Q1、上四分位数Q3和四分位距IQR=Q3−Q1。常见围栏箱线图把低于Q1−1.5×IQR或高于Q3+1.5×IQR的点标为潜在异常;外围栏使用3×IQR。须线通常延伸到仍处于内围栏内的最极端观测,而不一定等于最小值与最大值。围栏外点只是候选。偏态数据可能自然产生很多标记,小样本中不同软件的四分位数算法也可能不同。
Scatter plots expose unusual relationships between two variables. Add color or facets for known groups and time to avoid comparing unlike observations. A point far from the cloud is a global candidate; a point inside the overall cloud may still be unusual within its subgroup. Plot residuals against fitted values when evaluating a regression because an observation can have an ordinary response but an unusual residual after accounting for predictors. Also inspect leverage: a point with an unusual predictor value can strongly influence a fitted line even when its residual is modest.
散点图可以揭示两个变量之间的异常关系。可用颜色或分面表示已知分组与时间,避免比较不可比观测。远离点云的点是全局候选;处于整体点云内部的点,在其子组中仍可能异常。评估回归时应绘制残差与拟合值,因为某观测的响应值可能普通,但考虑预测变量后残差异常。还要检查杠杆值:预测变量异常的点即使残差不大,也可能强烈影响拟合线。
A Z-score plot standardizes each value's distance from the mean by the standard deviation and can display reference lines such as ±2 or ±3. It is useful when the reference distribution is approximately symmetric and stable. It is misleading when the extreme values themselves inflate the mean and standard deviation, when the distribution is skewed or heavy-tailed, or when groups have different centers and scales. Pair it with the raw scale and a robust view such as a box plot or median-based score.
Z分数图用标准差把每个值与均值的距离标准化,可显示±2或±3等参考线。当参考分布近似对称且稳定时,它很有用;当极端值本身抬高均值与标准差、分布偏斜或厚尾,或各组中心与尺度不同时,它会误导。应同时展示原始尺度,并配合箱线图或基于中位数的稳健视图。
Planned child guides: how to find outliers how to identify outliers
5. Statistical Method 1: Z-Score Method5. 统计方法1:Z-Score方法
For a value x, the Z-score is z = (x − mean) / standard deviation. It expresses how many standard deviations the value lies above or below the reference mean. Decide whether the mean and standard deviation describe a population, a sample, or a clean historical baseline; software defaults differ in degrees of freedom. Missing values, infinite values, weights, repeated measurements, and grouped data also need explicit handling. Standardize within comparable groups rather than mixing populations with different centers and scales.
对于数值x,Z分数为z=(x−均值)/标准差,表示该值高于或低于参考均值多少个标准差。必须明确均值与标准差描述总体、样本还是干净历史基线,因为软件默认自由度可能不同;还应明确处理缺失值、无穷值、权重、重复测量和分组数据。不同中心与尺度的总体应在可比较组内标准化,而不能混合。
A common heuristic flags observations with |z| > 3. Under an ideal normal model, values beyond three standard deviations are rare, but the rule is not a universal law. Sample size matters: large datasets can contain legitimate extreme values simply because they contain more observations. Repeatedly scanning many columns also increases the chance of flags. Choose a threshold from the intended false-alarm cost, expected tail behavior, and validation evidence rather than adopting three by habit.
常见经验规则会标记|z| > 3的观测。在理想正态模型下,超过三个标准差的值很少,但该规则不是普遍定律。样本量很重要:大数据集仅因为观测更多,就可能自然包含有效极端值;反复扫描许多列也会提高标记概率。阈值应依据误报成本、预期尾部行为与验证证据选择,而不能习惯性固定为3。
The method is vulnerable to masking because the same outlier can pull the mean toward itself and inflate the standard deviation. Consider the nine values 10, 11, 12, 13, 14, 15, 16, 17, and 50. The extreme value raises both center and spread, so its sample Z-score is less than three even though the gap is visually obvious and an IQR fence flags it. Multiple extremes can mask one another even more. Iteratively deleting points and recomputing Z-scores creates selection bias unless a validated procedure specifically supports it.
该方法容易发生掩蔽,因为异常值会把均值拉向自己并抬高标准差。以10、11、12、13、14、15、16、17和50为例,极端值同时提高中心与离散度,因此样本Z分数小于3,尽管视觉间隙明显且IQR围栏会标记它。多个极端值更可能相互掩蔽。除非经过验证的程序明确支持,否则反复删除点并重算Z分数会造成选择偏差。
Use Z-scores when the distribution is approximately normal or at least symmetric and light-tailed, the baseline is stable, observations are comparable, and mean and standard deviation are meaningful. Prefer a transformation, model residual, group-specific baseline, IQR, or MAD when those conditions fail. Report the formula, center, scale, degrees of freedom, threshold, sidedness, and number of comparisons so another analyst can reproduce the flag.
当分布近似正态,或至少对称且轻尾;基线稳定;观测可比较;均值与标准差有意义时,可使用Z分数。条件不成立时,优先考虑变换、模型残差、分组基线、IQR或MAD。报告中应写明公式、中心、尺度、自由度、阈值、单侧或双侧,以及比较次数,使其他分析人员能够复现标记。
6. Statistical Method 2: IQR Method (Interquartile Range)6. 统计方法2:IQR方法(四分位距)
The interquartile-range method uses ranks rather than the mean and standard deviation. Sort the values, compute the lower quartile Q1 and upper quartile Q3, then calculate IQR = Q3 − Q1. The common inner fences are Q1 − 1.5×IQR and Q3 + 1.5×IQR. Outer fences use 3×IQR. Values outside a fence are potential mild or extreme outliers in the box-plot convention; they are not automatically invalid observations.
四分位距方法使用排序位置,而不是均值与标准差。先排序,计算下四分位数Q1和上四分位数Q3,再计算IQR=Q3−Q1。常见内围栏是Q1−1.5×IQR和Q3+1.5×IQR,外围栏使用3×IQR。箱线图惯例把围栏外值视为潜在温和或极端异常值,并不自动认定其无效。
Using Tukey's median-of-halves convention on 10, 11, 12, 13, 14, 15, 16, 17, 50 gives Q1 = 11.5, Q3 = 16.5, and IQR = 5. The upper inner fence is 24, so 50 is flagged. This example also shows why the exact quartile convention must be recorded: percentile algorithms interpolate differently, especially for small samples, and can move a borderline fence. Use the same documented convention in exploration, production, and audit.
对10、11、12、13、14、15、16、17、50采用Tukey半样本中位数规则,可得Q1=11.5、Q3=16.5、IQR=5,上内围栏为24,因此50被标记。该例也说明必须记录四分位数算法:不同百分位算法的插值方式不同,特别在小样本中会移动边界。探索、生产和审计必须使用同一套有文档记录的规则。
IQR is resistant because a small number of extreme values has limited influence on Q1 and Q3. It works without a normality assumption and is useful for skewed or heavy-tailed data as an exploratory rule. Yet the standard 1.5 multiplier can flag many legitimate values in a strongly skewed distribution, and it can be unstable with very small samples or discrete variables with many ties. Consider transformation, one-sided fences, subgroup-specific baselines, or methods designed for skewness when domain evidence supports them.
IQR具有稳健性,因为少量极端值对Q1和Q3影响有限。它不要求正态分布,适合把偏态或厚尾数据作为探索性规则。不过,在强偏态分布中,标准1.5倍数可能标记许多合法值;在极小样本或大量并列值的离散变量中也可能不稳定。领域证据支持时,可考虑变换、单侧围栏、分组基线或专门处理偏度的方法。
Use IQR when you need a transparent, distribution-light screening rule and the median and quartiles meaningfully describe the data. Plot the result, show both inner and outer fences if risk differs by severity, and count candidates by group. Do not compare raw IQRs across variables with different units. For multivariate relationships, IQR remains a marginal check and must be complemented by a joint method.
当需要透明、较少依赖分布的筛查规则,且中位数与四分位数能有效描述数据时,可使用IQR。应绘制结果;如果风险按严重程度不同,可同时展示内外围栏;并按组统计候选点。不同单位变量的原始IQR不能直接比较。对于多变量关系,IQR仍只是边际检查,需要联合方法补充。
7. Statistical Method 3: MAD Method (Median Absolute Deviation)7. 统计方法3:MAD方法(中位数绝对偏差)
The median absolute deviation is MAD = median(|xᵢ − median(x)|). It measures typical absolute distance from the median. Because both the center and the scale use medians, a minority of extreme observations has far less influence than it has on the mean and standard deviation. SciPy describes MAD as a dispersion measure similar to standard deviation but more robust to outliers. This makes it useful for skewed, contaminated, or heavy-tailed data when a median-centered baseline is sensible.
中位数绝对偏差定义为MAD=median(|xᵢ−median(x)|),衡量观测到中位数的典型绝对距离。由于中心与尺度都使用中位数,少量极端观测的影响远小于其对均值与标准差的影响。SciPy把MAD描述为类似标准差但对异常值更稳健的离散度量。因此,当中位数中心合理时,它适合偏态、受污染或厚尾数据。
A common modified Z-score is Mᵢ = 0.6745(xᵢ − median) / MAD; 0.6745 makes the scale comparable to standard deviation under a normal model. A frequently cited screening cutoff is an absolute modified score above about 3.5, but it remains a convention. Some software instead returns a normal-consistent MAD by dividing the raw MAD by approximately 0.67449. Mixing a scaled MAD with a formula that already includes 0.6745 double-scales the score, so record the software definition.
常见修正Z分数为Mᵢ=0.6745(xᵢ−中位数)/MAD;0.6745使正态模型下的尺度与标准差可比。绝对修正分数约大于3.5常被用作筛查阈值,但仍是惯例。有些软件会把原始MAD除以约0.67449,直接返回正态一致尺度;如果再在公式中乘0.6745,就会重复缩放,因此必须记录软件定义。
MAD can equal zero when at least half the observations equal the median, which is common for counts, rounded measurements, or sparse features. Division then fails even though some different values may be important. Do not add an arbitrary epsilon without explaining its effect. Consider exact frequency rules, an alternative robust scale such as IQR, a domain tolerance, or a model designed for zero-inflated or discrete data. Small samples also produce coarse scores and should be interpreted with the raw values visible.
当至少一半观测等于中位数时,MAD可能为零,这在计数、舍入测量或稀疏特征中很常见。此时即使某些不同值很重要,除法也会失败。不能在不解释影响的情况下随意加一个极小数;可考虑精确频率规则、IQR等其他稳健尺度、领域容差,或为零膨胀与离散数据设计的模型。小样本分数也较粗糙,应结合原始值解释。
Use MAD when robustness matters and you want an interpretable one-variable score. Compare it with the IQR and raw distribution; disagreement is informative about tail shape or scale. As with every method, calculate within the correct reference group, validate on known cases, choose one- or two-sided thresholds from the question, and preserve the candidate's value, median, MAD, score, threshold, and processing version.
当需要稳健、可解释的单变量分数时,可使用MAD。将其与IQR和原始分布比较;方法间不一致本身会揭示尾部形状或尺度信息。与所有方法一样,应在正确参考组内计算,使用已知案例验证,依据问题选择单侧或双侧阈值,并保留候选值、中位数、MAD、分数、阈值与处理版本。
8. Statistical Hypothesis Testing Methods8. 统计假设检验方法
A formal outlier test evaluates a defined null hypothesis under explicit assumptions. It does not prove a value is erroneous, and a non-significant result does not prove the dataset is clean. Select the test before looking repeatedly for the most favorable result, specify whether the suspected outlier is in one or both tails, and inspect distributional assumptions with graphics. Testing after choosing a point because it looks extreme can invalidate a naive p-value interpretation.
正式异常值检验会在明确假设下评估定义好的零假设。它不能证明某值错误,不显著也不能证明数据完全干净。应在反复寻找最有利结果前选择检验,明确怀疑值位于单尾还是双尾,并通过图形检查分布假设。先看数据、再因为某点显得极端而选择检验,会破坏对朴素p值的解释。
Grubbs' test targets one minimum or maximum outlier in an approximately normal univariate sample. Its statistic is the largest absolute deviation from the sample mean divided by the sample standard deviation, and the critical value accounts for sample size and significance level. Because the candidate contributes to the mean and standard deviation, multiple outliers can mask one another. NIST recommends a multiple-outlier procedure rather than applying a single-outlier test sequentially when several outliers are suspected.
Grubbs检验针对近似正态单变量样本中的一个最小或最大异常值。统计量是距离样本均值最大的绝对偏差除以样本标准差,临界值考虑样本量与显著性水平。由于候选点参与均值与标准差计算,多个异常值可能相互掩蔽。当怀疑存在多个异常值时,NIST建议使用多异常值程序,而不是顺序反复应用单异常值检验。
Dixon's Q-type test also targets a single extreme value and is mainly used for small normal samples. It compares the gap between an end observation and its neighbor with an appropriate sample range; the exact formula depends on sample size and variant. NIST Dataplot limits its implementation to samples from 3 to 30 and warns about sensitivity to the number of suspected outliers. Use a published implementation and critical values, not an improvised ratio from a secondary example.
Dixon Q类检验同样针对一个极端值,主要用于小型正态样本。它把端点观测与相邻值的间隙,同适当样本范围比较;确切公式取决于样本量与变体。NIST Dataplot将其实现限制在3至30个样本,并警告它对怀疑异常值数量敏感。应使用已发表的实现与临界值,而不是从二手示例中临时拼接比率。
Tietjen–Moore generalizes the normal-sample approach to exactly k suspected outliers. The analyst must specify k in advance; if only an upper bound is known, another multiple-outlier test such as the generalized extreme studentized deviate procedure may be more appropriate. Choosing too few suspected points can cause masking; choosing too many can cause swamping, in which regular observations are incorrectly grouped with a true outlier. Graphical review and domain evidence remain essential.
Tietjen–Moore把正态样本方法推广到恰好k个怀疑异常值。分析人员必须预先指定k;如果只知道上限,广义极端学生化偏差等其他多异常值检验可能更合适。指定过少会造成掩蔽,指定过多会造成淹没,即正常观测被错误地与真实异常点一起标记。图形审查与领域证据仍然不可缺少。
| Test | Target | Key assumptions or limits | Decision caution |
|---|---|---|---|
| Grubbs | One minimum, maximum, or two-sided extreme | Approximately normal univariate sample | Multiple outliers can mask one another |
| Dixon | One end observation in a small sample | Normality; formula and limits depend on variant | Use validated tables or software |
| Tietjen–Moore | Exactly k extremes | Approximately normal data; k specified in advance | Wrong k can cause masking or swamping |
| 检验 | 目标 | 关键假设或限制 | 决策注意 |
|---|---|---|---|
| Grubbs | 一个最小值、最大值或双侧极端 | 近似正态单变量样本 | 多个异常值可相互掩蔽 |
| Dixon | 小样本中的一个端点 | 正态性;公式与限制依变体 | 使用经过验证的表或软件 |
| Tietjen–Moore | 恰好k个极端值 | 近似正态;预先指定k | 错误k会造成掩蔽或淹没 |
Planned child guides: outlier test
规划中的子文章: 异常值检验
9. How to Use an Outlier Calculator9. 如何使用异常值计算器
An outlier calculator automates arithmetic, not judgment. Before entering data, confirm that values use one unit, represent comparable observations, and are not aggregated at incompatible levels. Decide whether missing values are omitted, whether duplicates are legitimate, and whether groups should be calculated separately. Preserve identifiers outside the numeric input so flagged values can be traced back to records. Never paste confidential or regulated data into an unapproved public tool.
异常值计算器自动完成算术,而不是替代判断。输入前要确认数值使用同一单位、代表可比较观测,且没有在不兼容层级聚合;决定是否忽略缺失值、重复项是否合法、各组是否应分开计算。数值输入之外应保留标识符,使标记值能追溯到记录。绝不能把机密或受监管数据粘贴到未经批准的公共工具。
Select the method and options deliberately: IQR multiplier and quartile convention; Z-score center, scale, degrees of freedom, and threshold; or MAD scaling and modified-score cutoff. Choose one-sided detection when only high or low values are meaningful, and two-sided detection when both tails matter. A trustworthy calculator shows the formula, sorted data, intermediate statistics, thresholds, flagged values, and handling of ties and missing values. If it returns only a label, reproduce the calculation independently before acting.
应有意识选择方法与选项:IQR倍数和四分位数规则;Z分数中心、尺度、自由度与阈值;或MAD缩放和修正分数阈值。只有高值或低值重要时选择单侧检测,两端都重要时选择双侧。可信计算器会显示公式、排序数据、中间统计量、阈值、标记值,以及并列与缺失值处理。若工具只返回标签,行动前应独立复算。
Interpret output as a candidate report. For the example 10 through 17 plus 50, an IQR calculator using Tukey hinges should report Q1 11.5, Q3 16.5, IQR 5, and an upper inner fence of 24. The value 50 is therefore outside the fence. Record the calculator version and settings because another percentile convention may differ on borderline datasets. Check the box plot and source record, then decide whether 50 is an entry error, a valid event, or evidence of another group.
把输出解释为候选报告。对于10至17加50的示例,使用Tukey铰链的IQR计算器应给出Q1为11.5、Q3为16.5、IQR为5、上内围栏为24,因此50在围栏外。记录计算器版本与设置,因为其他百分位规则在临界数据上可能不同。随后检查箱线图与来源记录,判断50是录入错误、有效事件还是另一组的证据。
Validate any calculator with a small hand-checkable dataset and edge cases: constant values, MAD zero, duplicated quartiles, one missing value, negative numbers, decimal precision, and an obvious high and low extreme. Confirm whether the tool changes input order or rounds before comparison. For recurring work, move the validated calculation into version-controlled code or an approved analytics workflow with tests, rather than relying on manual copy and paste.
使用可手算的小数据集和边界案例验证计算器:常数值、MAD为零、四分位数重复、一个缺失值、负数、小数精度,以及明显高低极端。确认工具是否改变输入顺序或在比较前舍入。对于重复工作,应把经过验证的计算迁入有版本控制的代码或获准分析流程并编写测试,而不是长期手工复制粘贴。
Planned child guides: outlier calculator
规划中的子文章: 异常值计算器
10. Introduction to Multivariate Outlier Detection10. 多变量异常值检测简介
Multivariate detection asks whether a vector of measurements is unusual relative to their joint distribution. Euclidean distance is inadequate when variables have different units or are correlated. Mahalanobis distance adjusts a point's displacement from the center by the covariance structure: movement along a naturally variable correlated direction counts less than movement across a tight direction. Under a well-specified multivariate normal model, squared distance can be compared with a chi-square reference, but estimated center and covariance—especially in small, high-dimensional, or contaminated samples—complicate that interpretation.
多变量检测询问一个测量向量相对于联合分布是否异常。变量单位不同或彼此相关时,欧氏距离并不充分。Mahalanobis距离使用协方差结构调整点到中心的偏移:沿天然高变异相关方向的移动权重较小,跨越紧密方向的移动权重较大。在正确设定的多元正态模型下,距离平方可与卡方参考比较,但在小样本、高维或受污染样本中,中心与协方差估计会使解释复杂。
Classical covariance can itself be distorted by outliers, making them look less distant. Robust covariance estimates reduce that masking when assumptions and sample size support them. Standardize and encode variables deliberately, remove redundant features, and avoid inverting a singular covariance matrix without a principled remedy. Visualize two-dimensional projections, but remember that projection can hide or invent separation. Report which features drive the distance and inspect the raw record.
经典协方差本身会被异常值扭曲,从而让异常点显得距离较近。在假设与样本量支持时,稳健协方差估计可减少这种掩蔽。应谨慎标准化与编码变量,移除冗余特征,不能在没有合理方案时强行求奇异协方差矩阵的逆。可以可视化二维投影,但要记住投影既可能隐藏也可能制造分离。报告哪些特征推动距离,并检查原始记录。
Local Outlier Factor takes a different view: it compares a point's local density with the densities of its neighbors. A point can be a local outlier inside a dataset whose regions have different densities, even if it is not globally remote. Results depend on neighborhood size, distance metric, scaling, dimensionality, and expected contamination. LOF is introduced here as a bridge to advanced machine-learning methods; it deserves a separate guide because fitting existing data and scoring unseen data use different modes and interpretations.
Use the outlier detection page to choose an assumption set, then see the local outlier factor for neighborhood-based detection, parameter choices, and validation.
局部离群因子(LOF)采用不同视角:它把某点的局部密度与邻居密度比较。即使数据各区域密度不同,某点不在全局远处,也可能是局部异常。结果依赖邻居数量、距离度量、缩放、维度和预期污染率。本文把LOF作为进入高级机器学习方法的桥梁;它需要单独指南,因为拟合现有数据与评分未见数据使用不同模式与解释。
Move beyond introductory statistics when the data are high-dimensional, nonlinear, time-dependent, mixed-type, very large, or defined by local neighborhoods and sequences. Advanced methods can rank complex anomalies, but they still need an explicit reference population, leakage controls, representative evaluation, threshold policy, explanations, and a response workflow. More complex does not automatically mean more accurate or safer. Establish simple baselines first so additional value can be measured.
当数据具有高维、非线性、时间依赖、混合类型、大规模,或由局部邻域与序列定义时,应超越入门统计方法。高级方法可以排序复杂异常,但仍需要明确参考总体、防泄漏控制、代表性评估、阈值政策、解释与响应流程。更复杂并不自动意味着更准确或更安全。应先建立简单基线,才能衡量复杂方法的增量价值。
Continue from statistical foundations into the complete machine-learning anomaly detection and root cause analysis guide, covering time-series methods, Isolation Forest, autoencoders, LOF, change points, diagnostic frameworks, and automated RCA.
从统计基础继续进入完整的机器学习异常检测与根因分析指南,了解时间序列方法、隔离森林、自编码器、LOF、变点、诊断框架与自动化RCA。
11. Treating Outliers: Delete vs Retain vs Correct11. 处理异常值:删除 vs 保留 vs 修正
First investigate provenance. Retrieve the source record, unit, timestamp, instrument or form, transformation history, and related variables. Check impossible-range rules, calibration, duplicates, decimal shifts, timezone errors, and joins. If evidence confirms a correctable error, correct it from the authoritative source and preserve the original value, correction, reason, reviewer, and date. If the true value cannot be recovered, mark it missing or exclude it only under a documented rule; do not replace it with a value chosen to make the analysis convenient.
首先调查来源。获取源记录、单位、时间戳、仪器或表单、转换历史和相关变量,检查不可能范围、校准、重复、十进制错位、时区错误与连接问题。如果证据确认存在可修正错误,应从权威来源修正,并保留原值、修正值、原因、复核者与日期。如果真实值无法恢复,只能依据有文档记录的规则标为缺失或排除,不能为了让分析方便而选择替代值。
Retain valid extremes when they belong to the target population and reflect real variation. Use robust estimators, transformations, appropriate distributions, quantile methods, stratification, or models that permit heavy tails when an extreme would otherwise dominate. Consider reporting results with and without influential points as a sensitivity analysis. A separate model may be appropriate when investigation shows a distinct subgroup or operating regime. Do not hide that decision: describe how the subgroup was identified and whether it was known before examining the outcome.
当有效极端值属于目标总体并反映真实变化时,应予保留。若极端点会主导结果,可使用稳健估计、变换、合适分布、分位数方法、分层或允许厚尾的模型。可同时报告包含与不包含影响点的结果,作为敏感性分析。调查显示存在不同子组或运行状态时,可建立单独模型,但不能隐藏该决策:要说明子组如何识别,以及是否在查看结果前已知。
Deletion is justified when the observation is outside the study population, violates a prespecified eligibility rule, is a confirmed unrecoverable error, or arises from a failed process that the analysis explicitly excludes. Record counts and reasons by group, because selective deletion can bias representation and uncertainty. Never delete solely because a p-value, correlation, or model metric improves. If a decision depends on one point, communicate that fragility.
当观测不属于研究总体、违反预先规定的资格规则、属于确认且无法恢复的错误,或来自分析明确排除的失败过程时,删除才可能合理。按组记录数量与原因,因为选择性删除会造成代表性与不确定性偏差。不能仅因为删除后p值、相关系数或模型指标改善就删除;如果结论依赖一个点,必须说明这种脆弱性。
Imputation and winsorization change the data and answer a different question. Interpolation may be reasonable for a short sensor gap when continuity assumptions are validated, but it is not a correction for a genuine spike. Winsorizing caps extremes and can stabilize a summary, yet it removes tail information and changes variance. Treat these as modeled values with flags, method, parameters, and uncertainty. Keep raw, cleaned, and analysis-ready layers separate so every result can be reproduced.
插补与缩尾会改变数据,并回答不同问题。短暂传感器缺口在连续性假设经验证后可以插值,但真实尖峰不能被当成缺口修正。缩尾限制极端值,可能稳定摘要,却会删除尾部信息并改变方差。应把这些值视为带标记、方法、参数与不确定性的建模值。原始层、清洗层和分析就绪层要分离,确保每个结果可复现。
| Disposition | Use when | Required evidence |
|---|---|---|
| Correct | A recoverable source or unit error is confirmed | Authoritative value and audit trail |
| Exclude | Prespecified scope violation or unrecoverable confirmed error | Rule, reason, counts, and sensitivity |
| Retain | A valid extreme belongs to the target process | Context and robust or sensitivity analysis |
| Transform/model | Tail behavior is real but conventional assumptions fail | Model rationale, diagnostics, and interpretation |
| Analyze separately | A defensible subgroup or regime exists | Independent definition and adequate sample support |
| 处置 | 适用情况 | 所需证据 |
|---|---|---|
| 修正 | 确认存在可恢复的来源或单位错误 | 权威值与审计记录 |
| 排除 | 违反预设范围或确认错误且无法恢复 | 规则、原因、数量与敏感性分析 |
| 保留 | 有效极端值属于目标过程 | 上下文与稳健或敏感性分析 |
| 变换/建模 | 尾部真实但传统假设失效 | 模型理由、诊断与解释 |
| 单独分析 | 存在可辩护的子组或状态 | 独立定义与足够样本支持 |
12. Domain-Specific Outlier Detection12. 领域特定的异常值检测
In finance, unusual transactions can indicate fraud, account takeover, operational errors, or legitimate customer behavior. Compare a transaction with an appropriate account history and peer group, not only a global amount distribution. Include time, channel, merchant, device, geography, velocity, and sequence where permitted. Use flags to prioritize review and protect customers from unnecessary blocking. Monitor precision, recall, investigation yield, customer friction, losses, and subgroup performance because the cost of a false positive is not uniform.
在金融领域,异常交易可能表示欺诈、账户接管、运营错误或合法客户行为。交易应与适当账户历史和同类组比较,而不能只看全局金额分布;在允许情况下加入时间、渠道、商户、设备、地理、速度与序列。标记用于安排复核优先级,并避免不必要地阻止客户。需要监控精确率、召回率、调查命中率、客户摩擦、损失和分组表现,因为误报成本并不一致。
In manufacturing, an outlier can be a sensor fault, measurement-system problem, special-cause variation, material change, tool wear, or an early product defect. Segment by product, recipe, machine, batch, shift, and operating state. Combine statistical screening with specification limits and process knowledge: a point within specification can still signal process change, while a statistical outlier can remain functionally acceptable. Preserve time order and investigate surrounding measurements, maintenance, calibration, and environmental conditions.
在制造领域,异常值可能来自传感器故障、测量系统问题、特殊原因变异、材料变化、工具磨损或早期产品缺陷。应按产品、配方、机器、批次、班次与运行状态分段。把统计筛查与规格限、过程知识结合:规格内的点仍可能表示过程变化,统计异常点也可能功能合格。保留时间顺序,并调查邻近测量、维护、校准与环境条件。
In healthcare, an unusual patient measurement can be a life-critical event, a unit or device error, an expected response for a subgroup, or an artifact of timing. Reference ranges are not interchangeable with individualized baselines. Age, sex, condition, medication, procedure, device, and measurement context can matter. Statistical flags must support qualified clinical review and must not be presented as diagnosis. Protect privacy, validate across populations and sites, monitor missed events and alert fatigue, and retain the source measurement and clinical context.
在医疗领域,异常患者测量可能是危及生命的事件、单位或设备错误、某子组的预期反应,或测量时点伪影。参考范围不能替代个体基线;年龄、性别、病情、药物、操作、设备与测量情境都可能重要。统计标记必须辅助合格临床复核,不能被当作诊断。要保护隐私,跨人群与站点验证,监控漏报与告警疲劳,并保留源测量和临床上下文。
13. Common Misconceptions13. 常见误区
Mistake 1: deleting every flagged point. A statistical rule identifies unusualness under a reference, not invalidity. Investigate source and context first. Keep a disposition code and compare analysis before and after any exclusion. Automatic deletion can erase fraud, failures, rare populations, scientific discoveries, and the exact tail risk the study is meant to estimate.
误区一:删除所有被标记点。统计规则只在参考框架下识别异常性,并不等于无效。先调查来源与上下文,保留处置代码,并比较排除前后的分析。自动删除可能抹去欺诈、故障、罕见人群、科学发现,以及研究本来要估计的尾部风险。
Mistake 2: assuming all methods require normality—or that none do. IQR and MAD do not require a normal model as screening statistics, although their chosen multipliers still imply conventions. Z-score interpretation is most defensible with an appropriate center, scale, and tail model. Grubbs, Dixon, and Tietjen–Moore rely on approximate normality. Match the assumption to the method, inspect the distribution, and document deviations.
误区二:认为所有方法都要求正态,或都不要求。IQR和MAD作为筛查统计量不要求正态模型,但所选倍数仍是惯例。Z分数需要合适中心、尺度和尾部分布才更有解释力;Grubbs、Dixon与Tietjen–Moore依赖近似正态。应让假设与方法匹配,检查分布并记录偏离。
Mistake 3: treating anomaly as error. Error is a causal conclusion supported by provenance; anomaly is a relationship to a model or peer set. Use separate fields for detector flag, reviewer finding, root-cause category, and final disposition. This separation lets teams measure detector quality and discover when the model, not the observation, is wrong.
误区三:把异常等同于错误。错误是由来源证据支持的因果结论,异常只是与模型或同类集合的关系。应分别记录检测标记、复核发现、根因类别与最终处置,使团队能够衡量检测器质量,并发现何时错误的是模型而不是观测。
Mistake 4: ignoring time and groups. A single global threshold can punish high-volume groups, miss low-volume failures, and mistake seasonality for abnormality. Establish comparable cohorts and baselines without using outcome information that would not be available at detection time. Recalculate only under a versioned change policy so shifting reference windows do not make the same observation change status without explanation.
误区四:忽略时间和分组。一个全局阈值可能过度标记高量组、漏掉低量故障,并把季节性误认为异常。应建立可比较群组与基线,且不得使用检测时不可获得的结果信息。只有依据版本化变更政策才能重算,避免参考窗口变化让同一观测无解释地改变状态。
Mistake 5: evaluating only flagged examples. Review a representative sample of unflagged data to estimate misses. Track precision, recall where labels exist, alert volume, stability, calibration, review burden, and business consequence. For unsupervised exploration, use synthetic or known challenge cases cautiously and conduct expert review. A low flag rate is not proof of quality, and a high discovery rate on a hand-picked set does not establish production performance.
误区五:只评估被标记案例。还应抽查代表性未标记数据以估计漏报。有标签时追踪精确率、召回率、告警量、稳定性、校准、复核负担与业务后果;无监督探索可谨慎使用合成或已知挑战案例,并进行专家复核。低标记率不等于质量高,在精挑样本上高命中也不能证明生产表现。
14. Summary and Next Steps14. 总结与下一步
An outlier is an observation unusually distant from an appropriate reference pattern. Its meaning depends on population, variable, time, context, and method. Start by defining that reference, checking provenance, plotting the data, and identifying whether the problem is univariate, multivariate, contextual, or collective. Use Z-scores for appropriate mean-and-standard-deviation baselines, IQR for transparent rank-based screening, MAD for robust median-centered scoring, and formal tests only for the hypotheses and assumptions they support.
异常值是相对于适当参考模式显得异常遥远的观测,其含义取决于总体、变量、时间、情境与方法。首先定义参考,检查来源并绘图,再判断问题属于单变量、多变量、上下文还是群体异常。均值与标准差基线合适时使用Z分数;需要透明排序筛查时使用IQR;需要稳健中位数中心评分时使用MAD;正式检验只能用于其支持的假设与前提。
Treat every flag as a candidate for investigation. Confirm errors from authoritative evidence; retain valid extremes; use robust or subgroup models when the distribution demands them; and document exclusions, corrections, transformations, and sensitivity results. An auditable workflow preserves original data, calculation settings, thresholds, scores, evidence, reviewer decisions, and downstream effects. This protects both statistical validity and the rare signals that may matter most.
把每个标记视为调查候选。根据权威证据确认错误;保留有效极端值;分布需要时使用稳健或分组模型;记录排除、修正、变换与敏感性结果。可审计流程应保留原始数据、计算设置、阈值、分数、证据、复核决定与下游影响,从而同时保护统计有效性和可能最重要的罕见信号。
Continue into the nine focused child guides for the outlier definition, meaning, introductory questions, practical identification, calculators, tests, method comparison, and Local Outlier Factor. These URLs remain staged until each article is deployed. For high-dimensional, nonlinear, time-series, or large-scale problems—and for the next question of why an anomaly occurred—the planned advanced guide will cover machine-learning detection and root cause analysis.
下一步可进入9篇聚焦子文章,分别讲解异常值定义、含义、入门问题、实际识别、计算器、检验、方法对比与局部离群因子。这些URL在各文章部署前保持规划状态。对于高维、非线性、时间序列或大规模问题,以及“异常为何发生”的下一层问题,规划中的高级指南将讲解机器学习异常检测与根因分析。
InfiniSynapse supports direct database connections and authorized analysis across multiple sources without requiring a complex migration first. After a team has defined and validated its outlier scores, flags, and review outcomes in connected databases, that verified multi-source capability can help analyze them alongside relevant operational records. This page does not claim that InfiniSynapse replaces statistical design, an outlier calculator, formal testing software, or advanced anomaly-detection models; those methods must be selected and validated for the intended data and decision.
InfiniSynapse支持直接连接数据库,并让获得授权的团队在无需先进行复杂迁移的情况下开展多源联合分析。当团队已在连接数据库中定义并验证异常分数、标记和复核结果后,可使用这项经过验证的多源能力,把它们与相关业务记录联合分析。本文不声称InfiniSynapse替代统计设计、异常值计算器、正式检验软件或高级异常检测模型;这些方法必须针对目标数据与决策单独选择和验证。
Ready to compare governed outlier results across connected databases? Explore InfiniSynapse's verified direct-connection and authorized multi-source analysis workflow.
准备好跨已连接数据库比较受治理的异常结果了吗?了解InfiniSynapse经过验证的直接连接与授权多源联合分析流程。
Frequently Asked Questions常见问题
It is an observation unusually far from the expected pattern for comparable observations in a defined population, context, or model. It is not automatically an error.
它是在明确总体、情境或模型中,相对于可比较观测的预期模式显得异常遥远的数据点,并不自动等于错误。
Start with provenance and plots, then apply a transparent rule such as IQR, Z-score, or MAD whose assumptions fit the distribution and reference group.
先检查来源并绘图,再使用IQR、Z分数或MAD等透明规则,确保其假设适合分布与参考组。
Compute IQR as Q3 minus Q1. Values below Q1 − 1.5×IQR or above Q3 + 1.5×IQR are box-plot candidates for investigation.
IQR等于Q3减Q1;低于Q1−1.5×IQR或高于Q3+1.5×IQR的值,是箱线图需要调查的候选点。
No. Three is a common heuristic whose usefulness depends on distribution, baseline stability, sample size, grouping, tail behavior, and decision cost.
不一定。3只是常见经验阈值,其有效性取决于分布、基线稳定性、样本量、分组、尾部行为与决策成本。
Use it for robust one-variable screening when median-centered scale is meaningful and extremes would distort the mean and standard deviation.
当中位数中心尺度有意义,且极端值会扭曲均值与标准差时,可用MAD进行稳健单变量筛查。
Only under a documented rule supported by evidence, such as a confirmed unrecoverable error or scope violation. Retain valid extremes and analyze sensitivity.
只有在有证据支持的文档化规则下,例如确认且无法恢复的错误或范围违规,才应删除;有效极端值应保留并进行敏感性分析。
The terms overlap, but outlier often describes statistical distance in observed data, while anomaly can include contextual, sequential, multivariate, or model-based departures.
两者有重叠,但异常值通常描述观测数据中的统计距离,异常则还可包含上下文、序列、多变量或模型偏离。
Sources and Evidence Notes资料来源与证据说明
Primary references for definition, box plots, and formal tests are the NIST outlier overview, NIST box-plot guidance, NIST Grubbs test, NIST Dixon test, and NIST Tietjen–Moore test. These sources emphasize assumptions, graphical review, and careful treatment rather than automatic deletion.
定义、箱线图与正式检验的一手资料包括NIST异常值概览、NIST箱线图指南、NIST Grubbs检验、NIST Dixon检验与NIST Tietjen–Moore检验。这些资料强调假设、图形检查与谨慎处置,而不是自动删除。
Implementation references include SciPy's Z-score documentation, SciPy's MAD documentation, and scikit-learn's outlier and novelty detection guide. Library defaults and versions change, so verify current documentation and record parameters in any reproducible analysis.
实现资料包括SciPy Z分数文档、SciPy MAD文档与scikit-learn异常值与新颖性检测指南。库默认值与版本会变化,任何可复现分析都应核对当前文档并记录参数。