 InfiniSynapse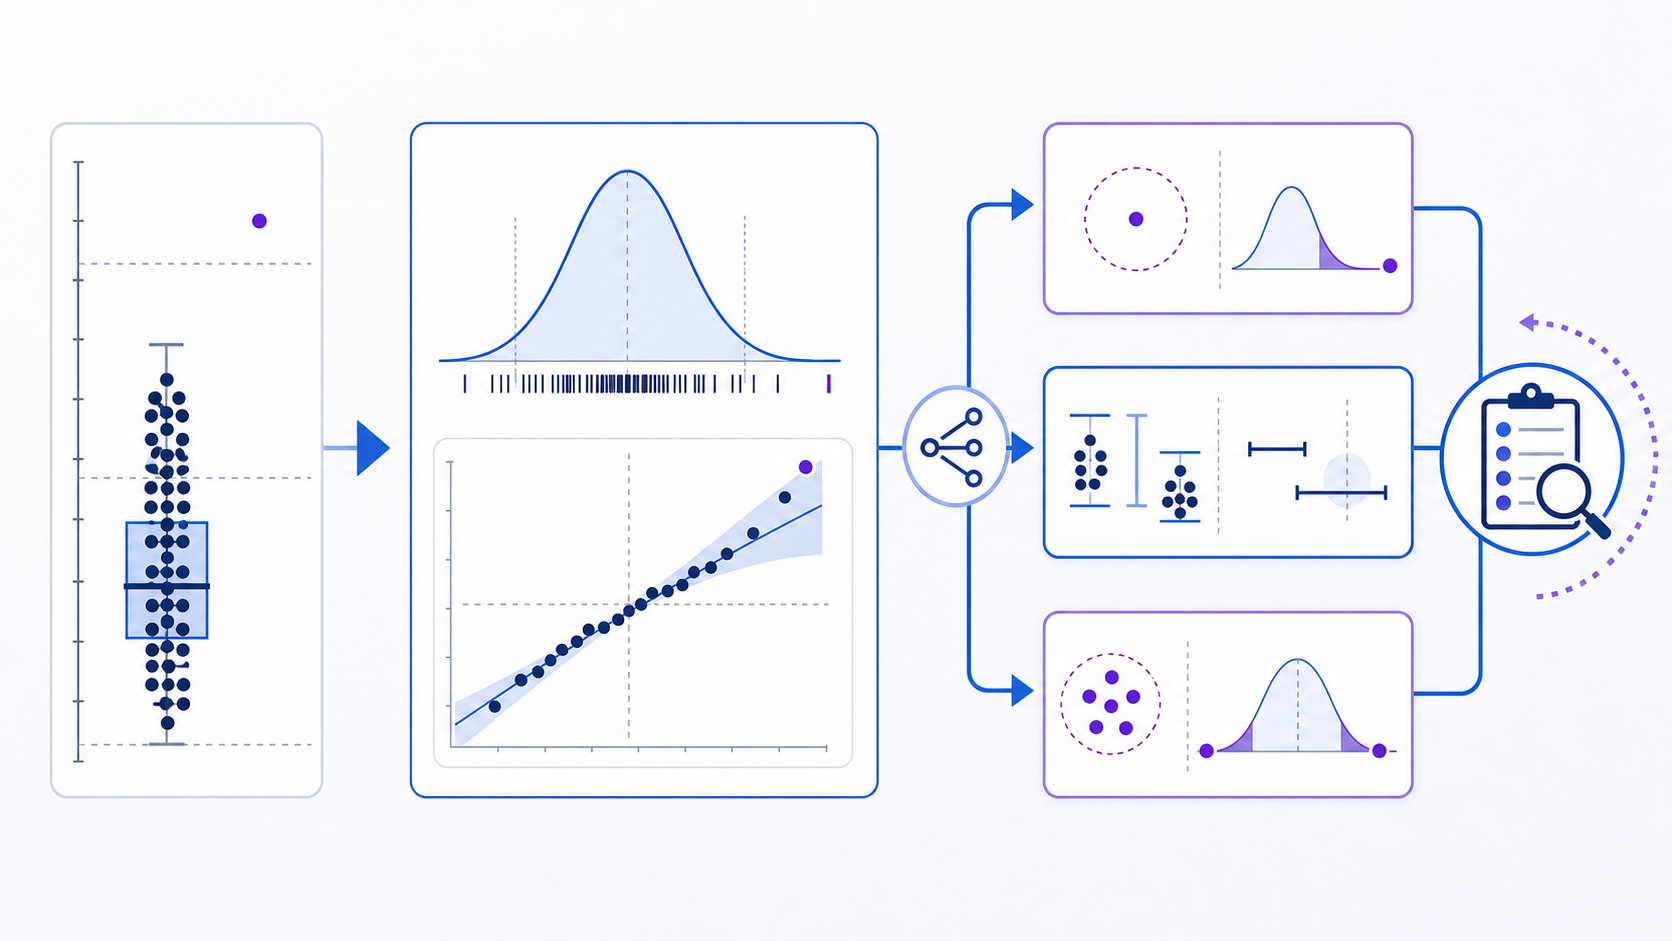
On this page本页目录
What is an outlier test?什么是异常值检验?
This focused article is part of the complete statistical outlier guide; use the pillar guide to compare related concepts, methods, and implementation decisions across the full topic.
本文是完整的统计异常值指南内容集群中的专题文章;如需比较完整主题下的相关概念、方法与实施决策,请返回基石指南。
An outlier test is a formal statistical procedure that asks whether one or more extreme observations are sufficiently incompatible with a stated model to be flagged for investigation. For one suspected value in approximately normal univariate data, Grubbs' test is a common choice. Dixon's Q is used in some small-sample settings, while generalized ESD (often associated with Rosner's procedure) is designed for several suspected extremes. A significant result is evidence against the model's no-outlier hypothesis; it is not proof that a measurement is wrong or permission to delete it.
异常值检验是一类正式统计程序,用于判断一个或多个极端观测是否与既定数据模型充分不相容,从而应被标记并进一步调查。对于近似正态的单变量数据且只怀疑一个值时,Grubbs 检验是常见选择;Dixon Q 常用于某些小样本场景;广义 ESD(常与 Rosner 程序相关)则面向多个可疑极端值。显著结果只说明“无异常值”假设与数据不相容,并不证明测量错误,更不等于可以删除该值。
When should you use an outlier test?什么时候应该使用异常值检验?
Use a formal test when the analysis plan defines a plausible population model, an observation at an extreme deserves a controlled statistical check, and the result will be interpreted alongside provenance and domain evidence. Typical examples include repeated laboratory measurements under stable conditions, quality-control measurements from one process, or a small homogeneous batch where one reading may reflect a transcription or instrument problem.
当分析计划能够给出合理的总体模型、某个极端观测确实需要受控的统计核查,并且结果会与数据来源和领域证据共同解释时,才适合使用正式检验。典型场景包括稳定条件下的重复实验测量、同一过程的质量控制数据,或同质小批次中可能存在录入或仪器问题的一个读数。
One numerical variable, independent observations, a defensible reference distribution, a pre-specified tail and significance level, and a documented suspected-outlier count.
单个数值变量、观测近似独立、参考分布有依据,并预先指定检验方向、显著性水平和可疑异常值数量。
Time series with trend or seasonality, clustered records, mixed populations, skewed or heavy-tailed data, multivariate anomalies, censored values, or a post-hoc search for a value to remove.
具有趋势或季节性的时间序列、聚类记录、混合总体、偏态或重尾数据、多变量异常、删失数据,或事后寻找“可删除值”的分析。
If the structure is a poor fit, use a model that represents it: residual diagnostics for regression, time-series anomaly methods for serial dependence, robust multivariate distance for correlated features, or robust descriptive rules such as IQR or MAD when a formal parametric test is unjustified.
若数据结构不匹配,应改用能够表达该结构的方法:回归问题检查残差,序列相关数据使用时间序列异常方法,相关多变量数据使用稳健多变量距离;无法证明参数检验合理时,可采用 IQR 或 MAD 等稳健描述性规则。
Prepare the data and assumptions before testing检验前准备数据并明确假设
- Preserve the raw data and provenance.保留原始数据与来源。Keep stable row IDs, units, timestamps, instrument or source identifiers, collection conditions, missing-value codes, and every transformation. Never overwrite the raw value.保留稳定行 ID、单位、时间戳、仪器或来源标识、采集条件、缺失值编码及全部转换记录,绝不覆盖原始值。
- Define the reference population.定义参考总体。Confirm that observations belong together. A separated point may expose two populations, a process shift, or an unmodeled group rather than an isolated bad record.确认这些观测确实属于同一总体。分离点可能揭示两个总体、过程变化或未建模群组,而不是孤立错误记录。
- Choose the suspected count and direction in advance.预先选择可疑数量与检验方向。State whether one low value, one high value, either tail, or several extremes are plausible. Do not choose a one-sided test after seeing which side looks unusual.说明怀疑一个低值、一个高值、任一端还是多个极端值;不要看完数据方向后才选择单侧检验。
- Inspect distribution and dependence.检查分布与依赖结构。Use a histogram, box plot, run chart, and normal Q-Q plot. These checks cannot prove normality, but they can expose skew, mixtures, drift, clusters, and serial dependence that invalidate a simple test.结合直方图、箱线图、运行图和正态 Q-Q 图。图形不能证明正态性,但能暴露偏态、混合分布、漂移、聚类与序列依赖,从而发现简单检验不适用的情况。
- Set alpha and the decision rule.设定 α 与决策规则。Record the significance level before calculation, along with what a flag triggers: investigation, repeat measurement, sensitivity analysis, or a documented exclusion review.计算前记录显著性水平,并说明标记结果会触发调查、复测、敏感性分析还是有记录的排除审查。
- Confirm Dixon Q / NIST assumptions before that test.跑 Dixon Q 前先核 NIST 式假设。 For Dixon's Q specifically: normal reference population, independent observations, a pre-specified suspected count, and the correct critical-value table. If any item fails, skip Dixon Q. See NIST Detection of Outliers. Dixon Q 需要正态参考总体、独立观测、预先指定的可疑点数,以及正确的临界值表。任一项不成立就不要跑。见 NIST 异常值检测。
Choose Grubbs, Dixon, or generalized ESD选择 Grubbs、Dixon 或广义 ESD
| Method方法 | Best-aligned question匹配问题 | Core assumptions核心假设 | Main limitation主要局限 |
|---|---|---|---|
| Grubbs | Is the most extreme minimum or maximum the single outlier?最极端最小值或最大值是否是唯一异常值? | Approximately normal, univariate, independent sample without the candidate除候选值外近似正态、单变量且独立 | A second extreme can mask the first; repeated use changes error control第二个极端值可能造成掩蔽;重复使用改变错误率控制 |
| Dixon Q | Is an extreme endpoint separated by an unusually large gap in a small ordered sample?小型有序样本的端点是否由异常大的间隔分离? | Small sample, normal reference population, correct Q variant and critical table小样本、正态参考总体、正确 Q 变体与临界值表 | Variants depend on sample size and suspected pattern; multiple points can mask变体取决于样本量与可疑模式;多个点可能掩蔽 |
| Generalized ESD / Rosner广义 ESD / Rosner | Are there up to a pre-specified maximum number of outliers?是否存在不超过预设最大数量的多个异常值? | Approximately normal univariate observations and a justified upper bound近似正态的单变量观测及有依据的异常值数量上限 | The chosen maximum affects the procedure; still model-dependent最大数量选择会影响程序,且仍依赖模型 |
| Tietjen-MooreTietjen-Moore | Are exactly k extremes collectively inconsistent?恰好 k 个极端值是否整体不相容? | Approximately normal data and k known in advance数据近似正态且预先知道 k | Requires specifying the exact number, often unrealistic必须指定准确数量,现实中往往难以做到 |
Do not treat these names as interchangeable. A Grubbs test for one candidate does not answer the same question as a generalized ESD test for up to several candidates. If you cannot justify approximate normality, independence, and a homogeneous reference population, the best decision may be not to run any of them.
这些名称不能互换。针对一个候选值的 Grubbs 检验,与针对“不超过若干候选值”的广义 ESD 回答的是不同问题。如果无法证明近似正态、独立性和同质参考总体,最佳决策可能是不用这些检验。
How to run a Grubbs outlier test如何执行 Grubbs 异常值检验
For a two-sided test, the null hypothesis says there are no outliers and the alternative says there is exactly one. Compute the sample mean and sample standard deviation from all n observations, then standardize the largest absolute deviation:
双侧检验的原假设是“数据中没有异常值”,备择假设是“恰好有一个异常值”。先用全部 n 个观测计算样本均值与样本标准差,再把最大绝对偏差标准化:
Compare G with the critical value based on n, alpha, and the two-sided t-distribution adjustment. Reject the null only when G exceeds that value. A one-sided version tests the minimum or maximum specifically and uses a different alpha adjustment. Use a verified implementation or critical-value source rather than copying a table whose tail, alpha, or sample-size convention is unclear.
把 G 与由 n、α 及双侧 t 分布修正确定的临界值比较;仅当 G 超过临界值时拒绝原假设。单侧版本专门检验最小值或最大值,并使用不同的 α 修正。应使用经过验证的软件实现或临界值来源,不要复制尾部方向、α 或样本量约定不清的表格。
Interpret the p-value carefully. It represents how incompatible the most extreme standardized deviation is with the assumed no-outlier normal model. It does not estimate the probability that the observation is an error, nor the probability that deleting it improves the analysis.
谨慎解释 p 值。它衡量最极端标准化偏差与“正态且无异常值”模型的不相容程度;它不是“该观测为错误的概率”,也不是“删除后分析会改善的概率”。
Worked example: test one suspected high value计算示例:检验一个可疑高值
Consider the hypothetical repeated measurements 10.1, 10.2, 10.0, 10.3, 10.2, 10.1, 11.8. The maximum looks separated, but appearance is only a screening signal. Suppose the measurement protocol supports independent repetitions from one approximately normal process and the plan specifies a two-sided Grubbs test at alpha 0.05.
考虑一组假设重复测量:10.1、10.2、10.0、10.3、10.2、10.1、11.8。最大值看起来分离,但外观只是筛查信号。假设测量方案支持“来自同一近似正态过程的独立重复”,且计划预先指定在 α=0.05 下进行双侧 Grubbs 检验。
- The sample mean is approximately 10.386 and the sample standard deviation is approximately 0.630.样本均值约为 10.386,样本标准差约为 0.630。
- For 11.8, G ≈ |11.8 − 10.386| / 0.630 ≈ 2.245.对于 11.8,G ≈ |11.8 − 10.386| / 0.630 ≈ 2.245。
- The final decision requires the correct critical value for n=7, a two-sided alpha of 0.05, and the chosen implementation. Record both G and that source.最终决策需要 n=7、双侧 α=0.05 对应的正确临界值及选定实现;应同时记录 G 与临界值来源。
Even if significant, the next question is operational: was 11.8 a decimal-point error, a calibration event, a real process excursion, or a different population? Preserve it while investigating. Then compare conclusions with the point retained and under any justified correction or exclusion. This sensitivity analysis is more informative than presenting only the cleaned result.
即使结果显著,下一步仍是业务调查:11.8 是小数点错误、校准事件、真实过程偏移,还是来自不同总体?调查期间应保留它,并比较“保留该点”与“有依据地修正或排除”后的结论。这样的敏感性分析比只呈现清洗结果更有信息量。
From a statistical flag to a defensible decision从统计标记走向可辩护决策
| Evidence证据 | Likely action可能行动 | Required record必须记录 |
|---|---|---|
| Verified transcription or unit error已证实的录入或单位错误 | Correct from the source; retain the original in an audit trail按来源修正,并在审计轨迹中保留原值 | Source, correction rule, approver, timestamp来源、修正规则、批准者、时间 |
| Documented instrument or protocol failure有记录的仪器或方案失败 | Exclude only under a pre-existing rule; consider remeasurement仅按既有规则排除,并考虑复测 | Failure evidence, exclusion rule, test result失败证据、排除规则、检验结果 |
| Valid rare event有效稀有事件 | Retain, segment, model robustly, or report separately保留、分群、稳健建模或单独报告 | Domain interpretation and influence analysis领域解释与影响分析 |
| Cause unresolved原因未确定 | Keep the value and report sensitivity with and without it保留该值,并报告包含与不包含时的敏感性 | Assumptions, uncertainty, both result sets假设、不确定性与两组结果 |
A non-significant test also needs care. Low power, masking by multiple extremes, model misspecification, or a very small sample can prevent a flag. “Not significant” is not evidence that the observation is ordinary or correct. Review influence on estimates, residuals, intervals, and downstream decisions.
不显著结果同样需要谨慎。低检验效能、多个极端值造成的掩蔽、模型错设或样本太小,都可能导致未被标记。“不显著”不能证明该观测普通或正确;还应检查其对估计量、残差、区间和下游决策的影响。
Common outlier-test mistakes and failure modes异常值检验的常见错误与失败模式
Removing one point and rerunning a single-outlier test without a multiplicity plan can inflate false positives and alter the reference distribution.
没有多重性计划就删除一个点并重复单异常值检验,会提高假阳性并改变参考分布。
A legitimate right tail can resemble contamination. Consider a justified transformation, a distribution-specific model, or a robust method.
真实右尾可能看起来像污染;应考虑有依据的转换、特定分布模型或稳健方法。
A value can be ordinary within its site, instrument, cohort, or season but extreme after inappropriate pooling.
某值在所属站点、仪器、队列或季节内可能普通,却因不当合并而显得极端。
A statistical test does not identify the mechanism. Provenance, process knowledge, and repeat measurements supply causal evidence.
统计检验不会识别形成机制;来源、过程知识与复测才提供因果证据。
Other warning signs include selecting alpha after seeing the p-value, applying a test to residuals without accounting for fitted-model leverage, treating missing or censored values as ordinary numbers, and reporting only the favorable cleaned analysis. Pre-specification and complete reporting reduce these risks.
其他风险包括看到 p 值后才选择 α、对残差检验却忽略拟合模型的杠杆效应、把缺失或删失值当作普通数字,以及只报告有利的清洗后分析。预先规定方法并完整报告可降低这些风险。
How to validate an outlier-test result如何验证异常值检验结果
- Recalculate independently: verify n, mean, standard deviation, tail, alpha, statistic, critical value, and p-value with a second trusted implementation.独立复算:用第二个可信实现核对 n、均值、标准差、尾部方向、α、统计量、临界值和 p 值。
- Inspect graphics: compare the raw-value plot, Q-Q plot, histogram, box plot, and run order. Look for mixtures, drift, and multiple candidates.检查图形:比较原始值图、Q-Q 图、直方图、箱线图与运行顺序,寻找混合总体、漂移与多个候选值。
- Trace the record: inspect the source file, units, parsing, collection event, instrument status, and transformations.追溯记录:检查源文件、单位、解析、采集事件、仪器状态与转换过程。
- Run sensitivity analysis: compare estimates, uncertainty, model fit, and decisions with the point retained, corrected, and—only if justified—excluded.执行敏感性分析:比较保留、修正,以及仅在有依据时排除该点后的估计、不确定性、模型拟合与决策。
- Make the result reproducible: store the method version, parameters, code or commands, data snapshot, candidate IDs, plots, and final rationale.确保可复现:保存方法版本、参数、代码或命令、数据快照、候选 ID、图形与最终理由。
Connect the outlier flag to the evidence around it把异常值标记与周边证据连接起来
Before opening InfiniSynapse, prepare a reviewed data table with stable IDs, the outlier-test output, units and timestamps, relevant process or business fields, source documentation, and access rules. InfiniSynapse is presented as an AI-powered data analysis workspace for structured databases and documents; this page does not claim that it contains a dedicated Grubbs, Dixon, or ESD calculator. Use it after the statistical calculation to examine flagged records alongside connected context, and verify every conclusion before operational use.
打开 InfiniSynapse 前,请准备带稳定 ID 的已复核数据表、异常值检验输出、单位与时间戳、相关过程或业务字段、来源文档及访问规则。InfiniSynapse 的真实定位是面向结构化数据库与文档的 AI 辅助数据分析工作区;本页不会声称它内置专用 Grubbs、Dixon 或 ESD 计算器。完成统计计算后,可用它把被标记记录与关联语境一起分析,并在业务使用前验证所有结论。
Open InfiniSynapse for connected data analysis打开 InfiniSynapse 进行关联数据分析Outlier test FAQ异常值检验常见问题
Which outlier test should I use?应该使用哪种异常值检验?
Use Grubbs for one suspected extreme in approximately normal univariate data. Consider Dixon for a small sample when its exact variant and critical values fit the design, and generalized ESD or Rosner when several extremes may be present. Use robust or model-based methods when normality or independence is implausible.
近似正态的单变量数据且只怀疑一个极端值时使用 Grubbs;小样本且 Dixon 的具体变体与临界值适合设计时可考虑 Dixon;可能有多个极端值时使用广义 ESD 或 Rosner。正态性或独立性不可信时,改用稳健或模型化方法。
Does a significant outlier test justify deleting the value?异常值检验显著就能删除该值吗?
No. A test measures incompatibility with a statistical model; it does not prove error. Investigate provenance, measurement conditions, protocol, and domain meaning, then report analyses with and without any consequential exclusion.
不能。检验只衡量数据与统计模型的不相容程度,不会证明错误。应调查来源、测量条件、方案和领域含义,并报告任何有实质影响的排除前后分析。
Can I run Grubbs test on non-normal data?非正态数据可以运行 Grubbs 检验吗?
Grubbs test assumes the data without the suspected outlier are approximately normal. For skewed, heavy-tailed, mixed, time-dependent, or multivariate data, use a method matched to that structure or justify a transformation before testing.
Grubbs 假设除可疑值外的数据近似正态。偏态、重尾、混合、时间依赖或多变量数据应使用与结构匹配的方法,或在检验前证明转换合理。
What is the difference between an outlier test and the IQR rule?异常值检验与 IQR 规则有什么不同?
An outlier test states a null hypothesis and controls a significance level under model assumptions. The IQR rule is a robust descriptive flag based on quartiles. Both identify observations for investigation, not automatic deletion.
异常值检验在模型假设下提出原假设并控制显著性水平;IQR 规则是基于四分位数的稳健描述性标记。两者都用于发现待调查观测,而不是自动删除。
Should I test repeatedly after removing each outlier?每删除一个异常值后都应重复检验吗?
Repeated single-outlier testing can change the error rate and may suffer masking or swamping. If multiple outliers are plausible, choose a multiple-outlier procedure such as generalized ESD and predefine the maximum number considered.
重复单异常值检验会改变错误率,并可能出现掩蔽或淹没。若多个异常值具有可能性,应选择广义 ESD 等多异常值程序,并预先定义考虑的最大数量。
Does Dixon's Q test assume normality and independent observations?Dixon Q 检验是否假设正态且观测独立?
Yes. Dixon's Q assumes a normal reference population, independent observations, a small sample, and the correct Q variant and critical table. If normality or independence fails, do not run Dixon Q; use a method matched to the data structure. See NIST Detection of Outliers.
是。Dixon Q 要求正态参考总体、独立观测、小样本,以及正确的 Q 变体与临界值表。正态或独立性不成立时不要跑 Dixon Q,改用匹配数据结构的方法。见 NIST 异常值检测。
Official and primary technical sources官方与第一方技术来源
- NIST/SEMATECH: Grubbs' Test for OutliersNIST/SEMATECH:Grubbs 异常值检验
- NIST/SEMATECH: Detection of OutliersNIST/SEMATECH:异常值检测
- U.S. EPA ProUCL 5.0 User Guide: Dixon and Rosner outlier procedures美国 EPA ProUCL 5.0 用户指南:Dixon 与 Rosner 异常值程序
For product context, review the InfiniSynapse tools directory and InfiniSynapse documentation. These links describe the broader analysis environment, not a dedicated outlier-test implementation.
如需了解产品语境,请查看 InfiniSynapse 工具目录和 InfiniSynapse 文档。这些链接描述更广泛的分析环境,并不代表专用异常值检验实现。