 InfiniSynapse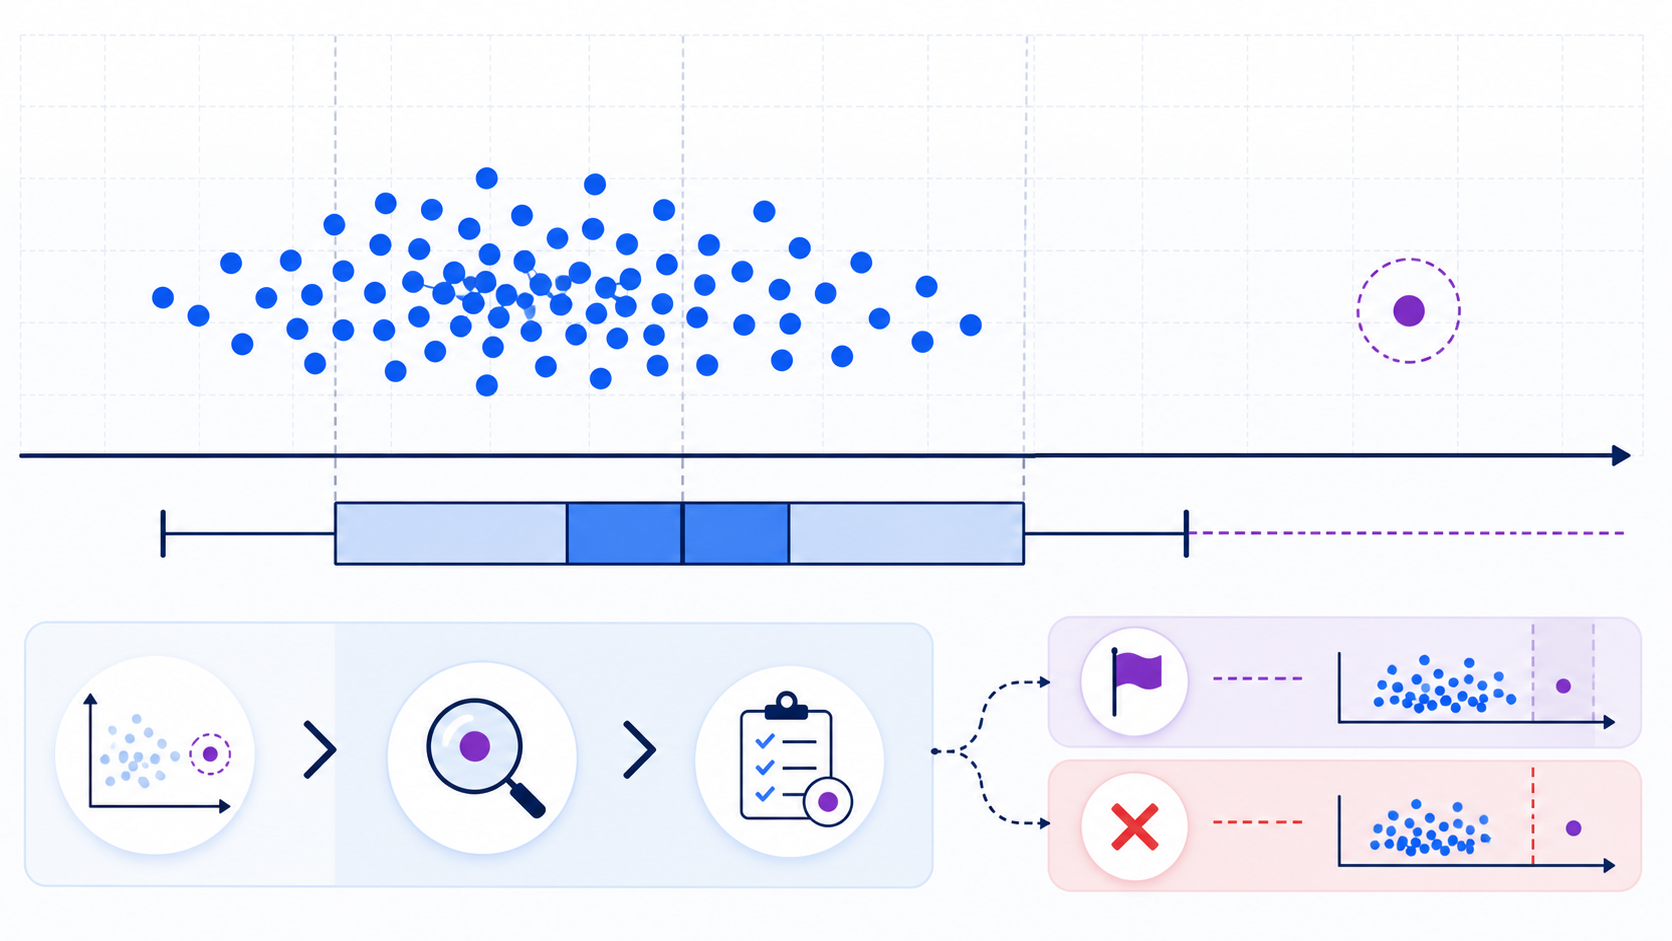
On this page本页目录
Outlier definition in one sentence一句话里的异常值定义
In statistics, the outlier definition is an observation that lies an abnormal distance from other values in a stated comparison group. It is a flag to investigate, not a verdict that the row is wrong. The comparison group, the variable, and the rule (a z-score, a 1.5×IQR fence, or a domain threshold) are part of the definition.
在统计里,异常值定义是:相对已写明的比较组,与其他数值距离异常远的观测。它是待调查的标记,不是该行数据错误的判决。比较组、变量和规则(Z 分数、1.5×IQR 围栏或领域阈值)都是定义的一部分。
This focused article is part of the complete statistical outlier guide; use the pillar guide to compare related concepts, methods, and implementation decisions across the full topic.
本文是完整的统计异常值指南内容集群中的专题文章;如需比较完整主题下的相关概念、方法与实施决策,请返回基石指南。
The phrase “under a stated model or context” matters. A temperature of 30°C may be ordinary for a summer afternoon and exceptional inside a refrigerated warehouse. A high salary may be extreme across an entire company but normal within its executive subgroup. An outlier therefore depends on the reference population, variables, time window, measurement process, and analytical goal.
“在明确模型或语境下”至关重要。30°C 对夏日下午可能普通,对冷藏仓库却异常;一份高薪在全公司范围内可能极端,在高管群体中却正常。因此,异常判断取决于参考总体、变量、时间窗口、测量过程与分析目标。
Related expressions—outlier meaning, what is an outlier, extreme value, anomalous observation, and unusual data point—often describe the same introductory intent. “Anomaly” is broader and can include unusual sequences, relationships, or collective behavior even when no single number is extreme. “Influential point” is also different: it is an observation whose inclusion materially changes a fitted model. A point can be influential without being far away, and an outlier can have little influence.
“outlier meaning”“what is an outlier”、极端值、异常观测和不寻常数据点通常对应同一入门意图。“异常(anomaly)”范围更广,可涵盖异常序列、变量关系或群体行为,即使单个数值并不极端。“高影响点”也不同:它是指加入后会显著改变拟合模型的观测。高影响点未必距离很远,异常值也可能对模型影响很小。
Before labeling a value, prepare the raw observation, its unit, timestamp, source record, relevant group labels, and the decision the analysis will support. Also keep enough neighboring or historical data to define “typical.” A single maximum is not automatically an outlier, and a value can be an outlier without being the largest or smallest number: in multivariate data, an ordinary-looking value may form an unusual combination with other variables. This practical outlier definition is why method selection comes after context and data-quality checks, not before them.
在标记某个数值前,应准备原始观测、单位、时间戳、来源记录、相关分组标签,以及分析将支持的具体决策;同时保留足够的相邻或历史数据来定义“典型”。最大值并不自动成为异常值,异常值也不一定是最大或最小数:在多变量数据中,一个单看普通的数值可能与其他变量形成不寻常组合。正因为异常值具有这种实用定义,方法选择应发生在语境确认和数据质量检查之后,而不是之前。
Outlier definition in statistics, not the dictionary sense统计里的异常值定义,不是词典义
English dictionaries use outlier for a person, thing, or fact so different from the rest that it should not support a general conclusion, and also for someone whose home sits far from a settlement. This page uses only the statistical sense: a data point judged against a stated comparison group. Everyday wording is covered in outlier meaning.
英语词典里的 outlier 既指与其余人、事、事实差别大、不宜用来下一般结论的对象,也指住处远离聚居地的人。本页只使用统计义:相对已写明比较组来判断的数据点。日常用语见异常值含义。
Why the outlier definition is not one formula为什么异常值定义不是唯一公式
A useful outlier definition must name the reference against which a value is unusual. That reference may be a distribution, a peer group, a time window, a regression model, or a business rule. Without it, “far away” is only an impression. The same observation can be ordinary in one population and outlying in another: a transaction of $5,000 may be routine for enterprise accounts but exceptional for a consumer cohort.
一个可执行的异常值定义,必须说明该数值相对于什么参照而显得异常。参照可以是一个分布、同类群体、时间窗口、回归模型或业务规则。若缺少参照,“离得很远”只是一种印象。同一观测在一个总体中可能正常,在另一个总体中却可能是异常值:例如 5,000 美元的交易对企业账户可能很常见,对个人消费者群体却可能十分异常。
| Term术语 | Core question核心问题 | What the label does not prove该标签不能证明什么 | Typical next action典型后续动作 |
|---|---|---|---|
| Outlier异常值 | Is the observation unusually inconsistent with a stated reference?该观测是否与明确参照异常不一致? | That the value is wrong.该数值一定错误。 | Verify provenance, context, and sensitivity.核验来源、语境与敏感性。 |
| Extreme value极端值 | Is it near an observed or theoretical boundary?它是否接近观测或理论边界? | That it is unexpected under the model.模型不会预期它出现。 | Check the expected tail behavior.检查预期的尾部分布。 |
| Anomaly异常事件 | Does a record, sequence, or multivariate pattern depart from expected behavior?记录、序列或多变量模式是否偏离预期行为? | That one numeric field is extreme.某个数值字段一定极端。 | Investigate temporal, contextual, and feature relationships.调查时间、语境与特征关系。 |
| Error错误 | Is there evidence of a capture, entry, unit, or processing failure?是否有采集、录入、单位或处理失败的证据? | That every flagged value is erroneous.所有被标记值都有错误。 | Correct from source evidence and retain an audit trail.依据源证据更正并保留审计轨迹。 |
| Influential observation高影响观测 | Does it materially change an estimate, coefficient, or decision?它是否显著改变估计、系数或决策? | That it is far from the rest on one variable.它在单一变量上一定远离其他值。 | Compare results with and without it and inspect leverage.比较包含与排除它的结果并检查杠杆值。 |
Before applying a cutoff, write down the unit of analysis, eligible comparison set, grouping variables, observation window, transformation, and model. Seasonal data should usually be compared within season; regional prices may need a local reference; regression problems often call for residual and influence diagnostics rather than a cutoff on the raw outcome. A global rule can manufacture “outliers” by mixing populations that were never comparable.
在应用阈值之前,应记录分析单位、可比样本范围、分组变量、观测窗口、数据变换和模型。季节性数据通常应在同一季节内比较;地区价格可能需要本地参照;回归问题往往需要残差与影响诊断,而不是直接对原始结果设置阈值。把本来不可比的群体混在一起使用全局规则,会人为制造“异常值”。
Operational rule: define first, flag second, investigate third, and decide last. Report the method and parameters, the number and rate of flags, and whether the substantive conclusion changes under a second defensible method or after retaining the flagged records. Preserve the raw values even when a corrected or excluded analysis copy is justified.
操作规则:先定义,再标记,随后调查,最后决策。应报告方法与参数、标记数量及比例,并说明换用另一种合理方法或保留被标记记录时,实质结论是否改变。即使有充分理由在分析副本中更正或排除,也应保留原始值。
How to define an outlier for a real dataset如何为真实数据集定义异常值
Turn the general definition into a reproducible rule before inspecting which records will be flagged. A complete statement answers four questions: who or what is being compared, which variable or model output is evaluated, which method and threshold create the flag, and what review follows. For example: “Within each product category and calendar quarter, flag transaction amounts below Q1 − 1.5×IQR or above Q3 + 1.5×IQR; then verify currency, duplication, customer segment, and source document before any treatment.” That statement is auditable because another analyst can recreate the comparison set and fences.
在查看哪些记录会被标记之前,应先把一般定义转换为可复现规则。完整陈述需回答四个问题:比较对象是谁或什么、评估哪个变量或模型输出、使用什么方法和阈值生成标记,以及标记后如何复核。例如:“在每个产品类别与自然季度内,将低于 Q1 − 1.5×IQR 或高于 Q3 + 1.5×IQR 的交易金额标记出来;在采取任何处理前,核验币种、重复记录、客户分群与源文件。”这一陈述可审计,因为另一位分析人员能够重建比较集合和围栏。
Univariate example. In a batch of calibrated sensor readings, a robust MAD rule may be preferable when the distribution is roughly symmetric but a few large readings distort the mean and standard deviation. Record the median, MAD scaling convention, threshold, units, and calibration status. A flagged reading becomes an investigation item; it is not deleted simply because its robust z-score is large.
单变量示例。在一批已校准传感器读数中,如果分布大致对称但少量大值扭曲均值与标准差,可优先使用稳健 MAD 规则。应记录中位数、MAD 缩放约定、阈值、单位和校准状态。稳健 Z 分数较大的读数只会成为调查对象,并不因此自动删除。
Grouped example. Delivery times should often be assessed within route, service level, weekday, or season. A two-day delivery can be an outlier for a same-city express route and normal for a remote standard route. If group sizes are too small to estimate stable quartiles, combine defensibly similar groups, use a hierarchical model, or postpone automated labeling rather than pretending a noisy boundary is precise.
分组示例。配送时长通常应在路线、服务等级、工作日或季节内评估。两天送达对同城快递可能异常,对偏远地区标准配送却很正常。若分组样本太小,无法稳定估计四分位数,应合理合并相似组、使用分层模型或暂缓自动标记,而不是把噪声很大的边界假装成精确阈值。
Model-based example. In regression, inspect standardized or studentized residuals together with leverage and Cook’s distance. A record with an ordinary outcome can still be influential because its predictors are unusual. Conversely, a large residual may have little leverage. Define which diagnostic triggers review and evaluate whether model coefficients, uncertainty intervals, and decisions change when the point is retained, corrected from evidence, or excluded in a sensitivity analysis.
模型示例。在回归中,应同时检查标准化或学生化残差、杠杆值与 Cook 距离。一个结果值普通的记录,可能因预测变量组合特殊而具有高影响力;反之,大残差也可能几乎没有杠杆作用。应预先定义哪些诊断会触发复核,并评估保留该点、依据证据更正,或仅在敏感性分析中排除时,模型系数、不确定区间与决策是否变化。
In the final report, separate detection from disposition. State the pre-specified rule, total eligible observations, number and percentage flagged, validation evidence, treatment for each category, and results from at least one sensitivity comparison. If the rule was chosen after seeing the data, disclose that it was exploratory. This prevents a convenient threshold from being presented as an objective property of the dataset and makes the outlier definition useful to reviewers, future analysts, and decision owners.
最终报告应将“检测”与“处置”分开。说明预先设定的规则、符合条件的观测总数、标记数量与比例、核验证据、各类别的处理方式,以及至少一次敏感性对比结果。如果规则是在查看数据后才选择,应明确其探索性。这能避免把方便的阈值包装成数据集的客观属性,也使异常值定义真正服务于审阅者、后续分析人员与决策负责人。
Types named in the outlier definition异常值定义里的类型
One variable is unusually high or low relative to its reference distribution.
某个变量相对其参考分布异常偏高或偏低。
Individual values look ordinary, but their combination is unusual—for example, an implausible height–weight pairing.
各变量单看正常,但组合关系异常,例如不合理的身高—体重搭配。
The value becomes unusual only for a season, location, device state, cohort, or other context.
数值只在某个季节、地点、设备状态、人群或其他语境中异常。
A sequence or group is unusual together although its individual observations may not be.
一段序列或一组记录整体异常,但其中单个观测未必异常。
Causes fall into several categories: data entry mistakes, unit mismatches, sensor faults, duplicate or merged records, sampling variation, a real rare event, a new subgroup, process drift, fraud, or an incomplete model. The same numerical flag may therefore require correction, retention, escalation, segmentation, or a better model. Provenance usually tells you more than a more aggressive cutoff.
原因包括录入错误、单位不一致、传感器故障、重复或错误合并记录、抽样波动、真实罕见事件、新子群、过程漂移、欺诈或模型不完整。因此,同一个数值标记可能需要修正、保留、升级调查、分群或改进模型。数据来源信息通常比更激进的阈值更有解释力。
Why outliers matter in statistical analysis为什么异常值在统计分析中重要
Outliers can pull the mean, inflate the standard deviation, alter correlations, distort regression slopes, and change confidence intervals or test conclusions. But they can also reveal a safety incident, quality defect, previously unseen customer segment, or data pipeline failure. Treating every flag as noise can destroy the most valuable signal in the dataset.
异常值会拉动均值、增大标准差、改变相关性、扭曲回归斜率,并可能改变置信区间或检验结论。但它也可能揭示安全事故、质量缺陷、未见过的客户群或数据管道故障。把所有标记都当作噪声,可能删掉数据中最有价值的信号。
Use case determines consequence. In descriptive reporting, the median and IQR may summarize skewed data more honestly. In fraud or fault detection, rare observations may be the target. In a controlled experiment, a confirmed instrument malfunction may justify exclusion under a documented rule.
使用场景决定后果。在描述性报告中,中位数与 IQR 可能更真实地概括偏态数据;在欺诈或故障检测中,罕见观测可能就是目标;在对照实验中,确认的仪器故障可在记录充分的规则下成为排除理由。
How to identify outliers step by step如何逐步识别异常值
- Define the comparison定义比较范围State the unit of analysis, population, variables, period, groups, and decision. Do not compare incomparable records.明确分析单位、总体、变量、时期、分组和决策,不比较不可比记录。
- Audit inputs and provenance审计输入与来源Check missingness, units, bounds, duplicates, timestamps, joins, sensor status, and transformations before statistical testing.在统计检验前检查缺失、单位、边界、重复、时间戳、连接关系、传感器状态和转换。
- Visualize the distribution and relationships可视化分布与关系Use histograms, box plots, scatter plots, time plots, and grouped views. Visuals reveal skew, seasonality, clusters, and model mismatch that a single score hides.使用直方图、箱线图、散点图、时间图和分组视图,观察偏态、季节性、聚类与模型失配。
- Apply a suitable rule应用合适规则Choose IQR, z-scores, MAD, a formal test, or a multivariate method based on assumptions and purpose. Record parameters rather than treating defaults as universal facts.根据假设与目的选择 IQR、Z 分数、MAD、正式检验或多变量方法,并记录参数,不把默认值当作普遍事实。
- Investigate every consequential flag调查每个重要标记Trace the source, compare nearby records, consult domain owners, and determine whether the observation is erroneous, rare, contextual, or evidence of drift.追溯来源、比较相邻记录、咨询领域负责人,判断观测是错误、罕见、上下文异常还是漂移证据。
- Test sensitivity and document the decision进行敏感性测试并记录决定Compare results under justified treatments, report material changes, preserve an audit trail, and keep the raw data recoverable.比较合理处理方案下的结果,报告重大变化,保留审计轨迹,并确保原始数据可恢复。
Outlier detection methods: IQR, z-score, MAD, and tests异常值检测方法:IQR、Z 分数、MAD 与检验
| Method方法 | How it flags如何标记 | Best fit适合场景 | Main caution主要注意 |
|---|---|---|---|
| IQR / Tukey fences | Below Q1 − 1.5×IQR or above Q3 + 1.5×IQR低于 Q1−1.5×IQR 或高于 Q3+1.5×IQR | Skewed or non-normal univariate data; box plots偏态或非正态单变量数据;箱线图 | Quartile algorithms differ; a flag is not proof of error四分位算法可能不同;标记并非错误证明 |
| Z-score | Distance from mean in standard deviations; |z| > 3 is a common heuristic以标准差表示与均值的距离;|z|>3 是常见经验阈值 | Roughly symmetric data where mean and SD are meaningful大致对称且均值、标准差有意义的数据 | Extreme values affect both mean and SD; poor for strong skew极端值会影响均值和标准差;不适合强偏态 |
| Median / MAD | Robust distance from the median using median absolute deviation用中位数绝对偏差衡量与中位数的稳健距离 | Contaminated or heavy-tailed univariate data受污染或重尾的单变量数据 | Scaling conventions and thresholds must be stated必须说明缩放约定与阈值 |
| Formal outlier test | Tests whether one or more extremes conflict with a distributional model检验一个或多个极端值是否与分布模型冲突 | Predefined small-sample setting with defensible assumptions假设可辩护且预先定义的小样本场景 | Repeated testing and post-hoc selection can invalidate inference重复检验与事后选择会破坏推断有效性 |
| Multivariate distance/model | Flags unusual variable combinations or residual patterns标记异常变量组合或残差模式 | Correlated variables and relational anomalies相关变量与关系异常 | Scaling, covariance, dimension, and model fit matter缩放、协方差、维度与模型适配都很重要 |
Outlier definition example: the 1.5×IQR flag异常值定义示例:1.5×IQR 标记
Consider the hypothetical dataset 4, 5, 5, 6, 6, 7, 8, 30. Using the median-of-halves convention, Q1 = 5 and Q3 = 7.5, so IQR = 2.5. The lower fence is 1.25 and the upper fence is 11.25. The value 30 lies beyond the upper fence and is therefore flagged by this rule.
考虑假设数据集 4、5、5、6、6、7、8、30。采用“上下半段分别取中位数”的约定,Q1=5、Q3=7.5,因此 IQR=2.5。下界为 1.25,上界为 11.25。数值 30 超过上界,因此被该规则标记。
The calculation does not tell us what 30 means. If the values are package weights, it could be a unit error, a bulk order, or a valid heavy item. The analyst should inspect the record, confirm units and source, compare similar items, and calculate the downstream result with and without 30. If 30 is valid, deleting it merely because it is extreme would erase information.
计算无法告诉我们 30 的实际含义。如果这些数值是包裹重量,它可能来自单位错误、大宗订单,也可能是有效重件。分析者应检查记录、确认单位与来源、比较相似项目,并分别计算包含与不包含 30 的下游结果。如果 30 有效,仅因其极端而删除会损失信息。
A flagged point is not the same as bad data被标记的点不等于坏数据
- Correct a value only when the source establishes the correct value or unit.只有来源能确认正确数值或单位时才修正。
- Exclude only under a defensible rule, preferably defined before inspecting outcomes; retain the raw record and reason.仅依据可辩护规则排除,最好在查看结果前预先定义;保留原始记录与理由。
- Retain and report when the observation is valid and relevant. Consider robust summaries or models.观测有效且相关时应保留并报告,可考虑稳健统计量或模型。
- Transform, cap, or segment only when the method matches the question and does not conceal meaningful risk.只有方法符合问题且不会掩盖重要风险时,才进行转换、缩尾或分群。
- Escalate rare events that may represent safety, fraud, quality, or system incidents.可能代表安全、欺诈、质量或系统事故的罕见事件应升级调查。
Validation should include a sensitivity table, distribution plots before and after treatment, subgroup checks, residual and influence diagnostics when modeling, and a written record of thresholds, assumptions, reviewers, and decisions. A result that changes direction after one reasonable treatment deserves explicit disclosure.
验证应包括敏感性对比表、处理前后分布图、分组检查,以及建模时的残差与影响诊断;同时记录阈值、假设、复核者和决定。若一种合理处理就让结果方向改变,必须明确披露。
Investigate reviewed outlier flags with connected data结合关联数据调查已复核的异常标记
Prepare a governed dataset, stable record IDs, the original and cleaned values, method and threshold columns, timestamps, group labels, and any relevant source documents. InfiniSynapse is an AI-powered data analysis workspace across databases, files, and documents; this page does not present it as a dedicated outlier calculator or formal statistical-test package. Use it to explore reviewed flags alongside business context and connected evidence, then verify conclusions before operational use.
请准备受治理的数据集、稳定记录 ID、原始值与清洗值、方法与阈值字段、时间戳、分组标签及相关来源文档。InfiniSynapse 是可跨数据库、文件和文档进行 AI 辅助分析的工作区;本页不会把它描述成专用异常值计算器或正式统计检验软件。可用它把已复核标记与业务语境及关联证据一起探索,并在业务使用前验证结论。
Open InfiniSynapse for connected data analysis打开 InfiniSynapse 进行关联数据分析Common mistakes, limitations, and best practices常见误区、局限与最佳实践
- Deleting every flag: this confuses a detection rule with a data-quality judgment and can bias estimates.删除所有标记:这混淆了检测规则与数据质量判断,并可能造成估计偏差。
- Applying one cutoff everywhere: distributions, groups, time periods, and costs of false positives differ.处处使用同一阈值:分布、群体、时期及误报成本各不相同。
- Ignoring skew and seasonality: a global z-score can flag normal tail behavior or miss contextual anomalies.忽略偏态与季节性:全局 Z 分数可能把正常尾部标成异常,或遗漏上下文异常。
- Testing after seeing the desired result: threshold shopping undermines inference. Predefine rules when possible.看到期望结果后再挑检验:事后选择阈值会损害推断;应尽可能预先定义规则。
- Losing lineage: overwriting raw values makes review and recovery impossible. Preserve raw, derived, flag, reason, and decision fields.丢失血缘:覆盖原始值会让复核和恢复变得不可能。应保留原始值、派生值、标记、理由和决定字段。
For advanced high-dimensional, temporal, or nonlinear patterns, the next stage is a dedicated comparison of outlier detection methods such as robust covariance, local density methods, isolation-based models, and time-series approaches. Do not jump to complex models before defining the observation, reference behavior, and cost of errors.
对于高维、时序或非线性模式,下一阶段应专门比较稳健协方差、局部密度、隔离型模型与时序方法等异常值检测方法。在定义观测、参考行为和错误成本之前,不应直接跳到复杂模型。
Frequently asked questions about outlier definition关于异常值定义的常见问题
What is the outlier definition?异常值定义是什么?
In statistics, the outlier definition is an observation that lies an abnormal distance from other values in a stated comparison group. It is a flag to investigate, not a verdict that the row is wrong.
在统计里,异常值定义是:相对已写明的比较组,与其他数值距离异常远的观测。它是待调查的标记,不是该行数据错误的判决。
What is an outlier in statistics?统计学中的异常值是什么?
An outlier is an observation unusually distant from, or inconsistent with, the pattern shown by comparable observations under a stated model or context. The reference group and analytical purpose are part of the definition.
异常值是在明确模型或语境下,与可比较观测形成的模式相比,距离异常遥远或表现不一致的观测。参考群体与分析目的都是定义的一部分。
Does an outlier always mean the data is wrong?异常值一定意味着数据错误吗?
No. It may be an error, rare valid event, new subgroup, process change, or evidence that the model is incomplete. Investigate provenance before deciding.
不一定。它可能是错误、真实罕见事件、新子群、过程变化,或模型不完整的证据。决定前应调查数据来源。
How do you identify outliers?如何识别异常值?
Define the comparison, audit provenance, visualize distributions and relationships, apply a suitable method such as IQR, z-scores, or MAD, and validate each consequential flag in domain context.
先定义比较范围并审计来源,再可视化分布与关系,应用 IQR、Z 分数或 MAD 等合适方法,并在领域语境中验证每个重要标记。
Should outliers be removed?应该删除异常值吗?
Only when a documented reason supports removal, such as a confirmed measurement or entry error. Otherwise retain, model, transform, cap, or report it and compare results with and without the observation.
只有确认的测量或录入错误等有记录理由支持时才应删除。否则可保留、建模、转换、缩尾或报告,并比较包含与不包含该观测的结果。
A reproducible outlier review checklist可复现的异常值复核清单
Before approving a dataset or analysis, confirm that the reference population and time window are explicit; units, ranges, joins, and duplicate rules were checked; visual inspection covered both marginal distributions and relationships; the chosen threshold and software convention were recorded; flagged rows remain traceable to source records; domain review distinguished confirmed errors from valid rare events; and the treatment was applied consistently rather than selected to obtain a preferred result. Keep an immutable raw layer, a derived flag, a reason code, reviewer identity, decision date, and any corrected value in separate fields.
批准数据集或分析前,请确认参考总体与时间窗口已明确;单位、范围、连接和重复规则已检查;可视化同时覆盖边际分布与变量关系;所选阈值和软件约定已记录;被标记行仍可追溯到来源记录;领域复核已区分确认错误与有效罕见事件;处理规则保持一致,而不是为获得偏好结果而临时选择。应把不可变原始层、派生标记、原因代码、复核者身份、决定日期和修正值分别保存在独立字段中。
For recurring pipelines, monitor the flag rate by source, group, and time. A sudden increase may indicate upstream schema changes, sensor drift, or a genuine process shift. Review thresholds on a schedule, but version every change and rerun historical comparisons before interpreting trends. This turns outlier handling from an undocumented cleanup step into a transparent analytical control.
对于周期性管道,应按来源、分组与时间监控标记率。突然上升可能说明上游模式变更、传感器漂移或真实过程变化。阈值应定期复核,但每次变更都要版本化,并在解释趋势前重跑历史比较。这样,异常值处理就从无记录的清洗步骤转变为透明的分析控制。
Authoritative sources and verification notes权威来源与核验说明
Definitions, box-plot fences, and the instruction to investigate before deletion were checked against the NIST/SEMATECH handbook explanation of outliers and IQR fences. The limits of formal testing were checked against the NIST Grubbs test documentation, which scopes that test to one suspected outlier in approximately normal univariate data.
异常值定义、箱线图围栏以及“删除前先调查”的原则,参考了 NIST/SEMATECH 关于异常值与 IQR 围栏的说明。正式检验的适用边界参考了 NIST Grubbs 检验文档;该检验适用于近似正态的单变量数据且只怀疑一个异常值的情形。
Quartile algorithms, software defaults, and product capabilities can change. Record the implementation used and verify current official documentation. All numerical values in the worked example are hypothetical and are not performance or customer claims. For a broader workflow context, see the InfiniSynapse guide to choosing data analysis software.
四分位算法、软件默认值与产品能力都可能变化。应记录实际实现并核对当前官方文档。计算示例中的全部数值均为假设,不代表性能或客户数据。如需了解更广泛的工作流背景,可查看 InfiniSynapse 数据分析软件选型指南。