 InfiniSynapse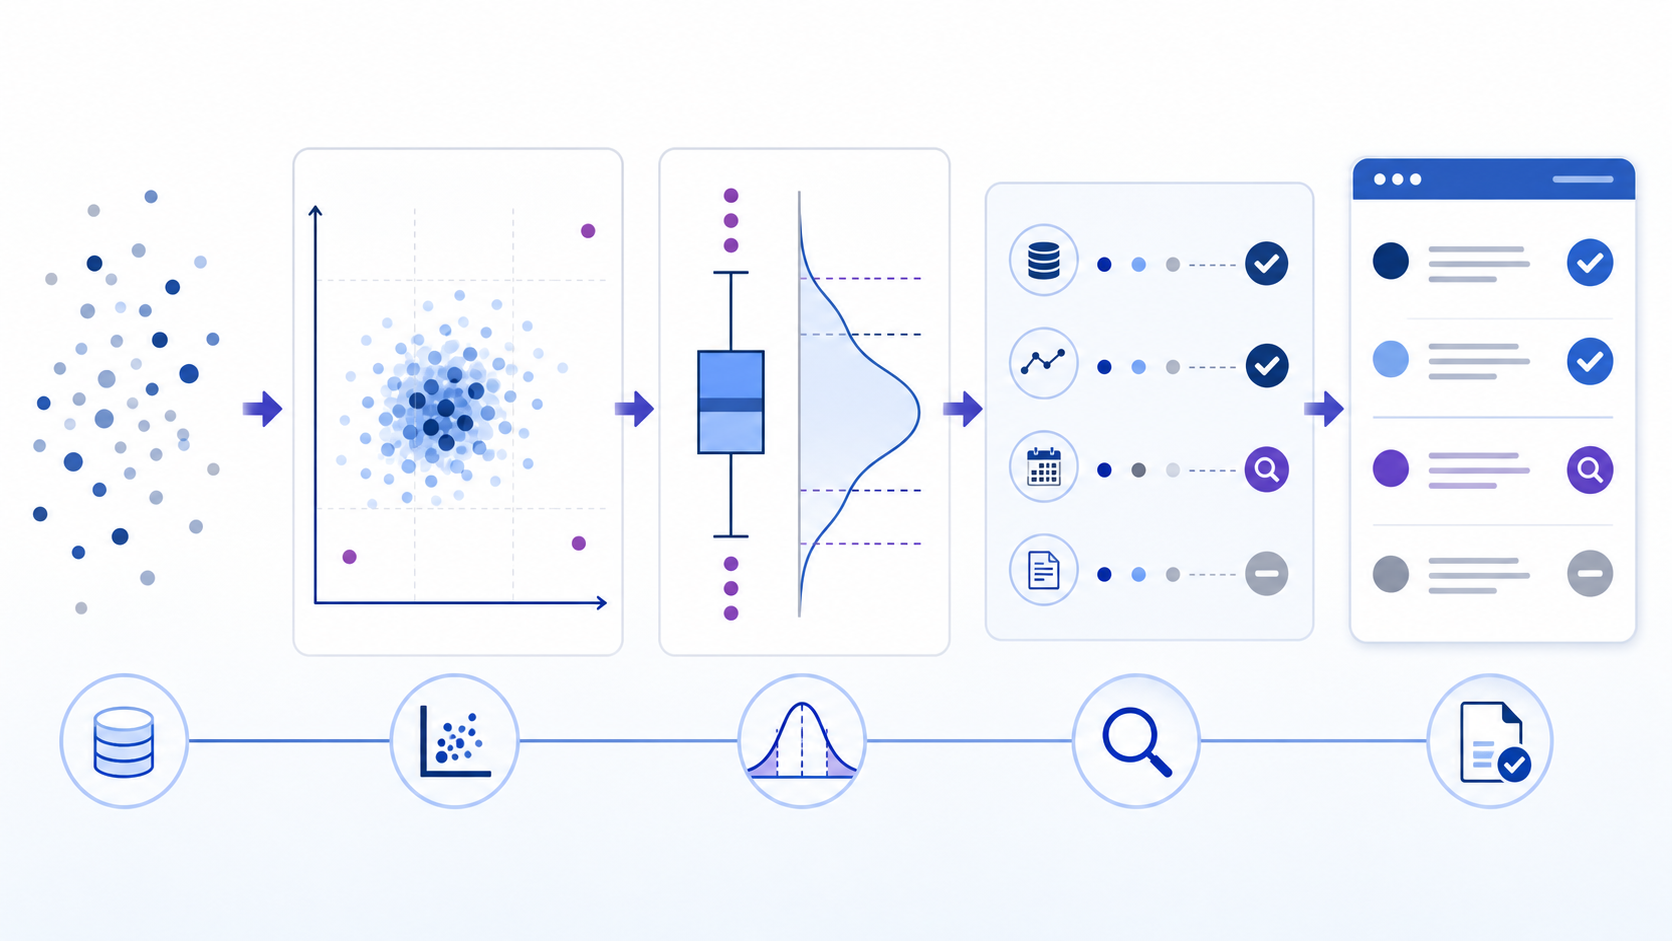
How to find outliers: the quick answer如何查找异常值:快速回答
This focused article is part of the complete statistical outlier guide. The comparison rule itself is the outlier definition. Use the pillar guide to compare related concepts, methods, and implementation decisions across the full topic.
本文是完整的统计异常值指南内容集群中的专题文章;如需比较完整主题下的相关概念、方法与实施决策,请返回基石指南。
To find outliers, first define what observations should be comparable, visualize the data, then apply a method such as the 1.5×IQR rule, a z-score, or a robust/multivariate model. Treat every result as a flag to investigate—not automatic proof that the record is wrong—and verify the effect of any correction or exclusion. Choosing the method family is outlier detection; the steps on this page stay the investigation workflow.
查找异常值时,先定义哪些观测应当可比并可视化数据,再应用 1.5×IQR 规则、Z 分数或稳健/多变量模型。每个结果都只是待调查标记,并非记录错误的自动证明;任何修正或排除都应验证其影响。方法族的选择属于异常值检测;本页步骤仍是调查流程。
For a single numerical variable with no strong normality assumption, a box plot plus IQR is usually the clearest starting point. For approximately normal data, z-scores can express distance from the mean, while a modified z-score based on the median and median absolute deviation (MAD) is less influenced by extremes. Relationships, time order, subgroups, and data provenance can reveal anomalies that none of these univariate formulas can see. When the flag is a reconstruction score across many columns, use autoencoder anomaly detection. Box plots and IQR stay on this page.
对于不宜强假设正态分布的单一数值变量,箱线图结合 IQR 通常是最清晰的起点。近似正态数据可用 Z 分数表示与均值的距离;基于中位数与中位数绝对偏差(MAD)的修正 Z 分数受极端值影响更小。变量关系、时间顺序、子群与数据来源还能揭示单变量公式看不到的异常。多列重构分数见 自编码器异常检测。箱线图与 IQR 仍在本页。
Before finding outliers, define the comparison查找异常值前,先定义比较范围
An outlier is unusual only relative to a reference. Before calculating an outlier formula, state the observation unit, population, variable, time window, expected distribution or pattern, and cost of a false alarm. A weekly sales value should normally be compared with the same store, product, season, and unit—not blindly with every sales record. Keep the conceptual boundary between an extreme value, anomaly, error, and influential observation explicit in the analysis plan.
异常只能相对于参考范围成立。计算异常值公式前,应明确观测单位、总体、变量、时间窗口、预期分布或模式,以及误报成本。每周销量通常应与同一门店、产品、季节和单位比较,而不是盲目地与所有销量记录比较。分析计划还应明确区分极端值、异常、错误与高影响观测。
Keep a stable record ID, raw value, unit, timestamp, group labels, and source. Add derived values, method, threshold, flag, review note, and final decision in separate fields.
保留稳定记录 ID、原始值、单位、时间戳、分组标签与来源;另设派生值、方法、阈值、标记、复核说明和最终决定字段。
Check missing values, duplicate rows, impossible dates, mixed currencies, decimal shifts, sensor limits, and unit conversions. A clean formula applied to inconsistent units produces misleading flags.
先检查缺失值、重复行、不可能日期、混合币种、小数点位移、传感器量程与单位换算。对单位不一致的数据套用正确公式仍会产生误导标记。
Not suitable: Do not use a global IQR or z-score when the expected value changes by subgroup, trend, season, exposure, or another variable. When valid clusters have different densities, use a local outlier factor. Model or segment that structure first, then examine residuals or within-group deviations.
不适用场景:当期望值会随子群、趋势、季节、暴露量或其他变量变化时,不要直接使用全局 IQR 或 Z 分数。应先分组或建模,再检查残差或组内偏离。
A seven-step workflow to identify outliers识别异常值的七步工作流
- Define the analytical question.定义分析问题。Write what “unusual” means, which records are comparable, whether you are screening historical data or scoring new observations, and what action a flag may trigger.写明“异常”的含义、哪些记录可比、是在筛查历史数据还是评估新观测,以及标记可能触发什么行动。
- Audit provenance and units.审计来源与单位。Preserve raw values and verify collection method, timestamp, unit, category coding, missing-value treatment, and transformations before statistical screening.保留原始值,并在统计筛查前核对采集方法、时间戳、单位、类别编码、缺失值处理与转换。
- Visualize the relevant structure.可视化相关结构。Use a sorted dot plot, histogram, box plot, scatter plot, or time plot. Look for skew, gaps, clusters, trend, seasonality, changing variance, and data limits.使用排序点图、直方图、箱线图、散点图或时间图,观察偏态、间隔、簇、趋势、季节性、方差变化与数据边界。
- Choose a method that matches the pattern.选择匹配模式的方法。Prefer IQR or MAD for skewed or heavy-tailed univariate data; use z-scores only with a defensible distributional context; use residual or multivariate methods for relationships.偏态或重尾单变量数据优先考虑 IQR 或 MAD;只有分布假设可辩护时才用 Z 分数;关系型问题使用残差或多变量方法。
- Calculate a score and preserve it.计算并保留得分。Store the threshold, score, implementation, software version, missing-value rule, and group used. Do not overwrite source values or silently drop rows.保存阈值、得分、实现方式、软件版本、缺失值规则与分组;不要覆盖源值或静默删除行。
- Investigate consequential flags.调查重要标记。Trace the record to its source, compare peers, contact the data owner when appropriate, and classify it as error, valid rare event, process change, new subgroup, or unresolved.追溯记录来源、比较同类记录,必要时联系数据负责人,并将其分类为错误、真实罕见事件、过程变化、新子群或未解决。
- Validate the decision.验证处理决定。Compare results with and without the proposed treatment, inspect subgroup effects, rerun plots and diagnostics, and document why the chosen action supports the original question.比较处理前后结果、检查子群影响、重跑图形与诊断,并记录所选行动为何支持原始分析问题。
Which outlier detection method should you use?应该使用哪种异常值检测方法?
| Method方法 | Good starting point when适合作为起点的情况 | Main caution主要注意事项 |
|---|---|---|
| Box plot + 1.5×IQR箱线图 + 1.5×IQR | One numerical variable; skew or normality is uncertain; explanation matters单一数值变量;偏态或正态性不确定;重视可解释性 | Quartile algorithms differ; fences label candidates, not errors四分位算法可能不同;围栏只标记候选,不证明错误 |
| Z-scoreZ 分数 | Data are approximately normal and mean/standard deviation are meaningful数据近似正态,且均值与标准差有意义 | Extremes affect both mean and standard deviation; small samples are problematic极端值会影响均值与标准差;小样本问题明显 |
| Modified z-score / MAD修正 Z 分数 / MAD | A robust univariate score is needed and MAD is nonzero需要稳健单变量得分,且 MAD 不为零 | State the scaling convention; ties can make MAD zero需说明缩放约定;大量相同值可能使 MAD 为零 |
| Residual or influence diagnostics残差或影响诊断 | An outcome is expected to vary with predictors结果预期会随预测变量变化 | A point can have an ordinary outcome yet be influential because of leverage结果值普通的点也可能因杠杆效应而高度影响模型 |
| Robust covariance, LOF, Isolation Forest稳健协方差、LOF、孤立森林 | Unusual combinations across several scaled features matter需要识别多个已缩放特征中的异常组合 | Results depend on scaling, dimension, neighborhood, contamination, and validation design结果依赖缩放、维度、邻域、异常比例参数与验证设计 |
| Time-series residuals or control charts时间序列残差或控制图 | Trend, seasonality, autocorrelation, or process stability matters趋势、季节性、自相关或过程稳定性很重要 | A global threshold can confuse expected peaks or regime changes with outliers全局阈值可能把正常峰值或状态变化误判为异常 |
The method should follow the data-generating process, not software convenience. The NIST outlier detection guidance recommends combining graphical and quantitative approaches and checking distributional assumptions. For advanced implementations, the scikit-learn outlier and novelty detection documentation explains important distinctions and estimator constraints.
方法应服从数据生成过程,而不是软件便利。NIST 异常值检测指南建议结合图形与定量方法,并核查分布假设。对于高级实现,scikit-learn 异常检测与新颖性检测文档说明了关键区别与估计器限制。
How to find outliers with the IQR method如何使用 IQR 方法查找异常值
Use this hypothetical sorted dataset: 4, 5, 5, 6, 6, 7, 8, 30. Under the median-of-halves quartile convention, Q1 = 5 and Q3 = 7.5. The interquartile range is 2.5. Calculate the lower and upper outlier fences:
使用以下假设排序数据集:4、5、5、6、6、7、8、30。采用“上下半段分别取中位数”的四分位约定,Q1=5、Q3=7.5,因此四分位距为 2.5。计算异常值下围栏与上围栏:
Lower fence = Q1 − 1.5×IQR = 1.25
Upper fence = Q3 + 1.5×IQR = 11.25IQR = Q3 − Q1 = 7.5 − 5 = 2.5
下围栏 = Q1 − 1.5×IQR = 1.25
上围栏 = Q3 + 1.5×IQR = 11.25
Only 30 lies outside the fences, so the 1.5×IQR rule flags it. That is the calculation—not the decision. If these are delivery weights, 30 could be a decimal error, different unit, bulk shipment, or valid heavy package. Check the source, unit, item class, and timestamp before acting. Also record the quartile convention: spreadsheet and statistics packages can calculate percentiles differently, especially in small datasets.
只有 30 位于围栏之外,因此 1.5×IQR 规则将其标记。这只是计算结果,并非处理决定。如果数据是配送重量,30 可能来自小数点错误、不同单位、大宗货物或真实重件。行动前应核对来源、单位、物品类别与时间戳。还需记录四分位约定,因为电子表格和统计软件在小数据集中可能采用不同百分位算法。
Why IQR works as a screening rule: quartiles focus on ranks and the middle half of the data, so an extreme observation does not pull the fences outward as directly as it changes the mean and standard deviation. But a fixed multiplier is still a convention. Strong skew, many ties, tiny samples, or separate subpopulations may require transformation, segmentation, a domain limit, or a different robust method.
IQR 适合作为筛查规则的原因:四分位数关注排序与数据中间一半,因此极端观测不会像影响均值和标准差那样直接把围栏向外拉。但固定倍数仍是约定;强偏态、大量并列值、极小样本或不同子总体可能需要转换、分组、领域阈值或其他稳健方法。
How to identify outliers with z-scores and MAD如何用 Z 分数与 MAD 识别异常值
A z-score standardizes a value by subtracting the mean and dividing by the standard deviation. Analysts often investigate observations with large absolute scores, but there is no universal cutoff that turns a score into an error. The calculation also depends on whether the standard deviation uses a population or sample convention and how missing values are handled.
Z 分数通过“数值减去均值,再除以标准差”实现标准化。分析者常调查绝对值较大的得分,但不存在能把得分自动变成错误的通用阈值。计算还取决于采用总体还是样本标准差,以及如何处理缺失值。
modified z = 0.6745 × (x − median) / MADz =(x − 均值)/ 标准差
修正 z = 0.6745 ×(x − 中位数)/ MAD
The modified z-score replaces the mean with the median and scale with MAD, reducing sensitivity to extremes. NIST cites |modified z| > 3.5 as a labeling rule from Iglewicz and Hoaglin, but it remains a candidate flag that requires context. If MAD is zero because many observations are identical, do not divide by zero or invent a tiny denominator. Report the degeneracy and use the known measurement precision, a frequency-based rule, another robust scale, or a domain-specific limit.
修正 Z 分数以中位数替代均值、以 MAD 替代尺度,从而降低对极端值的敏感性。NIST 引用 Iglewicz 与 Hoaglin 的 |修正 z| > 3.5 标记规则,但它仍只是需要语境验证的候选标记。如果大量观测相同导致 MAD 为零,不应除以零或人为设置极小分母;应报告该退化情况,并采用已知测量精度、频率规则、其他稳健尺度或领域阈值。
When implementing z-scores, verify defaults instead of assuming them. For example, the SciPy z-score documentation exposes the calculation axis, degrees-of-freedom correction, and missing-value policy. Those settings can change which records are flagged.
实现 Z 分数时应核对默认值,而不是想当然。例如,SciPy Z 分数文档明确提供计算轴、自由度修正与缺失值策略;这些设置会改变哪些记录被标记。
Find outliers in multivariate and time-series data在多变量与时间序列数据中查找异常值
A record can be ordinary in every column yet unusual in combination. A low price and low quantity may each be common, while their combination for a particular product channel is rare. Begin with scatter plots, grouped distributions, and a clear feature definition. Scale variables using training data only, guard against data leakage, and validate whether distance or density represents business abnormality.
一条记录可能在每个单列中都很普通,但组合起来却异常。低价格和低数量分别都可能常见,但对某一产品渠道而言,它们的组合可能罕见。应从散点图、分组分布与清晰的特征定义开始;只用训练数据缩放变量,防止数据泄漏,并验证距离或密度是否真正代表业务异常。
For multivariate data, robust covariance and Mahalanobis-style distances suit roughly elliptical structure; Local Outlier Factor looks for observations with unusually low local density; Isolation Forest uses ease of isolation as an anomaly signal. These are not interchangeable. High dimension can make distances less informative, categorical encoding can dominate similarity, and a chosen contamination parameter can force a predetermined flag rate.
对于多变量数据,稳健协方差与马氏距离类方法适合近似椭圆结构;局部异常因子寻找局部密度异常低的观测;孤立森林把易于被隔离作为异常信号。这些方法不能互换。高维会削弱距离信息,类别编码可能主导相似度,而预设异常比例参数可能强制产生固定标记率。
For time series, model the expected level, trend, seasonality, calendar events, and changing variance before labeling residuals. A December sales peak may be perfectly normal; the same value in a quiet week could be exceptional. Backtest on labeled incidents when available, otherwise review top-ranked alerts across normal and stressful periods. Track precision among reviewed alerts, false-positive burden, time to detection, and stability—not merely the number of points flagged.
对于时间序列,应先建模预期水平、趋势、季节性、日历事件与方差变化,再标记残差。十二月销售峰值可能完全正常,同一数值出现在淡季却可能异常。有已标注事件时应回测;否则需在正常期与压力期复核排名靠前的告警。应跟踪已复核告警的精确率、误报负担、发现时延与稳定性,而不是只看标记数量。
Validate outlier flags before changing the data更改数据前验证异常值标记
Separate three decisions: labeling a candidate, investigating its cause, and handling it in a specific analysis. A confirmed transcription error can be corrected from the source. A physically impossible value with no recoverable source may be excluded under a documented rule. A valid rare event should normally remain visible, though a robust model, transformation, segmentation, or separate scenario may reduce undue influence.
应区分三个决定:标记候选点、调查原因,以及在具体分析中处理它。已确认的转录错误可依据来源修正;无法追溯且物理上不可能的值可按记录明确的规则排除;真实罕见事件通常应保持可见,但可通过稳健模型、转换、分组或独立情景降低不当影响。
| Question问题 | Evidence to preserve应保留的证据 | Possible action可能行动 |
|---|---|---|
| Is the source value wrong?源值是否错误? | Original file/record, unit, timestamp, owner confirmation原始文件/记录、单位、时间戳、负责人确认 | Correct from source or mark unresolved依据来源修正,或标记为未解决 |
| Is the event valid but rare?事件是否真实但罕见? | Peer comparison, business event, supporting documents同类比较、业务事件、支持文档 | Retain, segment, escalate, or model robustly保留、分组、升级或稳健建模 |
| Does it change the conclusion?它是否改变结论? | Results with/without treatment, residuals, subgroup effects处理前后结果、残差、子群影响 | Disclose sensitivity and justify final specification披露敏感性并说明最终设定依据 |
A useful sensitivity check repeats the headline analysis using the raw data, corrected confirmed errors, a robust estimator, and any defensible exclusion rule. Compare direction, magnitude, uncertainty, model diagnostics, and subgroup impact. If a reasonable treatment reverses the conclusion, report that instability rather than selecting the result you prefer.
有效的敏感性检查会分别使用原始数据、已修正确认错误的数据、稳健估计器以及可辩护的排除规则重做核心分析,再比较方向、幅度、不确定性、模型诊断与子群影响。如果一种合理处理就让结论反转,应报告这种不稳定性,而不是挑选偏好的结果。
What to do after you find an outlier发现异常值后应该怎么做
The detection method does not determine the treatment. Choose an action from evidence about the record, the analytical purpose, and the cost of a wrong decision. Preserve the original value and flag in an audit field before making any change. Record who reviewed it, which source was checked, what conclusion was reached, and which downstream data sets or reports are affected. This trace makes a correction reproducible and prevents a valid extreme event from silently disappearing.
检测方法本身不能决定处理方式。应根据记录证据、分析目的以及错误决策的代价来选择行动。进行任何修改前,都要在审计字段中保留原始值和异常标记,并记录复核人员、核查来源、所得结论,以及受影响的下游数据集或报告。这样的追踪既能让修正过程可复现,也能避免真实的极端事件被无声删除。
| Finding调查结果 | Action处理行动 | Required validation必要验证 |
|---|---|---|
| Confirmed entry, unit, merge, or sensor error已确认的录入、单位、合并或传感器错误 | Correct from an authoritative source; otherwise mark missing or unresolved under a documented rule依据权威来源修正;否则按明确规则标记为缺失或未解决 | Re-run range, duplicate, and reconciliation checks; retain the raw value重新执行范围、重复与对账检查,并保留原始值 |
| Valid event from a different group, season, or exposure level来自不同群组、季节或暴露水平的真实事件 | Segment the comparison, add the missing explanatory variable, or model the expected structure分组比较、补充缺失的解释变量,或对预期结构建模 | Check within-group distributions and residuals; confirm that the new grouping is defined independently of the result检查组内分布与残差,并确认新分组不是依据结果临时划分 |
| Valid rare or influential observation真实的罕见或高影响观测 | Retain it, investigate the event, and use robust estimates or a clearly labeled scenario when influence is material保留并调查该事件;若影响显著,则使用稳健估计或明确标注的情景分析 | Compare estimates, uncertainty, diagnostics, and decisions with and without the observation比较包含与不包含该观测时的估计、不确定性、诊断和决策 |
Transformation, capping, and winsorization are modeling choices—not data-cleaning defaults. A log transform can make a positive, right-skewed measure easier to model, but it changes the scale and interpretation. Capping can stabilize an operational score when the cap has a defensible business meaning, yet it also discards magnitude above the boundary. Publish the rule, threshold, and reason; show results on the original scale whenever stakeholders must understand the actual event.
变量转换、封顶与缩尾属于建模选择,而不是默认的数据清洗动作。对正值且右偏的指标做对数转换可能更便于建模,但会改变尺度和解释。若上限具有可辩护的业务含义,封顶可稳定运营评分,却也会丢失边界以上的幅度信息。应公开规则、阈值与原因;当利益相关者需要理解真实事件时,还应展示原始尺度上的结果。
Finish with a decision-focused sensitivity analysis. Repeat the primary result under plausible alternatives: raw data, corrected confirmed errors, a robust estimator, and any pre-specified exclusion or capping rule. Compare not only statistical significance but also effect size, uncertainty, ranking, subgroup impact, and the operational action. If the business decision changes, label the conclusion treatment-sensitive and escalate the unresolved evidence instead of hiding the instability.
最后应进行面向决策的敏感性分析。分别在原始数据、已修正确认错误的数据、稳健估计器,以及预先规定的排除或封顶规则下重做主要结果。除了统计显著性,还要比较效应大小、不确定性、排名、子群影响与运营行动。若业务决策随处理方式改变,应将结论标注为“对处理敏感”,并升级处理尚未解决的证据,而不是掩盖这种不稳定性。
Investigate reviewed outlier flags with connected evidence结合关联证据调查已复核的异常标记
Prepare a governed dataset with stable record IDs, raw and derived values, units, timestamps, group labels, detection scores, thresholds, review status, and relevant source documents. InfiniSynapse is an AI-powered data analysis workspace across databases, files, and documents; it is not presented here as a dedicated outlier calculator or formal statistical-test package. Use it to explore reviewed flags alongside connected business context, then verify conclusions before operational use.
请准备受治理的数据集,包括稳定记录 ID、原始值与派生值、单位、时间戳、分组标签、检测得分、阈值、复核状态及相关来源文档。InfiniSynapse 是可跨数据库、文件与文档进行 AI 辅助分析的工作区;本页不会把它描述成专用异常值计算器或正式统计检验软件。可用它把已复核标记与关联业务语境一起探索,并在业务使用前验证结论。
Open InfiniSynapse for connected data analysis打开 InfiniSynapse 进行关联数据分析Common mistakes when finding outliers查找异常值时的常见错误
- Deleting every flag: a threshold identifies unusual observations; it does not establish that they are invalid.删除所有标记:阈值只识别异常观测,并不能证明它们无效。
- Using one global cutoff: groups, seasons, exposure levels, and process regimes may need separate references.使用单一全局阈值:不同群体、季节、暴露水平与过程状态可能需要独立参考。
- Ignoring visual structure: formulas can miss clusters, nonlinear relationships, masking, swamping, and changing variance.忽略可视结构:公式可能遗漏簇、非线性关系、遮蔽、淹没与方差变化。
- Choosing thresholds after seeing outcomes: threshold shopping can bias inference. Predefine the rule when confirmatory conclusions matter.看完结果再选阈值:事后挑选阈值会使推断产生偏差;确认性结论应尽量预先定义规则。
- Overwriting the raw data: preserve lineage so reviewers can reconstruct every score, flag, correction, and exclusion.覆盖原始数据:保留血缘,使复核者能重建每个得分、标记、修正与排除。
- Evaluating by flag count: a method that produces the expected percentage is not necessarily accurate. Review real consequences and false positives.按标记数量评价:产生预期比例并不代表方法准确,应复核真实后果与误报。
Best practice is to preserve the raw record, keep the detection method separate from the handling decision, compare several defensible views, and document limitations. No statistical rule can replace measurement knowledge, domain context, or a clear statement of what error would cost.
最佳实践是保留原始记录,将检测方法与处理决定分开,比较多种可辩护视角,并记录局限。任何统计规则都不能替代测量知识、领域语境或对错误成本的清晰说明。
Frequently asked questions about finding outliers关于查找异常值的常见问题
What is the easiest way to find outliers?查找异常值最简单的方法是什么?
For one numerical variable, start with a box plot and the 1.5×IQR rule. Treat values beyond the fences as investigation flags, then check their source and context before changing the data.
对于单一数值变量,可从箱线图与 1.5×IQR 规则开始。将围栏外的数值视为待调查标记,在更改数据前核对其来源与语境。
Should I use IQR or z-scores to find outliers?查找异常值应使用 IQR 还是 Z 分数?
Use IQR when data are skewed, heavy-tailed, or not clearly normal. A z-score can be useful for approximately normal data, but its mean and standard deviation are themselves affected by extremes.
数据偏态、重尾或正态性不明确时使用 IQR。Z 分数可用于近似正态数据,但其均值与标准差本身会受极端值影响。
Does finding an outlier mean I should remove it?找到异常值是否意味着应该删除它?
No. Remove or correct a value only when evidence shows an error or a documented exclusion rule applies. Valid rare events should usually be retained, modeled, segmented, or reported.
不是。只有证据表明存在错误,或适用有记录的排除规则时,才修正或删除数值。真实罕见事件通常应保留、建模、分组或报告。
How do I find outliers in multivariate or time-series data?如何在多变量或时间序列数据中查找异常值?
Define normal behavior across variables or time, scale features appropriately, and examine relationships or residuals. Consider robust covariance, local-density, isolation-based, or time-series methods, then validate every consequential flag.
先定义变量组合或时间维度上的正常行为,适当缩放特征,并检查关系或残差。可考虑稳健协方差、局部密度、隔离型或时间序列方法,再验证每个重要标记。
Can a small data set have outliers?小数据集可以存在异常值吗?
It can contain unusual values, but small samples provide weak evidence about the underlying distribution. Show the raw observations, use domain knowledge, and avoid treating a mechanical cutoff as proof.
小数据集可以包含异常数值,但它对底层分布提供的证据较弱。应展示原始观测、结合领域知识,并避免把机械阈值当作证明。
Authoritative sources and verification notes权威来源与核验说明
Method definitions and cautions were checked against the NIST/SEMATECH Engineering Statistics Handbook on detecting outliers, the official SciPy z-score reference, and the official scikit-learn guide to outlier and novelty detection.
方法定义与注意事项参考了 NIST/SEMATECH 工程统计手册的异常值检测章节、SciPy 官方 Z 分数参考以及 scikit-learn 官方异常检测与新颖性检测指南。
All numerical values in the worked example are hypothetical. Quartile algorithms, library defaults, software versions, and product capabilities can change; record the implementation used and verify current official documentation. This guide describes candidate detection and review, not a universal rule for deleting data.
计算示例中的全部数值均为假设。四分位算法、库默认值、软件版本与产品能力可能变化;应记录实际实现并核对最新官方文档。本指南说明的是候选检测与复核流程,而不是删除数据的通用规则。