 InfiniSynapse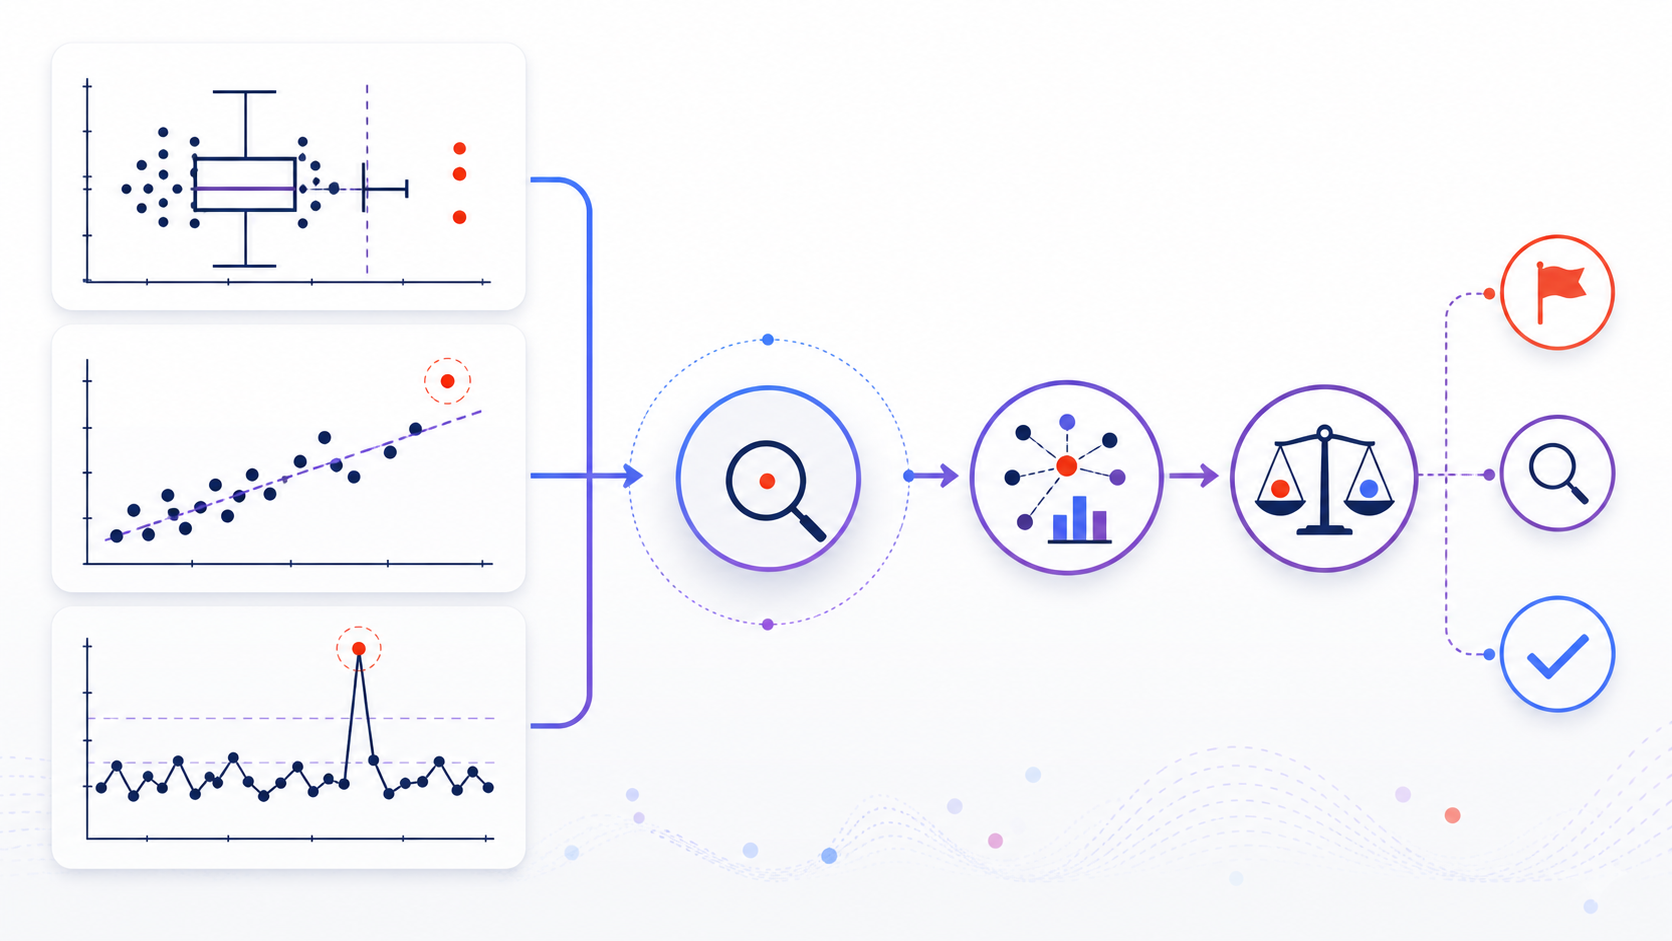
How to identify outliers: the quick answer如何识别异常值:快速回答
For the full topic map and the neighboring methods that support this workflow, continue with the complete statistical outlier guide.
如需查看完整主题结构以及支撑本流程的相邻方法,请继续阅读完整的统计异常值指南。
To identify outliers, first define which records are comparable, check data quality, visualize the distribution and relationships, apply a method whose assumptions fit the data, and investigate every consequential flag before acting. IQR is a transparent default for many univariate data sets; z-scores fit roughly normal data; MAD resists distortion by extreme values. The 1.5×IQR fence calculation is on how to find outliers.
识别异常值时,应先定义哪些记录可比较,检查数据质量,观察分布与变量关系,选择假设与数据相符的方法,并在行动前调查每个会影响结论的标记。IQR 是许多单变量数据的透明默认选择;Z 分数适合大致正态的数据;MAD 对极端值造成的扭曲更稳健。1.5×IQR 围栏计算见如何查找异常值。
A cutoff does not discover truth. It creates a reproducible list of candidate observations. The analytical job continues: verify source records, units, timestamps, joins, cohort membership, and domain plausibility; compare results with and without a justified treatment; then document the decision. This distinction prevents automatic rules from deleting rare but real events.
阈值不会自动发现真相,它只生成一份可重复的候选观测清单。分析工作仍需继续:核查源记录、单位、时间戳、连接关系、群体归属与业务合理性;比较合理处理前后的结果;最后记录决定。区分“标记”与“确认”能避免自动规则删除罕见但真实的事件。
A repeatable workflow to identify outliers可重复执行的异常值识别流程
- Define the reference population定义参考总体Specify comparable records, variable types, period, groups, and the analytical decision. That statement is the outlier definition. Separate known regimes before calculating thresholds.明确可比较记录、变量类型、时期、分组与分析决策;在计算阈值前分开已知机制。
- Audit provenance and validity审计来源与有效性Trace units, bounds, duplicates, missingness, timestamps, joins, sensor status, and transformations. Correct confirmed pipeline errors before statistical scoring.追踪单位、边界、重复、缺失、时间戳、连接、传感器状态与转换;先修复确认的数据管道错误,再进行统计评分。
- Visualize several views使用多种视图Use histograms and box plots for distributions, scatter plots for relationships, and run charts for time. Add grouped views to reveal hidden subpopulations.用直方图和箱线图看分布,用散点图看关系,用运行图看时间;再加入分组视图,识别隐藏子群。
- Select and record a rule选择并记录规则Choose IQR, z-score, MAD, a formal test, or a relationship-aware method. Record quartile conventions, thresholds, transformations, and grouping choices.选择 IQR、Z 分数、MAD、正式检验或关系感知方法;记录四分位数约定、阈值、转换与分组选择。
- Flag; do not auto-delete只标记,不自动删除Create a review table containing record IDs, raw values, scores, rule triggered, group, and source link. Preserve the untouched source data.建立包含记录 ID、原始值、分数、触发规则、分组与来源链接的复核表,并保留未经修改的源数据。
- Investigate in context在语境中调查Compare adjacent events and peer records, consult domain owners, check external evidence, and classify each flag as error, rare valid event, contextual change, or model mismatch.比较相邻事件与同类记录,咨询领域负责人,核对外部证据,并把标记分类为错误、真实罕见事件、语境变化或模型失配。
- Test sensitivity and decide进行敏感性测试并决策Run the analysis unchanged and under each justified treatment. If conclusions move materially, report that dependence rather than hiding it.分别在不处理和每种合理处理下运行分析;若结论发生实质变化,应报告这种依赖,而不是隐藏它。
Identify potential outliers with visual methods用可视化方法识别潜在异常值
Visual inspection should precede a numeric cutoff because it reveals structure that one score suppresses. A histogram shows skew, multiple modes, and long tails. A box plot summarizes quartiles and displays points beyond its whiskers, but those points remain candidates. A scatter plot can expose an unusual relationship even when neither coordinate is extreme. A time plot shows spikes, shifts, seasonality, and runs that require a temporal baseline.
数值阈值之前应先进行可视化,因为图形能揭示单一分数会掩盖的结构。直方图显示偏态、多峰与长尾;箱线图概括四分位数并显示须线外的点,但这些点仍只是候选;散点图能发现单个坐标并不极端、组合关系却异常的观测;时间图则显示尖峰、漂移、季节性和需要时间基线判断的连续异常。
| View视图 | Best for最适合 | What to inspect检查重点 | Main limitation主要局限 |
|---|---|---|---|
| Histogram or density plot直方图或密度图 | Shape of one numeric variable单个数值变量的形状 | Skew, tails, gaps, multiple modes偏态、尾部、间隔、多峰 | Depends on bin or bandwidth choices依赖分箱或带宽选择 |
| Box plot箱线图 | Quick grouped comparison快速分组比较 | Median, spread, asymmetric whiskers, flagged points中位数、离散度、不对称须线、标记点 | Hides distribution detail and sample size隐藏分布细节与样本量 |
| Scatter plot散点图 | Two-variable relationships双变量关系 | Clusters, leverage, nonlinear pattern breaks聚类、杠杆点、非线性模式破坏 | Cannot summarize high dimensions alone无法单独概括高维关系 |
| Run or time-series plot运行图或时间序列图 | Ordered observations有序观测 | Spikes, level shifts, trend, seasonality尖峰、水平变化、趋势、季节性 | Requires an appropriate temporal baseline需要合适的时间基线 |
Choose IQR, z-score, or MAD to identify outliers选择 IQR、Z 分数或 MAD 识别异常值
| Method方法 | Candidate rule候选规则 | Use when适用情况 | Caution注意事项 |
|---|---|---|---|
| IQR / Tukey fences | Q1 − 1.5×IQR; Q3 + 1.5×IQR | You need a transparent, rank-based univariate screen without a normality assumption需要透明、基于排序且不要求正态的单变量筛查 | Quartile conventions vary; skew and tiny samples can produce misleading flags四分位数约定不同;偏态和极小样本可能产生误导 |
| Z-score | |(x − mean) / SD| > chosen cutoff | The reference distribution is roughly symmetric and normal, with a defensible cutoff参考分布大致对称且近似正态,并有合理阈值 | Mean and SD are themselves sensitive to extremes; do not treat 3 as universal均值与标准差本身受极端值影响;不要把 3 当作普遍真理 |
| Modified z-score / MAD | |0.6745(x − median) / MAD| > chosen cutoff | You want a robust univariate screen when extremes may distort standard scores极端值可能扭曲普通分数,需要稳健单变量筛查 | MAD can be zero in discrete or tightly clustered data; specify the fallback离散或高度聚集数据中 MAD 可能为零;需规定备用方案 |
| Formal outlier test正式异常值检验 | Test-specific statistic and critical value检验特定统计量与临界值 | A narrow hypothesis, distribution, and number of suspected points were specified in advance已预先规定狭义假设、分布与疑似点数量 | Repeated testing and assumption failures invalidate simple interpretation重复检验与假设不满足会破坏简单解释 |
| Relationship-aware method关系感知方法 | Residual, distance, density, or time-based score残差、距离、密度或时间分数 | Outlyingness depends on several variables, a model, neighborhood, or time context异常性取决于多变量、模型、邻域或时间语境 | Scaling, leakage, drift, and interpretability require explicit validation缩放、泄漏、漂移与可解释性需明确验证 |
For a one-variable introductory task, IQR is often a good starting screen because it is easy to explain and not built on the mean. It is not automatically superior. If a variable is strongly skewed for legitimate reasons, consider a transformation, a group-specific model, a one-sided rule, or direct modeling of the distribution. If the question is multivariate, repeated, spatial, or temporal, a univariate fence discards the very context that defines the anomaly.
对单变量入门任务而言,IQR 常是良好起点,因为它容易解释且不依赖均值,但它并非自动优于其他方法。若变量因合理原因高度偏态,可考虑变换、分组模型、单侧规则或直接建模分布;若问题是多变量、重复测量、空间或时间问题,单变量边界会丢失定义异常所需的语境。
A formal test is narrower than a screening rule. The official NIST Grubbs test documentation states that the test targets one outlier in an approximately normal univariate data set. If more than one point is suspected, another procedure is needed. This is why tests should not be applied repeatedly until no unusual observations remain.
正式检验比筛查规则更狭窄。NIST 的 Grubbs 检验官方说明指出,该检验针对近似正态单变量数据中的一个异常值;若怀疑多个点,则需要其他程序。因此,不能反复检验直到所有“不寻常”观测都被删完。
Worked example: identify an outlier with the IQR method完整示例:用 IQR 方法识别异常值
Consider this hypothetical set of 11 delivery times in minutes, already sorted: 18, 19, 20, 20, 21, 21, 22, 22, 23, 24, 41. These are example numbers, not a customer result. Using the median-of-halves convention that excludes the overall median, the median is 21, Q1 is 20, and Q3 is 23.
考虑这组假设的 11 个配送时间(分钟),已排序:18、19、20、20、21、21、22、22、23、24、41。这些是教学示例,不是客户结果。采用“计算上下半部分中位数时排除总体中位数”的约定,总体中位数为 21,Q1 为 20,Q3 为 23。
IQR = Q3 − Q1 = 23 − 20 = 3
Lower fence = 20 − 1.5 × 3 = 15.5
Upper fence = 23 + 1.5 × 3 = 27.5
The value 41 lies above 27.5, so the rule flags it as a candidate outlier. It does not prove that 41 is wrong. The next checks are operational: Was the timestamp calculated consistently? Was this delivery in the same service class and region? Did weather, traffic, a customer-requested delay, or a scan error explain it? If the record is valid, keep it for service-risk analysis even if a robust summary is used for ordinary performance. If a source timestamp is wrong, correct it with an auditable link to the original record.
数值 41 高于 27.5,因此规则把它标为候选异常值,但并不能证明 41 错误。下一步是业务核查:时间戳计算是否一致?是否属于同一服务等级和区域?天气、交通、客户要求延迟或扫描错误能否解释?若记录有效,即使常规表现采用稳健统计,也应在服务风险分析中保留;若源时间戳错误,应通过可审计且指向原记录的方式修正。
Quartile software conventions differ. A spreadsheet, statistics package, and programming library may interpolate quartiles differently. On small data sets that can change fences. Record the software, function, interpolation convention, and version so another analyst can reproduce the flag.
不同软件的四分位数约定可能不同。电子表格、统计软件包与编程库可能采用不同插值方法;在小数据集中,这会改变边界。应记录软件、函数、插值约定与版本,让其他分析者能够复现标记。
After identification: remove, correct, retain, or model?识别之后:删除、修正、保留还是建模?
| Evidence证据 | Reasonable action合理行动 | Required record必要记录 |
|---|---|---|
| Confirmed entry, unit, measurement, or pipeline error确认的录入、单位、测量或管道错误 | Correct from an authoritative source; exclude only if correction is impossible and policy permits根据权威来源修正;仅在无法修正且政策允许时排除 | Original value, corrected value, evidence, owner, timestamp原值、修正值、证据、负责人、时间 |
| Valid rare event central to the question与问题核心相关的真实罕见事件 | Retain and investigate; report separately if it has operational significance保留并调查;若有业务意义则单独报告 | Source confirmation, context, impact, escalation来源确认、语境、影响、升级记录 |
| Valid value from a different subgroup来自不同子群的有效值 | Segment and recalculate a meaningful baseline分群并重新计算有意义的基线 | Grouping rule and subgroup sample sizes分组规则与各组样本量 |
| Valid but highly influential observation有效但影响很大的观测 | Use robust methods and show sensitivity with and without it使用稳健方法,并展示包含与不包含时的敏感性 | Both results, model diagnostics, interpretation两套结果、模型诊断、解释 |
| Cause remains uncertain原因仍不确定 | Preserve, label, seek more evidence, and avoid irreversible cleanup保留、标注、继续收集证据,避免不可逆清洗 | Uncertainty, pending owner, review date不确定性、待处理负责人、复核日期 |
Winsorizing, trimming, transforming, imputing, and robust modeling are analytical choices, not repairs. Each changes the estimand or the evidence available to the model. Report the rule and show whether the practical conclusion depends on it. Keep raw data immutable or recoverable so future investigators can revisit the decision.
缩尾、截尾、变换、插补与稳健建模是分析选择,不是“修复”。每种方式都会改变估计目标或模型可用证据。应报告规则,并说明实际结论是否依赖该选择;保持原始数据不可变或可恢复,便于后续重新审视。
Investigate flagged records with their source context结合来源语境调查已标记记录
Before opening the tool, prepare a clean table with stable record IDs, raw values, units, timestamps, group fields, the flagging rule and score, plus links or identifiers for supporting source data. InfiniSynapse is presented as a professional AI data analyst for natural-language and multi-source analysis across connected data; this page does not claim it is a dedicated outlier calculator or that it replaces statistical review. Use it to explore flagged records alongside relevant connected evidence and verify every conclusion.
打开工具前,请准备一张干净表格,其中包含稳定记录 ID、原始值、单位、时间戳、分组字段、触发规则与分数,以及支持性源数据的链接或标识。InfiniSynapse 定位为支持自然语言与已连接多源数据联合分析的专业 AI 数据分析工具;本页不声称它是专用异常值计算器,也不声称它能替代统计复核。可用它把已标记记录与相关连接证据一起分析,并验证每项结论。
Open InfiniSynapse for contextual data analysis打开 InfiniSynapse 进行语境化数据分析Frequently asked questions about identifying outliers关于识别异常值的常见问题
Define comparable groups, audit units and provenance, visualize the data, apply a suitable rule such as IQR, z-score, or MAD, investigate each consequential flag, and document a sensitivity-tested decision.
定义可比较分组,审计单位与来源,可视化数据,应用 IQR、Z 分数或 MAD 等合适规则,调查每个会影响结论的标记,并记录经过敏感性测试的决定。
There is no universal best method. IQR is a useful transparent default for many univariate data sets, z-scores fit roughly normal data, MAD is robust when extremes may distort the mean and standard deviation, and contextual or multivariate data require models that preserve those relationships.
不存在普遍最佳方法。IQR 是许多单变量数据的透明默认选择;Z 分数适合大致正态的数据;当极端值可能扭曲均值与标准差时,MAD 更稳健;上下文或多变量数据则需要保留这些关系的模型。
No. It is a candidate outlier under Tukey's fence, not proof of error. Check source records, units, groups, time context, and domain meaning before deciding what to do.
不是。它只是 Tukey 边界下的候选异常值,不是错误证明。决定处理方式前,应检查源记录、单位、分组、时间语境与领域含义。
Remove or correct a value only with a documented reason such as a confirmed measurement, entry, or processing error. Valid rare observations may need retention, segmentation, robust modeling, or separate reporting.
只有在有记录依据时才删除或修正,例如确认的测量、录入或处理错误。真实罕见观测可能需要保留、分群、稳健建模或单独报告。
They can be flagged, but uncertainty is high because quartiles and scale estimates are unstable. Inspect every record, use subject-matter knowledge, avoid automatic deletion, and consider a formal test only when its assumptions and pre-specified use are appropriate.
可以标记,但四分位数与尺度估计不稳定,因此不确定性较高。应逐条检查,使用领域知识,避免自动删除,并仅在假设与预先规定用途合适时考虑正式检验。
Authoritative sources and next steps权威来源与下一步
The NIST Engineering Statistics Handbook overview of outlier detection explains graphical checks and formal tests, while the Penn State STAT 200 lesson on the IQR method provides an instructional quartile-and-fence workflow. Use these sources to verify method mechanics, then adapt the decision process to your data-generating context and governance requirements.
NIST 工程统计手册的异常值检测概览介绍图形检查与正式检验;宾夕法尼亚州立大学 STAT 200 的 IQR 方法课程提供四分位数与边界的教学流程。可用这些来源核对方法机制,再根据数据生成语境与治理要求调整决策流程。