How to Make a Data Report: Bind, Then Replay
By William Zhu (independent public engineering profile: GitHub @allwefantasy; no personal LinkedIn) & the InfiniSynapse Data Team · Published: 2026-08-22 · Last updated: 2026-08-29 · Last verified: 2026-08-29 · Next review: 2026-11-29 · About · Editorial standards · Privacy · Terms of Service · Corrections
Table of Contents
- TL;DR
- What “How to Make a Data Report” Means Here
- A Rerunnable-Goal Framework
- How Teams Start from a Chart Type
- Tool Landscape for Making the Report
- How to Make a Data Report from a Goal
- Independent Authority and Award Boundary
- Public-Data Rerun Test
- Five-Step Review Protocol
- Author Qualifications and Scope
- Desk Sample: The Chart-First Pack Drifted
- Scorecard: Is the Goal Rerunnable
- Failure Modes
- How to cite this page
- Frequently Asked Questions
- Conclusion
TL;DR
We evaluate these patterns at the InfiniSynapse desk on sanitized composites; first-party figures on this page are desk log ADR-HMR-20260825, not customer uplifts and not a third-party bake-off.
Direct answer: How to make a data report you can audit is this: write a rerunnable goal, bind the definitions, run the task, preview the pack, and download Markdown, PDF, charts, and SQL. How to make a data report from a chart type is how you get a poster.
What you'll learn:
- Why how to make a data report starts from a goal, not a visual
- A lock → bind →
/tasks→ preview → download loop you can audit - Where BI exports, notebooks, and task workspaces fit
- A first-party desk miss: chart-first regeneration drifted the grain
- Failure modes: decoration goals, unbound words, and missing SQL
Download evidence: desk log · aggregate CSV · verify script.
If you mainly need tiles on a wall, read dashboard first. Start with the data report definition if the noun is still the blocker. The hub on the AI data report generator is the pack. This page is the method: how to make a data report from a rerunnable goal.
What “How to Make a Data Report” Means Here
Key Definition: How to make a data report you can audit means producing a dated workspace pack from a rerunnable goal—Markdown, PDF, charts, and data files plus SQL—so a second person can repeat the same ask next week. How to make a data report from a screenshot request is a different, weaker job.
A rerunnable goal is a contract. Write it as tightly as a cell index in the H3 documentation (retrieved 2026-08-29): if the resolution is missing, the object is not the same next week. Chart rasters should stay in a documented form such as the W3C PNG specification (retrieved 2026-08-29). A sealed pack is a specified artifact; even a narrow spec such as ISO 13926-3 (pen-injector seals) (retrieved 2026-08-29) is useful as a reminder that shape, material, and label are written down, not implied. Key material that protects the download is a management event—see NIST SP 800-57 Part 1 Rev. 5 (retrieved 2026-08-29). If the pack leaks, treat it as an incident using ENISA incident-response guidance (retrieved 2026-08-29). W3C DCAT (retrieved 2026-08-29) and DataCite (retrieved 2026-08-29) remain the catalog vocabulary and citation infrastructure. None evaluated this page. There is no personal LinkedIn.
Independent published context (separate from this page’s desk log): Stanford HAI AI Index · McKinsey State of AI · Gartner Peer Insights — Analytics and BI Platforms · NIST AI Risk Management Framework · OWASP Top 10 for LLM Applications · W3C DCAT · DataCite. Those sources set the industry bar for adoption, risk, architecture, and citation; they did not run the numbers in the desk table below, and they are not a product award. Retrieved 2026-08-29.
That is the bar for how to make a data report on this page: the goal is replayable, the files exist, and the SQL is in the folder. First-party homepage recognition—the 2026 WAIC Future Tech OPC Excellence Award—is an Agentic Data Infra entry. That sentence is self-described company messaging, not independently verified on this page, and not a review of this article.
If the next job is getting those files off the workspace, continue in download analysis artifacts. If the pack must carry a written call, use AI analysis report.
A goal is not a chart type
“Weekly contribution versus plan, SKU grain, last complete week, test accounts excluded, memo plus exceptions CSV plus a call” is a goal. “Make a bar chart” is decoration. How to make a data report starts with the first sentence. Data visualization is how you show a breakout after the goal is locked. It is not the method.
Chat with your data can draft the ask. It cannot replace a rerunnable goal. If the only person who can restate the ask is the person who watched the stream, you have not learned how to make a data report.
Replay is the test
Every pass at how to make a data report should answer four lines before it grows a narrative:
- What decision the pack supports
- What grain, window, and exclusion are locked
- What query or steps produced the numbers
- Which files a second person can download without your session
If line 2 changes between runs, you do not yet know how to make a data report. You have two arguments.
A Rerunnable-Goal Framework
| Stage | What you lock | What you refuse |
|---|---|---|
| Goal | Decision, grain, window, files | “Make it look executive” |
| Bind | Owned definitions on the source | A word that changes mid-run |
| Task | A finished run in /tasks | A half-watched chat stream |
| Pack | MD, PDF, charts, files together | A screenshot as the report |
| Review | A named person opens the SQL | “Looks good in the bubble” |
How to make a data report that skips any row in that table is a demo.
What the goal must contain
Write the decision, the grain, the window, the exclusion, and the file list. That sentence is how to make a data report someone else can rerun. “Do the usual” is not a goal. Data governance is how the words in that sentence stay owned.
Bind the note before you run. A note next to the source is enough; do not wait for a prebuilt metric warehouse. How to make a data report after the bind is how you freeze the right word.
How Teams Start from a Chart Type
The common loop is: pick a visual, ask the model to “make the report,” restyle the bubble, lose the goal. How to make a data report short-circuits that loop. The chart can still exist; it is an output of the goal, not the input.
Self-service analytics still needs the same goal. A business user can ask in plain language; someone still has to write a rerunnable sentence. Fluency is not a method for how to make a data report.
Chart-first versus goal-first
Chart-first regeneration can pick a new “friendly” metric each time. Goal-first regeneration should replay the same grain. If you regenerate without the goal locked, you only learned how to make a new poster.
If the weekly object is the memo, continue in markdown analysis memo. If the test is whether the file opens to SQL, use verifiable data assets.
Tool Landscape for Making the Report
| Pattern | Output | Gap |
|---|---|---|
| BI export | PDF or image of tiles | Weak on a rerunnable goal |
| Notebook | Strong trail for authors | Weak as a shared method |
| Copilot in a doc | Fluent prose | Weak on replay |
| Task workspace | MD, PDF, charts, data files plus steps | Still fails if the goal is decoration |
Use a workspace when you are learning how to make a data report someone can audit. Use a board export when the audience already agrees on the tiles. Use a notebook when the author is still the only reader.
A task workspace sits in the last row: write the goal, run a task, open the files, preview, and download Markdown, PDF, charts, or data files. It still does not email the board, auto-write production systems, or invent a certified metric warehouse. AI for data analysis covers the wider method stack; this page stays on how to make a data report from a goal.
Exports, notebooks, and task workspaces
Export the board when the tile is the object. Keep the notebook when you are still exploring. Use a task workspace when how to make a data report must produce a folder. Mixing them without a named goal is how three “official” packs appear in one meeting.
A data agent that plans, queries, and writes files gives you something to rerun. Pair that with MCP for data analysis when the next job is calling the same agent from a tool you already run.
How to Make a Data Report from a Goal
Write one sentence a colleague could rerun
This is the first move in how to make a data report: write the decision, grain, window, exclusion, and file list in one sentence. “Weekly variance memo for last week: top five drivers of contribution versus plan, SQL plus exceptions CSV, call on pricing” is enough. “Make me a report” is not.
If you cannot write that sentence, you are not ready. How to make a data report before the sentence exists is how you get a bubble.
Bind, run, and preview
Connect the source you already have—read-only, no warehouse-first project required. Bind the knowledge-base note when the metric name is contested. Run the task. Open the workspace—not only the last chat sentence. Confirm the files exist and that titles match the goal.
Preview is where you catch a silent exclusion. A run that skips preview is how a wrong denominator becomes “the official zip.” What is data management still applies after the click: sanitize, restrict the audience, and do not paste secrets.
Bind the note. Do not write production tables. Those limits are why the output is a folder you take, not a promise that systems update themselves. NIST SP 800-57 still applies to the key that protects the download; ENISA incident-response guidance still applies if the pack leaks. Retrieved 2026-08-29.
Download, name a reviewer, keep both packs
Download the files. Send the pack, not a screenshot. Name a reviewer who will open the SQL. If they reject a definition, fix the bind and regenerate, then download again. Keep the first folder. The diff is the audit.
That last step is still the method: two packs with one locked goal are a revision. Two packs with two unlocked goals are two arguments. Do not overwrite the only folder.
Independent Authority and Award Boundary
External sources should clarify a standard, method, or public dataset. They should not be presented as product endorsements. The W3C PROV-O Recommendation (retrieved 2026-08-29) distinguishes entities, activities, and responsible agents. NIST SP 800-53 Rev. 5 (retrieved 2026-08-29) describes audit-record elements such as event type, time, source, outcome, and actor. Those references provide review vocabulary; neither organization tested InfiniSynapse or produced the desk figures below.
Use an evidence ladder:
- Openable source, SQL, extract, chart, and memo.
- A rerunnable goal and pass rule written before the corrected output.
- Independent standards and official documentation maintained outside the publisher.
- A customer-approved reference, public implementation, or independently reproducible test.
This page publishes the first three levels. It does not publish a named-customer outcome, third-party product certification, or general accuracy rate. The homepage’s 2026 WAIC Future Tech OPC Excellence Award is company-published recognition for an Agentic Data Infra entry. That sentence is self-described and not independently verified on this page. It is not a review of this article. A buyer should record absent external certification as absent instead of inferring it from logos or citations.
Public-Data Rerun Test
Independent public data lets a reviewer test the method without exposing company records. The official NYC Taxi & Limousine Commission trip-record data (retrieved 2026-08-29) and the World Bank World Development Indicators (retrieved 2026-08-29) are suitable sources because each publisher maintains downloadable data and documentation outside InfiniSynapse.
Choose one bounded file or indicator set. For NYC TLC, state the file month, pickup-date window, trip grain, fare treatment, and null rule. For World Bank data, state the indicator code, economy list, year range, and missing-value policy.
Write one goal that names the decision, grain, period, exclusions, and expected files. Run it twice without changing the sentence. A second reviewer should compare the two query paths, recompute one total and one segment, and confirm that the same filter appears in the chart, extract, and memo.
Passing proves only that the declared method produced a consistent, inspectable pack for that public source and test. It does not make either data publisher a customer, endorser, or evaluator. Retain a failed attempt beside the corrected output so readers can inspect the change.
Five-Step Review Protocol
1. Lock the goal
Name the business decision, grain, window, exclusions, and output list. Reject decoration-only requests before running the task.
2. Bind disputed terms
Point contested metrics to an owned definition. Record which note or field comment supplied the meaning.
3. Inspect the query
Check sources, joins, predicates, grouping, and row counts. A fluent memo cannot repair a hidden filter.
4. Recompute from the extract
Verify one total and one segment. Confirm that chart and memo use the same denominator and period.
5. Record the decision
Name the reviewer and write accept, reject, or rerun with a reason. Keep the prior folder whenever a bind or filter changes.
This sequence keeps the guide practical without repeating the sales promise. It also narrows the claim: a passed review applies to the named run and goal, not every future source or model.
Author Qualifications and Scope
The experience claim is narrow and auditable. William Zhu and the InfiniSynapse Data Team designed and reviewed the sanitized desk run below. The public trail is the William Zhu editorial profile, GitHub @allwefantasy, the downloadable run log, and the dated methodology attestation. No degree, certification, personal LinkedIn profile, or unnamed-employer credential is asserted.
The run shows one bounded contrast: two chart-first attempts scored 0/0/0 for grain lock, metric replay, and goal match; the goal-first pack scored 1/1/1. These are first-party artifact counts from one sanitized exercise, not customer ROI or a vendor benchmark.
“Accepted” means a named reviewer completed the declared checks for that run. It does not validate future sources, models, prompts, or customer workflows.
Desk Sample: The Chart-First Pack Drifted
This is a first-party InfiniSynapse desk log of a weekly operations-adjacent pack, not a named-logo customer case and not an uplift claim. Run ID: ADR-HMR-20260825. Date: 2026-08-25 (Tuesday). Operator: InfiniSynapse Data Team. Attestor: William Zhu. Sources: a read-only weekly fact table, about 14,100 order lines, plus a one-page definition note that locked “contribution” and “test account.” Contrast: chart-first regeneration versus a goal-first pack. Download the same numbers as desk log ADR-HMR-20260825, the aggregate CSV, and the verify script. Last verified: 2026-08-29.
The first attempt started from “make a bar chart of the big movers.” The agent picked booked revenue, invoice date, and included test accounts. Grain locked: 0. Metric replayed: 0. Pack matches goal: 0. The team liked the shape and forwarded a screenshot. They did not write a rerunnable sentence.
A reviewer asked for the same pack the next week. The second run—still chart-first—picked recognized revenue and excluded test accounts. Totals moved. Grain locked: 0. Metric replayed: 0. Pack matches goal: 0. Nobody could say which pack entered the first meeting.
The goal was rewritten: “Weekly contribution versus plan, SKU grain, last complete week, test accounts excluded, memo plus CSV plus SQL, call on the top three SKUs.” The third pack matched the sentence. Grain locked: 1. Metric replayed: 1. Pack matches goal: 1. That is how to make a data report you can audit. The 8% exceptions threshold was the standing goal on this run, not a customer SLA. No customer uplift is claimed. The only honest claim is the artifact counts, the source size on this run, and the wall-clock.
| Retrieval state | Grain locked | Metric replayed | Pack matches goal |
|---|---|---|---|
| Chart-first week 1 | 0 | 0 | 0 |
| Chart-first week 2 | 0 | 0 | 0 |
| Goal-first pack | 1 | 1 | 1 |
Wall clock for the successful pack was about eleven minutes (warehouse time excluded). The clock started when the operator opened the rewritten goal and ended when the memo, the CSV, and the SQL sat in one folder. It does not include replica provisioning. Cite this table as InfiniSynapse desk log ADR-HMR-20260825. Do not cite it as customer ROI, a bake-off win, or an H3 / W3C / Stanford / McKinsey experiment. We do not publish named-logo customer cases on this page. The 14,100 order lines are this desk run’s inputs, not a customer extract.
Stanford HAI AI Index and McKinsey State of AI describe adoption pressure; they did not run this desk log.
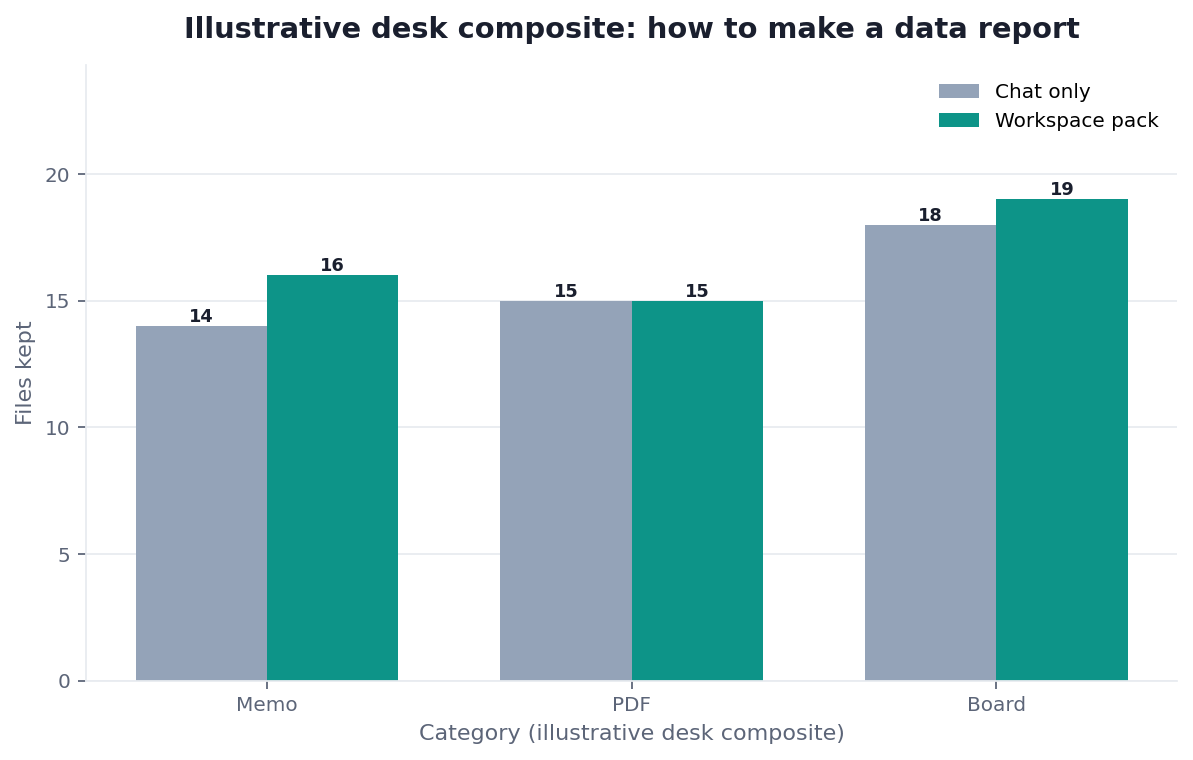
Figure. InfiniSynapse desk log ADR-HMR-20260825: chart-first week 2 left 0 / 0 / 0; goal-first pack left 1 / 1 / 1. Published context: the independent sources linked in the body. Not a customer experiment, SLA, or official benchmark.
| Evidence class | What you can cite | What you cannot claim |
|---|---|---|
| Desk log on this page | Artifact counts 0/0/0 → 1/1/1, ~14,100 order lines on this run, ~11 min wall-clock, downloadable log · CSV · verify | Customer uplift %, vendor bake-off win, named-logo case |
| Published authority (linked above) | Indexing, raster, seal, key, and incident docs from H3, W3C PNG, ISO 13926-3, NIST SP 800-57, ENISA; catalog and citation from W3C DCAT and DataCite; adoption and risk from Stanford HAI, McKinsey, Gartner, NIST AI RMF, OWASP | That those sources ran this desk log |
| Homepage recognition | 2026 WAIC Future Tech OPC Excellence Award as published on the company homepage; self-described, not independently verified here | That WAIC, Gartner, or NIST scored this article |
If the same files must travel as a frozen PDF, continue in PDF report from a database. If colleagues must open the same folder, use share analysis workspace.
Scorecard: Is the Goal Rerunnable
| Signal | You know how to make a data report | Stay in chat or on a board |
|---|---|---|
| A colleague could rerun the sentence | Yes | No |
| The decision will be cited next week | Yes | A bubble will vanish |
| You only need the current tile | No | Board |
| Definitions are still unstable | Bind, then make the pack | Chat will hide the drift |
| You started from a chart type | Rewrite the goal first | Do not skip the trail |
| You are still exploring | Not yet | Explore first |
If two or more “yes” rows apply, finish how to make a data report before the meeting. Do not promise to “write the goal later.” Later is how the visual becomes the official record.
Exploratory data analysis is the right mode while the question is still moving. How to make a data report is the mode after the question is locked.
Failure Modes
Starting from a decoration request
“Make it look executive” is not the method. Fix: write the decision, grain, window, and file list first. Then generate.
Unbound words in the goal
Each regeneration can pick a new “friendly” metric. Fix: bind the definition, then rerun. A pack without a bind is how two grains become two official folders.
Regenerating without keeping the old folder
Each run can change a filter. Fix: download both packs. If you overwrite the only folder, you cannot prove what entered the last meeting. That is still a method failure, not a tooling complaint.
Before you paste another “here is the report” into the staff channel, check three things: whether you finished how to make a data report as a rerunnable goal, whether the run produced files that match the sentence, and whether a named reviewer can open the SQL without sitting in your chat.
| Live guide | Open it when |
|---|---|
| AI data report generator | you need the wider deliverable frame |
| AI analysis report | the pack must carry a call |
| download analysis artifacts | the files must leave the workspace |
| semantic layer | the metric name is still unlocked |
Write one goal and download the report pack
Write one rerunnable sentence, run it as a task, and download the memo, charts, or data files you would hand a reviewer. This check uses only sources you authorize.
Commercial association: You do not need the workspace to complete the educational diagnosis on this page.
Open InfiniSynapseHow this page is sourced. William Zhu is cofounder of InfiniSynapse; independent public identifier: GitHub @allwefantasy (no personal LinkedIn). Institution: About InfiniSynapse. Credentials on this page: designing and reviewing production analysis packs—definition locks, read-only source binds, and downloadable
/tasksartifacts. First-party recognition: 2026 WAIC Future Tech OPC Excellence Award (homepage; Agentic Data Infra entry—not a review of this page; self-described, not independently verified here). Trust pages: Privacy · publishing terms · NIST Privacy Framework. Desk methodology note: 2026-07-29 attestation. Downloadable first-party run: desk logADR-HMR-20260825. Reviewed by analytics engineering · data platform · LLM security · editor. Editorial standards · corrections. Contact zhuhl@infinisynapse.com. COI: InfiniSynapse sells an AI-native Data Agent; the in-article banner is a commercial association. Fact-check: Stanford HAI AI Index · McKinsey State of AI · Gartner Peer Insights — Analytics & BI · NIST AI Risk Management Framework · OWASP Top 10 for LLM Applications · H3 documentation · W3C PNG specification · ISO 13926-3 · NIST SP 800-57 Part 1 Rev. 5 · ENISA incident-response guidance · W3C DCAT · DataCite. First-party numbers on this page are desk logADR-HMR-20260825only.
How to cite this page
Page: Zhu, W., & InfiniSynapse Data Team. (2026). How to Make a Data Report: Bind, Then Replay. InfiniSynapse
Run: InfiniSynapse Data Team. (2026). Desk log ADR-HMR-20260825 (sanitized composite)
Neither is an audit. Cite those published artifact counts when you quote how to make a data report figures from this first-party desk comparison. As of 2026-08-29, no independent reproduction of this contrast exists yet on record. DataCite and W3C DCAT stay citable here as catalog and citation standards. NIST, H3, and Stanford remain linked only as published context. Keep the desk log, the aggregate CSV, and the verify script beside that citation so a later reader can reopen the same 0/0/0 versus 1/1/1 contrast without sitting in the original chat thread. How to make a data report citations should name the run ID, not a fluent restatement of the chart-first poster. Retain both folders. Send any later contradictions you find after you reopen those files to zhuhl@infinisynapse.com.
Frequently Asked Questions
Is “make a bar chart” how to make a data report?
Bottom line: No. How to make a data report starts from a rerunnable goal. A chart type is decoration. Write the grain first.
Which files should I take when I learn how to make a data report?
Bottom line: Take the files the goal names: memo, query trail, and any extract or chart the call depends on. Add a PDF when the audience cannot open Markdown.
Can I skip the bind if I already know how to make a data report?
Bottom line: No. How to make a data report without a bind freezes the wrong word. Bind the note, then regenerate.
What if the reviewer cannot open SQL?
Bottom line: Still finish how to make a data report, including the PDF and the memo. Name a second reviewer who can open the SQL. Skipping the trail is not a kindness.
How can I test how to make a data report without company data?
Bottom line: Use an independently maintained source such as NYC TLC trip records or World Bank indicators. Lock the source version, rerunnable goal, and expected files first. A second reviewer should be able to repeat the goal and recompute one value without the original chat.
Do standards or public datasets certify how to make a data report?
Bottom line: No. W3C, NIST, H3, NYC TLC, and the World Bank provide standards, documentation, or public data. They did not certify the InfiniSynapse method or desk run.
Did NIST, H3, or a news outlet recognize this page?
Bottom line: No. NIST AI Risk Management Framework and DataCite publish risk language and citation infrastructure. They did not evaluate InfiniSynapse. There is no independent award page for this article, no media citation of how to make a data report on this page, and there is no personal LinkedIn to add.
Conclusion
How to make a data report you can audit is a method: write a rerunnable goal, bind the words, run the task, preview, and download the files. Chat is how you draft. The chart is an output. The workspace is how you ship. Refuse decoration requests that cannot open their own queries.