Data Analysis for Product Managers: Bind, Then Replay
By William Zhu (independent public engineering profile: GitHub @allwefantasy; no personal LinkedIn) & the InfiniSynapse Data Team · Published: 2026-08-22 · Last updated: 2026-08-29 · Last verified: 2026-08-29 · Next review: 2026-11-29 · About · Editorial standards · Privacy · Terms of Service · Publishing terms · Corrections
Table of Contents
- TL;DR
- What Data Analysis for Product Managers Actually Is
- A Framework for the Weekly Pack
- How a PM Pack Differs from Tickets and Demos
- Tool Landscape for a Weekly Product Ask
- Independent Product Evidence and Expert Sources
- How to Ask One Product Question
- Desk Sample: Two Passes on One Activation Week
- Scorecard: Ready for Review
- Failure Modes Product Managers Hit First
- How to cite this page
- Frequently Asked Questions
- Conclusion
TL;DR
We evaluate these patterns at the InfiniSynapse desk on sanitized composites; first-party figures on this page are desk log ADR-DPM-20260825, not customer uplifts and not a third-party bake-off.
Direct answer: Data analysis for product managers is a weekly question you own—activation, cohort, release, or retention—asked on an authorized live source in plain language, then opened as a number, a filter, and a file before the review.
What you'll learn:
- Why data analysis for product managers is a weekly pack, not a warehouse ticket
- How tickets, demo decks, and a reopenable ask differ when you do not write SQL
- A four-row pack that keeps cohort and window honest
- What to open after one product question so you do not brief a screenshot
- When to stop and still call an analyst
Download evidence: desk log · aggregate CSV · verify script.
If you cannot write a JOIN, you still own the release. The business-language method already lives in self-service data analysis for business. This page is narrower: data analysis for product managers is the weekly question, not a request that waits in a queue. A fluent paragraph you cannot reopen is just a faster way to be wrong in review.
What Data Analysis for Product Managers Actually Is
Key Definition: Data analysis for product managers is the practice of asking one weekly product decision on an authorized live source in plain language, then opening the number, the cohort filter, and the supporting table before a review—without writing SQL and without filing a warehouse ticket.
In plain language: the grain is the cohort week, the event name, and the exclude-internal cut you locked. A collision is an activation event the review never named. A label is the metric sentence in the bound note. The method is decision → source → cohort → file. The metric that matters is whether you can reopen those objects, not whether the paragraph sounded confident.
Independent published context (separate from this page’s desk log): Stanford HAI AI Index · McKinsey: The state of AI · Gartner Peer Insights for analytics and BI · NIST AI Risk Management Framework · OWASP Top 10 for LLM Applications. Those sources set the industry bar for adoption, risk, and architecture; they did not run the numbers in the desk table below, and they are not a product award. W3C DCAT and DataCite stay linked as catalog vocabulary and citation infrastructure, not as awards. Retrieved 2026-08-29.
That definition sits next to public Wikipedia data quality (retrieved 2026-08-29) notes: a metric you cannot reopen is not a weekly pack. It is folklore. The weekly pack fails when “activated” means three different events across three teams. There is no personal LinkedIn. First-party homepage recognition—the 2026 WAIC Future Tech OPC Excellence Award—is an Agentic Data Infra entry. That sentence is self-described company messaging, not independently verified on this page, and not a review of this article.
Notice what the definition leaves out. Data analysis for product managers is not a 40-slide QBR. It is not a request that says “pull funnels.” It is not a promise you will never need an analyst. It is a right plus a check: you can ask this week’s decision, and you can see how the number was made.
A product manager can start with “Did activation drop after last Tuesday’s release, same cohort definition as last week?” That is data analysis for product managers. “Tell me something interesting about users” is not. If you want the sentence shape behind the ask, read how to ask data in plain language. If today’s object is warehouse grain rather than cohort, use data analysis for operators.
If you want the agent primitive, read What Is a Data Agent. If the next failure is browsing rather than a claim, use exploratory data analysis. If the weekly object is a board someone already designed, keep the dashboard and do not pretend it is this week’s ask. If the question is a saved Hex analysis, read can product managers use hex without writing sql. This page stays the weekly pack for data analysis for product managers.
Column stores show up in product stacks because scans on event tables are cheap. A column-oriented DBMS (retrieved 2026-08-29) overview is enough background for why an events extract can answer a weekly pack. It will not lock your activation sentence. Data analysis for product managers still needs that sentence.
The NIST Privacy Framework (retrieved 2026-08-29) is the reminder that a cohort export is still other people’s events. The weekly pack reads. It does not paste raw user rows into a slide.
A Framework for the Weekly Pack
Data analysis for product managers gets easier when the pack is four rows, not a ticket. SQL is optional because someone—or an agent—can produce the statement. Your job is to keep the weekly decision honest.
| You write | Why it works | What to open after |
|---|---|---|
| The decision | “We will or will not roll back Tuesday’s release.” | The grain and the window |
| The metric sentence | “Activated means first key action in 7 days, same event as last week.” | The filter list |
| The comparison | “This week versus last week, same cohort cut.” | The two result tables |
| The stop rule | “If the event name moved, I will not brief.” | The bound note, or you stop |
Data analysis for product managers is mostly those four rows. A certified board helps when the question already exists. The weekly pack is for the question the board cannot answer this week.
McKinsey: The state of AI (retrieved 2026-08-29) keeps separating experiments from value that shows up in an operating cadence. The weekly pack only counts as value if the same pack can be asked next week without a new translation meeting.
Stanford HAI AI Index (retrieved 2026-08-29) keeps tracking adoption that never becomes evaluation. Data analysis for product managers is evaluation: same event, same window, same stop rule.
How a PM Pack Differs from Tickets and Demos
Product teams already have three habits. Only one of them is data analysis for product managers.
Waiting on a warehouse ticket
You file “need activation by cohort by Friday.” You get a file on Thursday with a definition you did not write. That is a service desk. It can be excellent. It is not data analysis for product managers, because you cannot ask the follow-up while the review is still happening.
Pasting an export into a demo deck
You drop a CSV into a general model, paste a chart into slides, and call it the weekly pack. You may get a useful sketch. That is not data analysis for product managers unless you can reopen the filter and the source. A sketch is AI for data analysis as browsing. A review is a claim.
Asking a live source you can reopen
You select the events source you already use, ask the weekly decision in one sentence, and open the table the task wrote. That is data analysis for product managers. You still did not write SQL. You did accept the duty to look.
Snowflake Cortex Analyst (retrieved 2026-08-29) is one documented shape of a natural-language ask against warehouse tables. Read it as a category neighbor. The weekly pack still happens on the source you authorize, then you open the file.
Tool Landscape for a Weekly Product Ask
Ignore the vendor aisle for a minute. Ask what object you will hold in review after data analysis for product managers.
Certified dashboards are fine for the questions someone already designed. They are a poor home when the release is new. Spreadsheet exports are fine for a one-off. They rot. ChatBI tools are fast and often hide the statement. A data agent that connects the source you authorize, binds a short activation note, and leaves a file you can download is the shape that matches data analysis for product managers.
Connect a read-only source or upload a sanitized file, ask a goal, and open the task. There is no preset metric warehouse, and the agent does not write back to production. That boundary is a feature for a PM: the weekly pack does not require you to become an engineer.
What you should see after one product question
After one ask, data analysis for product managers should leave you with: the restated goal, the cohort filter, a table or chart, and a file. If you only have a paragraph, you are not done.
ISO/IEC 27001 (retrieved 2026-08-29) is the reminder that an events source is an information asset. Use it as a control backdrop, not as a score for your last activation number. The weekly pack still ends in the sentence you will say in review.
When to still call an analyst
Call an analyst when the event grain is disputed, when two sources disagree, when the question needs a new definition, or when the result would change compensation or a public claim. Data analysis for product managers does not replace judgment. It replaces the wait for “can someone pull this.”
Gartner Peer Insights — Analytics & BI (retrieved 2026-08-29) is useful texture for how buyers describe that gap. It did not run your last weekly pack.
Independent Product Evidence and Expert Sources
A product team should evaluate an analytics workflow with data and definitions that exist outside the vendor’s demo. Google publishes a documented GA4 obfuscated sample ecommerce dataset (retrieved 2026-08-29) in BigQuery. It contains event-level records suitable for checking event names, dates, users, sessions, and ecommerce actions without exposing a company’s own customers. The BigQuery public datasets documentation (retrieved 2026-08-29) explains the access model and provides a stable starting point for an independent test.
External expert guidance helps define what a credible test should inspect. The UK Government Service Manual’s performance analysis guidance (retrieved 2026-08-29) emphasizes choosing measures around user needs and service outcomes. The W3C Web Performance Working Group (retrieved 2026-08-29) publishes browser-performance specifications, and the OpenTelemetry semantic conventions (retrieved 2026-08-29) document shared names for telemetry. These sources do not endorse InfiniSynapse; they provide independently maintained definitions and measurement practices.
Run a six-part product review:
- Select a fixed public dataset release or date range and record its table, retrieval date, and query scope.
- Predeclare the cohort grain, qualifying event, attribution window, exclusion rules, and expected denominator.
- Write the ship, hold, or investigate decision before viewing the result.
- Save the restated goal, filters, cohort table, and downloadable file from two fresh runs.
- Recalculate one cohort rate outside the generated answer, including both numerator and denominator.
- Ask a product analyst or analytics engineer outside the buying team to compare the two runs and sign the checklist.
A pass requires both runs to retain the same event, cohort boundary, timezone, exclusions, numerator, denominator, and rate. The answer fails if an event label changes silently, internal users enter one denominator but not the other, a seven-day window is incomplete, or a percentage appears without its counts. This test values the relationship between a product decision and its evidence, not the fluency of a narrative.
Independent authority versus endorsement
The Stanford, McKinsey, Gartner, NIST, OWASP, ISO, Google, W3C, UK government, and OpenTelemetry links on this page are research, standards, official documentation, or public test inputs. None of those organizations ran desk log ADR-DPM-20260825, certified the workflow, or supplied a customer testimonial. Their authority is relevant to the cited subject only.
William Zhu’s public GitHub engineering profile makes the author identity inspectable, and the editorial page identifies the internal review functions. Those disclosures establish accountability but are not independent product validation. For a material release decision, involve a reviewer who does not own the vendor selection and require that person to reproduce the cohort arithmetic.
What credible third-party evidence looks like
A useful outside review names the dataset, event definition, cohort dates, exclusions, query or calculation, result, and reviewer. It states whether the reviewer was paid and whether the test used production, sanitized, or public data. A generic quote such as “easy to use” cannot verify an activation rate and should not be presented as evidence for one.
Until a named third party publishes a reproducible evaluation, this page claims only its downloadable first-party desk record and the ability for readers to repeat the public-data protocol. That boundary is narrower than a testimonial, but it is more useful for deciding whether a weekly product number can survive review.
How to Ask One Product Question
Do this on a source you already have. Do not wait for a migration. Data analysis for product managers starts the week the question appears.
Write the weekly decision, not a table name
Bad: “Look at events.” Better: “I need to know whether Tuesday’s release dropped 7-day activation for the same cohort we used last week.” Data analysis for product managers starts when the question would change a ship-or-hold call. If it would not, you are browsing.
Point at an authorized events source
Pick the live warehouse, the product database, or the sanitized export you are allowed to use. If you run data analysis for product managers on a random download from last quarter, you are guessing. If you do not have a live source, upload one export and say so: “This file is a Tuesday snapshot.”
Open the number, then walk into review
Read the filter. Read the cohort window. Open the table. Then write the one sentence you will say out loud. Data analysis for product managers ends in that sentence, not in the chat. If you cannot say the event name out loud, you cannot brief the number.
Recalculate the cohort rate
Recompute the decision-driving rate from its numerator and denominator outside the generated answer. Record timezone, internal-user exclusions, and incomplete-window handling. Stop when the counts do not reconcile.
Save and independently review the pack
Keep the question, source identifier, event definition, cohort filters, table, and recalculation together. When the first question is written, ask it on your own authorized source and keep the file. That is the first data analysis for product managers diagnostic. The weekly pack is repeatable only if the file exists next week.
Desk Sample: Two Passes on One Activation Week
This is a first-party InfiniSynapse desk log of a Thursday review pack, not a named-logo customer case and not an uplift claim. Run ID: ADR-DPM-20260825. Date: 2026-08-25 (Tuesday). Operator: InfiniSynapse Data Team. Attestor: William Zhu. Sources: a Tuesday events extract, 4,820 users last week and 5,010 this week, plus a one-page note that locked activation as first key action in 7 days (internal accounts excluded, same event). Contrast: a warehouse-ticket wait versus a weekly PM question with the event named. Download the same numbers as desk log ADR-DPM-20260825, the aggregate CSV, and the verify script. The script only checks published rows; it is not a third-party audit.
A product manager used data analysis for product managers before a Thursday review: “Did 7-day activation drop after Tuesday’s checkout change, same first-key-action event as last week, excluding internal accounts?” The first pass stayed in a ticket caption. Event named: 0. Cohort filter opened: 0. File opened: 0. That caption is not data analysis for product managers.
The same goal was then walked as objects. The grain was restated as cohort week × event × exclude-internal. The result table showed 18.4% activation this week (922 of 5,010) and 21.1% last week (1,017 of 4,820), with the drop concentrated in one mobile build. Event named: 1. Cohort filter opened: 1. File opened: 1. The PM held the web rollout while the mobile build was checked.
No customer uplift is claimed. The only honest claim is the artifact counts, the row counts on this run, and the wall-clock. The win was a narrower hold, not a hero metric.
| Retrieval state | Event named | Cohort filter opened | File opened |
|---|---|---|---|
| Warehouse ticket wait | 0 | 0 | 0 |
| Weekly PM question | 1 | 1 | 1 |
Wall clock for the successful pass was about six minutes (warehouse time excluded). The clock started when the operator wrote the standing activation question and ended when the restated grain, the cohort filter, and the file sat in one folder. Cite this table as InfiniSynapse desk log ADR-DPM-20260825. Do not cite it as customer ROI, a bake-off win, or a Wikipedia / Gartner / Stanford / McKinsey experiment. We do not publish named-logo customer cases on this page. The 4,820 / 5,010 users and the 21.1% / 18.4% split are this desk run’s inputs, not a customer extract.
Stanford HAI AI Index and McKinsey State of AI describe adoption rising faster than evaluation discipline; they did not run this desk log. Those published surveys are the industry data you may cite for context. They are not a score for this page.
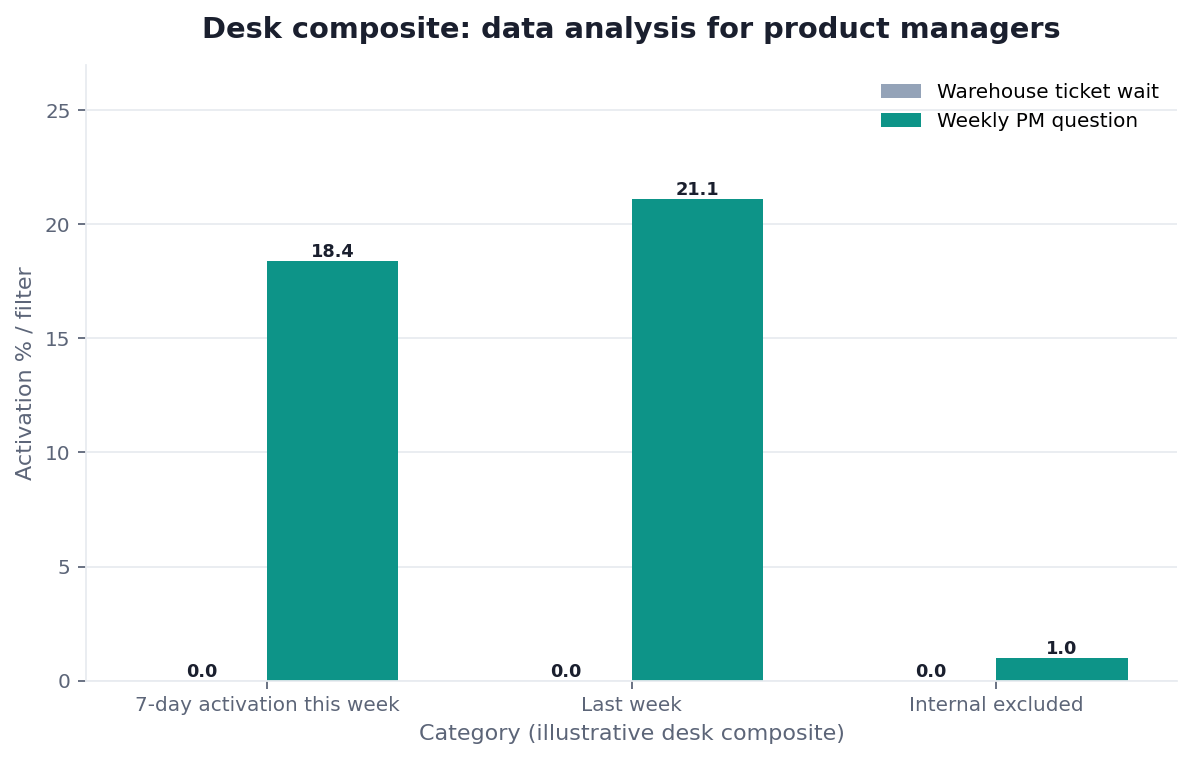
Figure 1. InfiniSynapse desk log ADR-DPM-20260825: warehouse ticket wait left 0 / 0 / 0; weekly PM question left 1 / 1 / 1. Published context: the independent sources linked in the body. Not a customer experiment, SLA, or official benchmark.
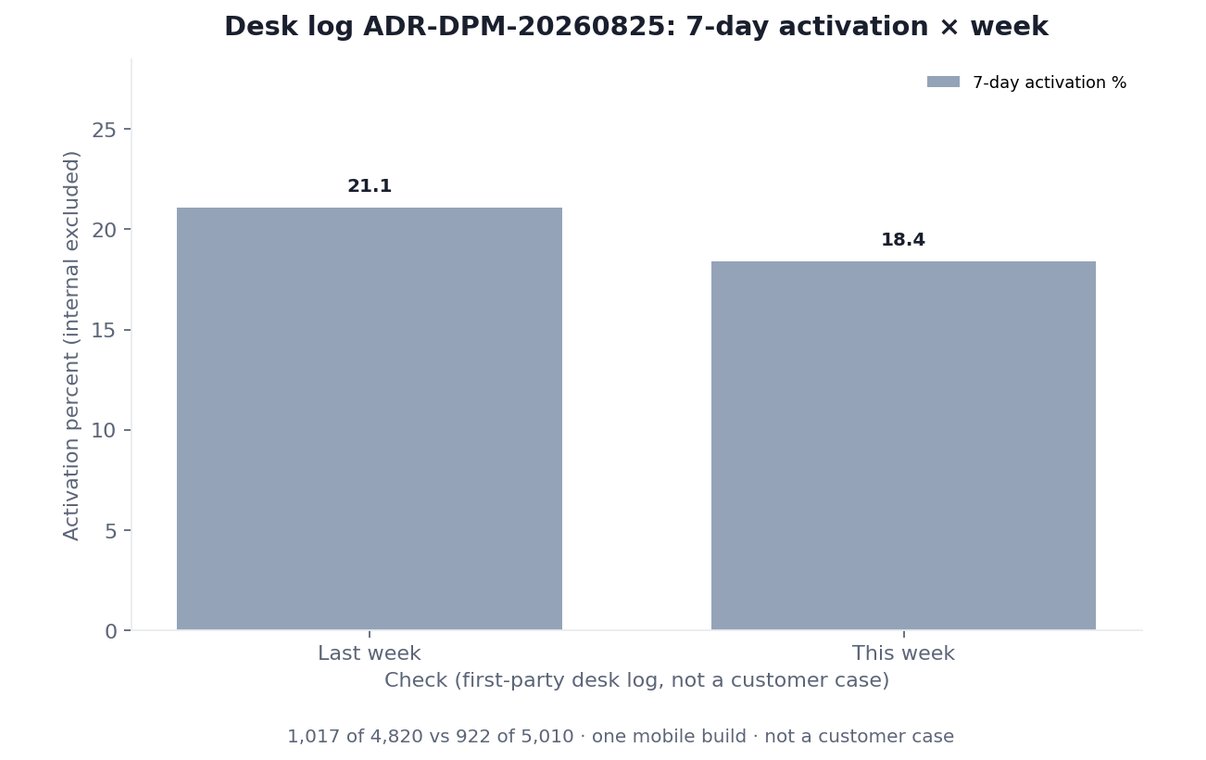
Figure 2. InfiniSynapse desk log ADR-DPM-20260825: 21.1% last week (1,017 of 4,820) versus 18.4% this week (922 of 5,010); drop concentrated in one mobile build. Not a customer experiment, SLA, or official benchmark.
| Evidence class | What you can cite | What you cannot claim |
|---|---|---|
| Desk log on this page | Artifact counts 0/0/0 → 1/1/1, 21.1% vs 18.4% activation, 1,017 / 4,820 vs 922 / 5,010, ~6 min wall-clock, downloadable log | Customer uplift %, vendor bake-off win, named-logo case |
| Published authority (linked above) | Category notes from Wikipedia data quality and column-oriented DBMS; control notes from ISO/IEC 27001, NIST Privacy Framework, and Snowflake Cortex Analyst; adoption and risk from Stanford HAI, McKinsey, Gartner, NIST AI RMF, OWASP | That those sources ran this desk log |
| Homepage recognition | 2026 WAIC Future Tech OPC Excellence Award as published on the company homepage; self-described, not independently verified here | That WAIC, Gartner, or NIST scored this article |
That is data analysis for product managers in a Thursday review. No SQL. No ticket. No invented uplift.
Scorecard: Ready for Review
Use this before you announce that data analysis for product managers is now “self-serve.”
| Check | Pass | Fail |
|---|---|---|
| You can write the weekly decision in one sentence | Ask | You are browsing |
| The activation sentence exists outside the model | Ask | Bind a note first |
| The source is authorized and read-only | Ask | Stop |
| You can open the cohort filter after the answer | Brief | Do not brief |
| You know when to call an analyst | Healthy | You will over-trust |
| You will keep the file, not a screenshot | Repeatable | Folklore |
Data analysis for product managers is ready when four or more rows pass.
Failure Modes Product Managers Hit First
These three show up before any architecture debate.
An activation name nobody locked
“Activated,” “qualified,” and “retained” are not numbers. Data analysis for product managers without a locked event multiplies the fight because more people can now generate a cousin metric in seconds.
A screenshot that cannot be replayed
Someone pastes a funnel into Slack. Next week the event name moved. Data analysis for product managers requires a file and a restated goal, or you cannot rerun.
Asking the warehouse to ship a feature
“Write the new flag into production.” That is not analysis. Data analysis for product managers reads. If you need a write, you need a different system and a different control.
Before you brief a data analysis for product managers number in review, check that you can say the decision, the event, and the source out loud.
Route the same diagnosis to the live guide that owns the next object.
| Live guide | Open it when |
|---|---|
| self-service data analysis for business | you need the business-language method, not only the weekly pack |
| ask data in plain language | the missing object is the meeting sentence |
| data analysis for operators | the object is today’s ops grain |
| Data Analysis for Founders without a Warehouse Team | Five people can ask if the source is already there |
| When to Call an Analyst | Self-serve stops where the grain does not exist |
| First Question to Ask Your Data after Signup | The first question is a grain you already know |
Ask one product question on an authorized source
Connect a source you authorize—or pick a sanitized sample—and ask this week’s activation decision. This check uses only sources you authorize.
Commercial association: You do not need the workspace to complete the educational diagnosis on this page.
Open InfiniSynapseHow this page is sourced. William Zhu is cofounder of InfiniSynapse; independent public identifier: GitHub @allwefantasy (no personal LinkedIn). Institution: About InfiniSynapse. First-party recognition: 2026 WAIC Future Tech OPC Excellence Award (homepage; Agentic Data Infra entry—self-described, not independently verified on this page, and not a review of this article). Trust pages: Privacy · publishing terms · NIST Privacy Framework. Desk methodology note: 2026-07-29 attestation. Downloadable first-party run: desk log
ADR-DPM-20260825· aggregate CSV · verify script. Reviewed by analytics engineering · data platform · LLM security · editor. Editorial standards · corrections. Contact zhuhl@infinisynapse.com. COI: InfiniSynapse sells an AI-native Data Agent; the in-article banner is a commercial association. Fact-check: Stanford HAI AI Index · McKinsey: The state of AI · Gartner Peer Insights — Analytics & BI · NIST AI Risk Management Framework · OWASP Top 10 for LLM Applications · Wikipedia data quality · Wikipedia column-oriented DBMS · NIST Privacy Framework · ISO/IEC 27001 · Snowflake Cortex Analyst · GA4 sample ecommerce dataset · BigQuery public datasets · UK service-manual measuring success · W3C Web Performance · OpenTelemetry semantic conventions · W3C DCAT · DataCite. First-party numbers on this page are desk logADR-DPM-20260825only.
How to cite this page
Page: Zhu, W., & InfiniSynapse Data Team. (2026). Data Analysis for Product Managers: Bind, Then Replay. InfiniSynapse
Run: InfiniSynapse Data Team. (2026). Desk log ADR-DPM-20260825 (sanitized composite)
Neither is an audit. Cite those published artifact counts when you quote data analysis for product managers figures from this first-party desk comparison. As of 2026-08-29, no independent reproduction of this activation contrast exists. DataCite and W3C DCAT stay citable as catalog and citation standards. Stanford, McKinsey, and NIST remain linked only as published context. Keep the desk log, the aggregate CSV, and the verify script beside that citation so a reader can reopen the 0/0/0 versus 1/1/1 contrast without sitting in the original chat thread. Data analysis for product managers citations should name the run ID, not a fluent restatement of a caption. Reopen data analysis for product managers after those files. Name data analysis for product managers quotes. Retain both folders. Open the cohort filter and the result table before you quote 21.1 versus 18.4. Keep the one-page bound note that locked the first-key-action event. A reviewer should restate the standing goal from those files. Name Thursday review contrast, not a fluent restatement of the ticket caption. Send any later contradictions you find after you reopen those two files to zhuhl@infinisynapse.com.
Frequently Asked Questions
Do I need SQL for data analysis for product managers?
Bottom line: No. Data analysis for product managers is the right to ask the weekly decision in plain language. You still need to read a cohort filter and a time window. That is literacy, not engineering.
Is a product dashboard the same as a weekly pack?
Bottom line: No. A dashboard answers questions someone already designed. Data analysis for product managers is for the next question the board cannot answer. Keep the dashboard; do not pretend it is this week’s ask.
What is the first product question I should ask?
Bottom line: Ask a decision you own this week, on a source you already have. “Did activation drop after Tuesday’s release, same event as last week?” is enough. The weekly pack starts there, not with “tell me something interesting.”
When must I stop and call an analyst?
Bottom line: Stop when two sources disagree, when pay or a public claim is in play, or when you cannot restate the event grain. Data analysis for product managers ends at the edge of judgment, not at the edge of curiosity.
How can an external reviewer validate a product metric?
Bottom line: Use a documented public event dataset, predeclare the event and cohort, preserve two fresh runs, and independently recalculate the numerator, denominator, and rate. The reviewer should sign the retained checklist.
Do the cited experts and institutions endorse InfiniSynapse?
Bottom line: No. They provide research, standards, official guidance, documentation, or public data. None is represented as a customer, certifier, or reviewer of this page.
Did Stanford, NIST, or a news outlet recognize this page?
Bottom line: No. Stanford HAI AI Index and the NIST AI Risk Management Framework publish adoption surveys and risk language. They did not evaluate InfiniSynapse. There is no independent award page for this article, no media citation of this PM guide on this page, no professional certification for the author, and there is no personal LinkedIn to add.
Conclusion
Data analysis for product managers is a weekly habit: write the decision, point at an authorized source, open the cohort filter, keep the file. You do not need SQL. You do need the courage to refuse a paragraph you cannot reopen.
Use the scorecard on tomorrow’s review number. If you cannot say the event out loud, you are not ready.