Ecommerce Analytics: Orders, SKUs, and Margin across Sources (2026)
By William Zhu & the InfiniSynapse Data Team · Published: 2026-08-22 · Last updated: 2026-08-31 · Last verified: 2026-08-31 · Next review: 2026-11-30 · About · Privacy policy · Editorial standards · Corrections
Title: Ecommerce analytics across orders, SKUs, and margin sources
Meta Description: Ecommerce analytics joins orders, SKUs, and ads so merchandisers can audit margin, returns, and trading quality without standing up a retail warehouse first.
Slug: ecommerce-analytics
Table of Contents
- TL;DR
- What Ecommerce Analytics Means in 2026
- A Cross-Source Framework for Trading Questions
- How Teams Compare Cross-Source Approaches
- Tool Landscape for Catalog, Orders, and Ads
- Implementation Steps You Can Replay
- Accuracy and Experience Record: Illustrative SKU Margin Pack
- Evidence Boundaries and Independent Validation
- How to Cite This Page
- Selection Scorecard for Ecommerce Analytics
- Failure Modes That Break the Math
- Frequently Asked Questions
- Conclusion
TL;DR
We review order-and-SKU packs at the InfiniSynapse desk on sanitized retail composites; sample figures on this page are illustrative, not customer trading results.
Direct answer: Ecommerce analytics is the practice of joining order facts, catalog keys, and optional ad or marketplace exports so a team can defend SKU margin, return quality, and weekly trading numbers on the sources it already has—without copying every table into a new retail warehouse first.
What you'll learn: a grain-first definition; a cross-source framework; how owned-store tables differ from marketplace dumps; a four-step implementation path; an illustrative desk pack; a scorecard; and the failure modes that silently inflate profit.
Download evidence: desk log · aggregate CSV · verification script · source check · reproduction protocol. This ecommerce analytics package is first-party and illustrative—not merchant, order, customer, benchmark, statistical, or third-party evidence.
Ecommerce analytics fails when revenue lives in one system, cost lives in another, and returns arrive a week late under a different SKU key. The fix is not a prettier chart. It is a locked grain, a bound definition of margin, and a question you can replay.
What Ecommerce Analytics Means in 2026
Key Definition: Ecommerce analytics is the audit of orders, SKUs, and contribution across authorized sources—owned-store tables, marketplace CSVs, and optional ad exports—so margin and returns stay reconcilable. The unit of work is a trading question with inspectable joins, not a slide that hides the catalog key.
Independent published context: U.S. Census retail e-commerce, FTC Mail, Internet, or Telephone Order Merchandise Rule, and U.S. GAO Assessing Data Reliability (retrieved 2026-09-04). They provide official market, fulfillment-rule, and data-reliability context; they did not run or endorse this sample.
IBM augmented analytics, Gartner Peer Insights, and RFC 4180 (retrieved 2026-09-04) provide vendor, market, and CSV context. They do not validate margin or award the product.
Lock identities first: an order line is not a session, a marketplace ASIN is not your SKU, and a paid click is not a sold unit. Shopify guidance, BigQuery, Redshift, Wikipedia CLV, and Google Sheets (retrieved 2026-09-04) are vendor, technical, or general references. None validates the sample values. If the missing object is durable context, continue in self-service data analysis for business. If the next failure is a guarded experiment, use A/B test analysis.
Treat ecommerce analytics as a join problem with business rules attached. If “net sales” sometimes includes tax and sometimes does not, the weekly pack will argue with finance. Bind the rule in a short knowledge-base note before you ask the model to rank SKUs.
Orders, SKUs, and the grain you must lock
Lock three keys before any ranking: order_id, line_id, and the catalog key you will call SKU. A rank of “top products” on mixed grains will double-count kits, bundles, and replacements. Write the exception list—gifts, samples, internal transfers—into the same note that defines margin.
Returns need their own timestamp. A refund posted on Tuesday does not rewrite Monday’s contribution unless your policy says it does. A pack that folds late refunds into the original order week without a lag rule will look healthier than cash.
Why you can start without a retail warehouse
A warehouse is useful when many teams need the same materialized grain every hour. It is not a prerequisite for the first honest pack. If orders already sit in Postgres or MySQL, and the catalog is a second table or a file, you can ask the join in place.
Marketplace teams often receive a CSV each morning. That file is a source, not a reason to delay. Validate quoting and headers against RFC 4180 so a stray comma does not shift the SKU column. Then bind the mapping from marketplace ID to internal SKU.
Ecommerce analytics on files is still analysis. It is not a substitute for inventory planning systems, and it does not write back to the store.
A Cross-Source Framework for Trading Questions
Use one table as the contract for ecommerce analytics. Every weekly question should name the grain, the window, and the definition that must not drift.
| Layer | What you lock | Typical source | Failure if skipped |
|---|---|---|---|
| Identity | order_id, line_id, SKU key | Orders + catalog | Bundle double count |
| Money | net sales, COGS, fees, ad spend | Finance export or ledger extract | Margin that finance rejects |
| Quality | return reason, refund lag | After-sales table or CSV | Fake contribution |
| Attention | campaign or marketplace channel | Ads or marketplace events | Spend without a sold unit |
| Narrative | “active SKU”, “marketplace week” | Knowledge-base note | Two teams, two ranks |
Ecommerce analytics does not need a pre-built metric warehouse. It needs those five rows to be explicit. If ad spend cannot join on SKU, report it at campaign grain and say so. Silent allocation is how weekly trading meetings invent profit.
When the same question must be asked by operators who do not write SQL, keep the definitions in the note and the question in plain language. That is closer to a shared ops pack than to a private notebook.
How Teams Compare Cross-Source Approaches
Teams usually pick one of three shapes. Ecommerce analytics quality depends on whether the shape matches the grain they can actually join.
| Approach | Works when | Breaks when |
|---|---|---|
| Warehouse-first retail model | Many consumers, hourly freshness, dedicated modeling | The catalog is still moving and the model lags the store |
| Direct database questions | Orders and SKUs already share keys | Marketplace IDs never land in the same schema |
| File-first weekly pack | Exports are the system of record | Nobody versions the CSV or the mapping file |
Owned-store tables versus marketplace event dumps
Owned-store ecommerce analytics can join orders to catalog on an internal SKU. Marketplace ecommerce analytics often starts from an event dump: impressions, clicks, orders, and returns in separate files. Do not force those events into the store grain until the mapping is signed.
A useful comparison is exploratory data analysis on a sample week before you scale the join. If 12 percent of marketplace order lines have no catalog match, ranking “margin leaders” is fiction.
Weekly packs versus always-on boards
A dashboard that refreshes overnight is fine for traffic. Ecommerce analytics for trading needs a pack you can replay with the same definitions: window, currency, tax treatment, and return lag. Boards that recompute “margin” from whatever column is newest will drift.
If you want a picture, generate data visualization from the same query that produced the table. A chart that cannot name its grain is decoration.
Tool Landscape for Catalog, Orders, and Ads
Buyer shortlists for ecommerce analytics often start on Gartner Peer Insights for Analytics and BI platforms. That market view is useful for procurement. It does not decide your grain.
IBM’s explainer on augmented analytics describes the split this page uses: the machine can draft joins and charts; a human still owns the catalog key and the ship decision for promotions.
Query engines that already hold the facts
If events already land in BigQuery, keep them there. The Google BigQuery documentation is the reference for query jobs and slots, not a mandate to clone the catalog into a second warehouse. Ecommerce analytics on a warehouse-resident order table is still “no new warehouse” if you refuse a second copy.
Teams that already export into Redshift can treat that cluster as the analysis surface. The Amazon Redshift documentation covers clusters, Spectrum, and unload paths. Ecommerce analytics should use a read-only user and never treat the agent as a writer.
A data agent is a fit when the question is a goal (“rank SKUs by contribution after 14-day returns”) and you need the SQL trail. It is a poor fit when someone wants the tool to reprice the store.
File exports when the source is a marketplace CSV
Smaller catalogs live in Excel and morning CSVs. Ecommerce analytics can start there if you freeze the file date and the mapping. Upload a sanitized extract, bind the SKU map, and ask one trading question. Do not paste live credentials into a prompt.
Plain-language questions over those files are closer to chat with your data than to a new ETL project. The acceptance test is still the same: can a second person open the join and get the same SKU rank?
Implementation Steps You Can Replay
Do not begin with a theme. Begin with keys. Ecommerce analytics that starts from “insight” will invent a grain to match the story.
Lock grain and keys
- Name the order grain and the SKU grain in one paragraph.
- List excluded lines: samples, replacements, internal transfers.
- Write the marketplace-to-SKU map or mark it unmapped.
- Choose a currency and a tax rule.
Ecommerce analytics at this step is boring on purpose. If two analysts disagree on whether a bundle is one SKU, stop.
Bind margin and return definitions
Write “contribution” as a sentence: net sales minus COGS minus fees minus allocated ads, or whatever your finance partner will sign. Ecommerce analytics without that sentence will pick a convenient column.
Returns: include a lag window (illustrative default: 14 days) and a reason code list. Bind those notes to the order source so the next run uses the same words.
This is definition work, not a semantic layer product. A short Markdown note is enough if everyone can find it.
Ask the trading question and inspect SQL
Ask one goal: high-return SKUs that still look profitable before lag, or channels where fees erase contribution. Ecommerce analytics quality is the inspectable plan, not the paragraph. Open the joins. Check that refunds did not land on a different key.
If the source is a database, use a read-only role. If the source is a file, record the filename and date in the pack.
Download a pack you can defend
The deliverable is a memo plus a table, not a chat bubble. Ecommerce analytics that lives only in a thread will be re-litigated next Monday. Download Markdown or PDF from the task workspace, keep the SQL with it, and reuse the same goal next week.
Accuracy and Experience Record: Illustrative SKU Margin Pack
The following numbers are an illustrative desk composite, not a customer result or uplift claim. Run ID: ECOM-MARGIN-20260823. Run date: 2026-08-23. Operator: InfiniSynapse Data Team. Objects inspected: order-line and SKU grains, mapping coverage, 14-day return window, six aggregate outputs, held ranking, and held paid-spend action.
| Item | Desk composite (illustrative) |
|---|---|
| Window | 14 days, 2026-07-27 to 2026-08-09 |
| Orders | 18,400 lines across 4 channels |
| Catalog | 1,240 SKUs; 96 marketplace IDs unmapped |
| Question | Which SKUs show positive contribution before 14-day returns and flip after? |
| Finding | 3 SKUs stay “green” only if refunds are ignored; return rate 8.4% on those SKUs |
| Action | Hold paid spend; do not auto-reorder |
Ecommerce analytics on this pack is useful because the unmapped IDs are visible. A rank that hid the 96 orphans would have looked cleaner and been wrong. If contribution moves next Monday, say whether volume moved or the mapping file did.
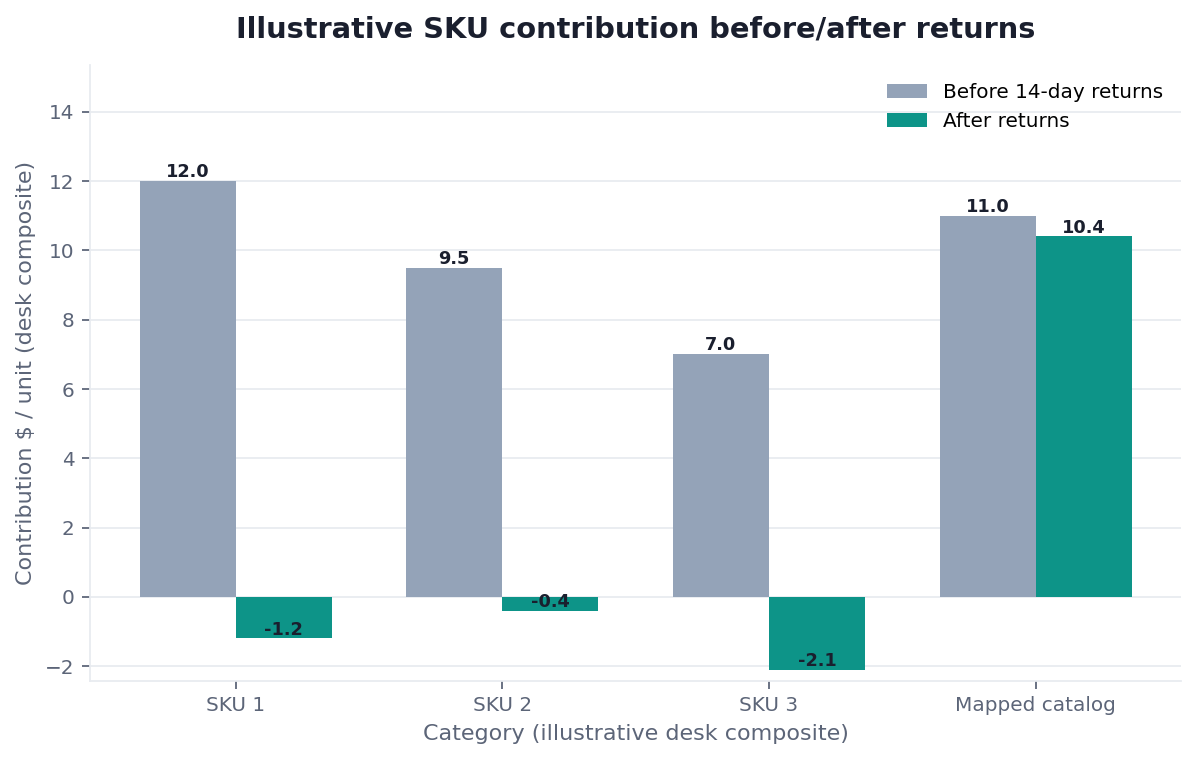
Figure. Illustrative desk composite (category × method). Not a customer experiment, SLA, or official benchmark.
| Evidence class | What you can cite | What you cannot claim |
|---|---|---|
| Desk composite on this page | Grain, collision, inspectable artifacts | Customer uplift %, vendor bake-off win |
| Published authority (linked above) | Frameworks and definitions from the cited sources | That those sources ran this desk sample |
Desk composite: 18,400 lines / 1,240 SKUs / 96 unmapped IDs; 8.4% return rate on three flip SKUs. Published context: Shopify, BigQuery, Redshift, Wikipedia CLV, Google Sheets.
The desk log records the decision to hold ranking and paid-spend action. The aggregate CSV exposes six illustrative values and two held actions.
Evidence Boundaries and Independent Validation
The scenario is not merchant, customer, order, return, ad, or accounting data, a representative sample, controlled study, benchmark, or proof of commercial performance. Order rows, SKU identities, contribution amounts, return denominators, mappings, SQL, and reconciliation totals are unavailable; the script verifies displayed outputs only.
The 14-day lag and 95% match threshold are illustrative, not universal standards. Currency, tax, recognition, fees, discounts, return rights, marketplace settlement, and ad-allocation rules vary. Production release requires finance, tax, legal, privacy, security, merchandising, and data-owner approval.
The source check separates public authority from vendor references. The open protocol defines an external test. As of 2026-08-31, no qualifying independent report or quantified customer validation exists.
The released package supports inspection of labels, values, units, and held actions. It does not establish metric validity, margin accuracy, causation, merchant performance, or results elsewhere.
Defensible ecommerce analytics records grain, mappings, formulas, lags, and reconciliation failures. Independent reviewers can challenge ecommerce analytics without endorsing InfiniSynapse. Credible ecommerce analytics publishes corrections.
Reviewers should require dated source extracts, versioned SKU maps, duplicate-key checks, orphan rates, currency tables, refund cutoffs, and signed contribution definitions before any automated trading action.
Ecommerce analytics requires reconciliation. Ecommerce analytics requires mappings. Ecommerce analytics requires cutoffs, ownership, review.
How to Cite This Page
Page: Zhu, W., & InfiniSynapse Data Team. (2026). Ecommerce analytics: Orders, SKUs, and margin across sources. InfiniSynapse. https://infinisynapse.com/en/blog/ecommerce-analytics
Run: InfiniSynapse Data Team. (2026). Desk log ECOM-MARGIN-20260823 (illustrative retail composite). https://infinisynapse.com/blog-media/ecommerce-analytics/downloads/desk-log-ECOM-MARGIN-20260823.md
Neither citation is an independent audit, merchant study, or trading recommendation. Cite the unavailable rows and denominators, 96 unmapped IDs, held actions, and first-party limitation.
Selection Scorecard for Ecommerce Analytics
Score a stack from 1 (weak) to 5 (strong). Ecommerce analytics that cannot inspect SQL should not win on chart quality.
| Criterion | What “5” looks like | Disqualifier |
|---|---|---|
| Grain control | Order line and SKU keys named | Session metrics sold as SKU margin |
| Definition binding | Margin and return lag in a reusable note | “Net sales” changes by teammate |
| Source honesty | Unmapped marketplace IDs listed | Silent inner joins |
| Audit trail | Plan and SQL downloadable | Chat-only answers |
| Write path | Read-only; no store updates | Agent can edit inventory |
| Replay | Same goal next week, same grain | One-off screenshots |
Ecommerce analytics scores well when operators can ask the question and finance can open the join. It scores poorly when the tool promises a metric warehouse you do not have.
Failure Modes That Break the Math
Name the failure before you ship the pack. Ecommerce analytics reviews go faster when the known breaks are on the page.
Promotion double count
A discount in the order line plus a coupon in a second table plus an ad-funded markdown will subtract three times. Ecommerce analytics should pick one promotion source or show the overlap. Illustrative desk rule: if two discount columns are non-null, flag the line; do not auto-sum.
Return lag treated as same-week profit
Same-week contribution looks strong on fashion and electronics until refunds arrive. Ecommerce analytics that books profit on ship date without a lag window will restock the wrong SKUs. State the lag. If you lack return dates, say the pack is ship-basis only.
Marketplace IDs that do not match SKUs
Inner joins drop orphans and make the remaining catalog look healthier. Ecommerce analytics should report match rate. If match rate is under a threshold you set (illustrative: 95 percent), do not publish a SKU rank.
Refuse a blended margin when marketplace payouts and COGS sit in different currencies without a dated rate. Before you open a workspace, write the order grain, the SKU map, the return lag, and whether ad spend can join.
A warehouse-backed weekly loop — RFM, cohorts, funnels, and the serving layer — lives in the ecommerce analytics playbook. Use that page when the grain is already locked and the missing object is the operating metric tree or an ecommerce data platform.
Cluster guides under this hub: Retail Analytics: Store and Digital in One Ask; SKU Margin Analysis across Price and Cost; Order Analysis: Quality, Delay, and Returns; Marketplace Data Analysis across Event Feeds; Inventory and Sales Join without a Planning Suite; Ecommerce Weekly Trading Pack You Can Rerun; Ecommerce Analytics Tools across Order Sources; What Is Ecommerce Analytics beyond Sessions; Ecommerce Analytics Metrics You Can Replay; Ecommerce Data Analytics across Store and Web; Customer Analytics without a Surveillance Pack; Ecommerce Analytics Playbook: Methods and Data Platform.
Related hops: self-service data analysis for business; A/B test analysis; unit economics analytics; AI dashboard generator; chat with your data.
Join orders and SKUs, then ask margin and returns
Connect a read-only order source or upload a sanitized order-and-catalog extract, bind the margin note, and ask which SKUs flip after returns. This check uses only sources you authorize.
Commercial association: You do not need the workspace to complete the educational diagnosis on this page.
Open InfiniSynapseHow this page is sourced. William Zhu is cofounder of InfiniSynapse (GitHub @allwefantasy); no personal LinkedIn, ecommerce/accounting credential, merchant affiliation, or independent auditor role is claimed. His profile establishes authorship, not independent qualification. Desk decisions are recorded in run ECOM-MARGIN-20260823. Reviewed internally by analytics engineering · data platform · LLM security · editor. Editorial standards · corrections · publishing principles. COI: InfiniSynapse sells an AI-native Data Agent. Census, FTC, GAO, IBM, Gartner, Shopify, Google, AWS, and IETF did not validate the run. This is not financial, tax, legal, merchandising, or investment advice.
Frequently Asked Questions
Do I need a retail warehouse before the practice is real?
Bottom line: No. Ecommerce analytics is real when order lines, SKU keys, and a signed margin sentence can be joined and replayed. A warehouse helps when many consumers need the same materialized grain on a schedule. It is optional for the first honest weekly pack on a live database or a dated export.
How should marketplace and owned-store channels share a pack?
Bottom line: Keep them in one pack only after the identity map is explicit. You can show both channels side by side with different grains. Forcing ASINs into internal SKUs without a match rate will invent margin leaders. Report unmapped IDs as a first-class line, not a footnote.
What is a safe first trading question?
Bottom line: Ask which SKUs look profitable before returns and unprofitable after a stated lag. That question forces grain, money, and quality into one table. A pack that starts with “what should we sell more of” will optimize the incomplete join. Keep paid-spend allocation optional until the join key exists.
Can this replace inventory planning or the store admin?
Bottom line: No. Ecommerce analytics explains contribution and return quality on authorized reads. It does not write purchase orders, edit listings, or replace ERP. If a teammate wants automated restock, that is a different system with a different control path. Keep the agent read-only.
Can readers recompute the 8.4% return rate?
Bottom line: No. Return rows and denominators are unavailable. The CSV makes six aggregates and two held actions inspectable, not independently reproducible.
Has an independent retailer reproduced this run?
Bottom line: No qualifying report exists as of 2026-08-31. The protocol defines an external order-to-return test; the script checks first-party outputs only.
Conclusion
Ecommerce analytics is a join you can defend: orders, SKUs, fees, and returns on sources you already operate. Lock the grain, bind the margin sentence, publish the match rate, and refuse ranks that hide orphans. The weekly pack is the product; the chat paragraph is not. When the keys and the lag rule are written, you can ask the same trading question on a read-only source at https://app.infinisynapse.com/.