Ecommerce Analytics Tools across Order Sources
By William Zhu & the InfiniSynapse Data Team · Published: 2026-08-22 · Last updated: 2026-08-31 · Last verified: 2026-08-31 · Next review: 2026-11-30 · About · Privacy policy · Editorial standards · Corrections
Table of Contents
- TL;DR
- What Ecommerce Analytics Tools Must Join
- A Join-First Framework for Tool Choice
- How Teams Compare Tool Shapes
- Tool Landscape across Order Sources
- Implementation Steps You Can Replay
- Accuracy and Experience Record: Illustrative Session Toy versus Join Pack
- Evidence Boundaries and Independent Validation
- How to Cite This Page
- Selection Scorecard for Ecommerce Analytics Tools
- Failure Modes That Keep a Session Toy
- Frequently Asked Questions
- Conclusion
TL;DR
We evaluate these patterns at the InfiniSynapse desk on sanitized composites; sample figures on this page are illustrative, not customer uplifts.
Direct answer: Ecommerce analytics tools are useful only when they join order lines, a catalog key, and a dated cost on sources you already authorize. A stack that ranks sessions and cannot open SKU contribution is a session toy, not a trading pack.
What you'll learn: a join-first definition; a five-layer contract for tool choice; how session products differ from order-source joins; a three-step implementation path; an illustrative desk pack; a scorecard; and the failure modes that keep a pretty chart unreplayable.
Download evidence: desk log · tool-output CSV · verification script · source check · reproduction protocol. This package is first-party and illustrative—not customer, order, vendor-comparison, accounting, benchmark, or third-party evidence.
Ecommerce analytics tools fail when revenue lives in checkout, cost lives in a weekly workbook, and returns arrive under a different key. The fix is not a wider vendor shortlist. It is a locked grain, a bound contribution sentence, and a question you can reopen in /tasks. Pair the method with the hub on ecommerce analytics before you buy another license.
What Ecommerce Analytics Tools Must Join
Key Definition: Ecommerce analytics tools are systems that bind order facts, SKU identity, and optional fee or ad exports so contribution can be inspected and replayed. The unit of work is a signed join on authorized sources, not a session rank that hides whether cost ever entered the query.
W3C RDF 1.1 Concepts (retrieved 2026-09-04) provides identifier and graph-model context. It does not define retail SKU identity or validate this tool comparison.
Use directly relevant analytical controls from U.S. GAO Assessing Data Reliability, the UK Government AQuA Book, and U.S. Census Quarterly Retail E-Commerce methodology (retrieved 2026-09-04). They provide data-reliability, analytical-assurance, and official population/revision examples; none certifies a tool, feature, result, or vendor.
A session is not an order line. A click is not a sold unit. A marketplace ASIN is not your internal SKU. Ecommerce analytics tools start when those identities are written down and reused. If two teams cannot name the same catalog key, they do not have one stack.
Treat the shortlist as a join problem with money rules attached. If “net sales” sometimes includes tax and the cost file never does, bind the rule in a knowledge-base note before you ask any model to rank SKUs.
A tool that cannot join SKU and cost is a session toy
Lock three keys before any demo: order_id, line_id, and the catalog key you will call SKU. Ecommerce analytics tools that only ingest pageviews will produce a conversion story and still miss contribution.
Cost needs a vintage. Last quarter’s average COGS is not this week’s receipt. Ecommerce analytics tools that join today’s selling price to an unnamed blended cost will look precise and be stale. If the vendor cannot show the cost date next to the rank, the product is still a session toy.
Returns need their own timestamp. A refund posted on Tuesday does not rewrite Monday’s contribution unless your policy says it does. Ecommerce analytics tools that fold late refunds into the original order week without a lag rule will restock the wrong SKUs.
Why order sources beat a prettier session board
Owned-store tables, marketplace CSVs, and finance cost files are the sources that pay the bills. Session boards are optional attention. Ecommerce analytics tools should open those order sources first, then decide whether ads can join on SKU.
When the missing object is store versus digital grain, continue in retail analytics. When the missing object is contribution after fees, use SKU margin analysis.
A useful first pass is exploratory data analysis on one sanitized week before you scale a vendor. If 12 percent of lines have no dated cost, ranking “margin leaders” is fiction no matter how the UI looks.
A Join-First Framework for Tool Choice
Use one table as the contract for ecommerce analytics tools. Every weekly question should name the grain, the window, and the money definition that must not drift.
| Layer | What you lock | Typical source | Failure if skipped |
|---|---|---|---|
| Identity | order_id, line_id, SKU key | Orders + catalog | Bundle double count |
| Money | net sales, COGS vintage, fees | Finance export or ledger extract | Margin finance rejects |
| Quality | return reason, refund lag | After-sales table or CSV | Fake contribution |
| Attention | campaign or marketplace channel | Ads or marketplace events | Spend without a sold unit |
| Narrative | “active SKU”, “marketplace week” | Knowledge-base note | Two teams, two ranks |
Ecommerce analytics tools do not need a pre-built metric warehouse. They need those five rows to be explicit. If ad spend cannot join on SKU, report it at campaign grain and say so. Silent allocation is how weekly trading meetings invent profit.
Schema.org documents (retrieved 2026-09-04) describes structured-data documentation, not catalog-key validity. Bind the SKU note to the order source.
How Teams Compare Tool Shapes
Teams usually pick one of three shapes. Ecommerce analytics tools succeed when the shape matches the grain they can actually join.
| Approach | Works when | Breaks when |
|---|---|---|
| Session-first product analytics | Funnel and creative tests on owned web | Cost and returns never enter the event stream |
| Warehouse-first retail model | Many consumers, hourly freshness, dedicated modeling | The catalog is still moving and cost lags a week |
| Direct questions on existing sources | Orders and cost already share keys or dated files | Nobody versions the CSV or the mapping file |
Session products versus order-source joins
Session products are good at “what did people click.” They are poor at “which SKUs flip after fees.” Ecommerce analytics tools in the second class must open order lines, not only events.
IFLA (retrieved 2026-09-04) is a library-sector organization and an analogy only; it does not assess ecommerce software.
If delay and refund quality are the decision, use order analysis. That page owns after-sales grain. Do not import it into a session board and call the result contribution.
Marketplace dumps versus owned-store tables
Owned-store ecommerce analytics tools can join on an internal SKU. Marketplace packs often start from separate files: orders, fees, and returns. Do not force those files into the store grain until the mapping is signed.
A data agent is a fit when the question is a goal (“which SKUs flip after 14-day returns”) and you need the SQL trail. It is a poor fit when someone wants the tool to reprice the store. Ecommerce analytics tools stay on authorized reads.
Tool Landscape across Order Sources
Score the landscape by join honesty, not by chart count. Ecommerce analytics tools that cannot inspect SQL should not win a merchandising bake-off.
Query engines that already hold orders and cost
If orders already sit in Postgres or MySQL and cost is a second table, ask the join in place. Ecommerce analytics tools on a live replica are still “no new warehouse” if you refuse a second copy. Use a read-only role.
DataCite (retrieved 2026-09-04) provides persistent dataset metadata context, not vendor validation. Record extract date and mapping file.
If someone wants a picture, generate data visualization from the same query that produced the table. A chart that cannot name its cost vintage is decoration.
Files when marketplace IDs still live in a morning dump
Smaller catalogs live in Excel and morning CSVs. Ecommerce analytics tools can start there if you freeze the file date and the mapping. Upload a sanitized extract, bind the contribution note, and ask one trading question. Do not paste live credentials into a prompt.
Wikimedia dumps (retrieved 2026-09-04) illustrates dated snapshots, not retail-tool quality. Preserve each marketplace extract without silent overwrite.
Plain-language questions over those files are closer to chat with your data than to a new ETL project. Marketplace fee files still need marketplace data analysis when take-rate is the decision.
Implementation Steps You Can Replay
Begin with the grain. Ecommerce analytics tools that start from “insight” will invent a definition to match the story.
Lock grain, cost vintage, and excluded lines
- Name the order grain and the SKU grain in one paragraph.
- List excluded lines: samples, replacements, internal transfers.
- Write the cost vintage: standard, last receipt, or unknown.
- Choose a currency and a tax rule.
Ecommerce analytics tools at this step are boring on purpose. If two analysts disagree on whether shipping sits inside net, stop.
Bind the contribution note and ask one flip question
Write the contribution sentence and the lag window (illustrative default: 14 days). Bind those notes to the order source so the next run uses the same words. This is definition work, not a productized metric warehouse.
Ask one goal: which SKUs show positive contribution before returns and flip after a stated lag. Ecommerce analytics tools earn the license when the plan and SQL are downloadable. Open the joins. Check that refunds did not land on a different key.
If the source is a database, use a read-only role. If the source is a file, record the filename and date in the pack. Reopen the same task in /tasks next week.
Accuracy and Experience Record: Illustrative Session Toy versus Join Pack
The following numbers are an illustrative desk composite, not a customer result or uplift claim. Run ID: EAT-JOIN-20260823. Run date: 2026-08-23. Operator: InfiniSynapse Data Team. Objects inspected: session rank, order/SKU/cost join, return/fee changes, six aggregates, two held actions, and draft memo.
| Item | Desk composite (illustrative) |
|---|---|
| Window | 14 days, 2026-07-27 to 2026-08-09 |
| Order lines | 18,400 across owned store and one marketplace |
| Session-only rank | 12 “hero” SKUs by add-to-cart; 4 of those have no dated cost |
| Joined question | Which SKUs stay positive only if refunds and marketplace fees are ignored? |
| Finding | 6 SKUs flip after 14-day returns; 2 more flip after fees; 9.4% return rate on the flip set |
| Action | Hold paid spend on the flip set; do not treat the session rank as a reorder list |
Ecommerce analytics tools on this pack are useful because the missing-cost lines stay visible. A session toy that hid the four orphans would have looked cleaner and been wrong.
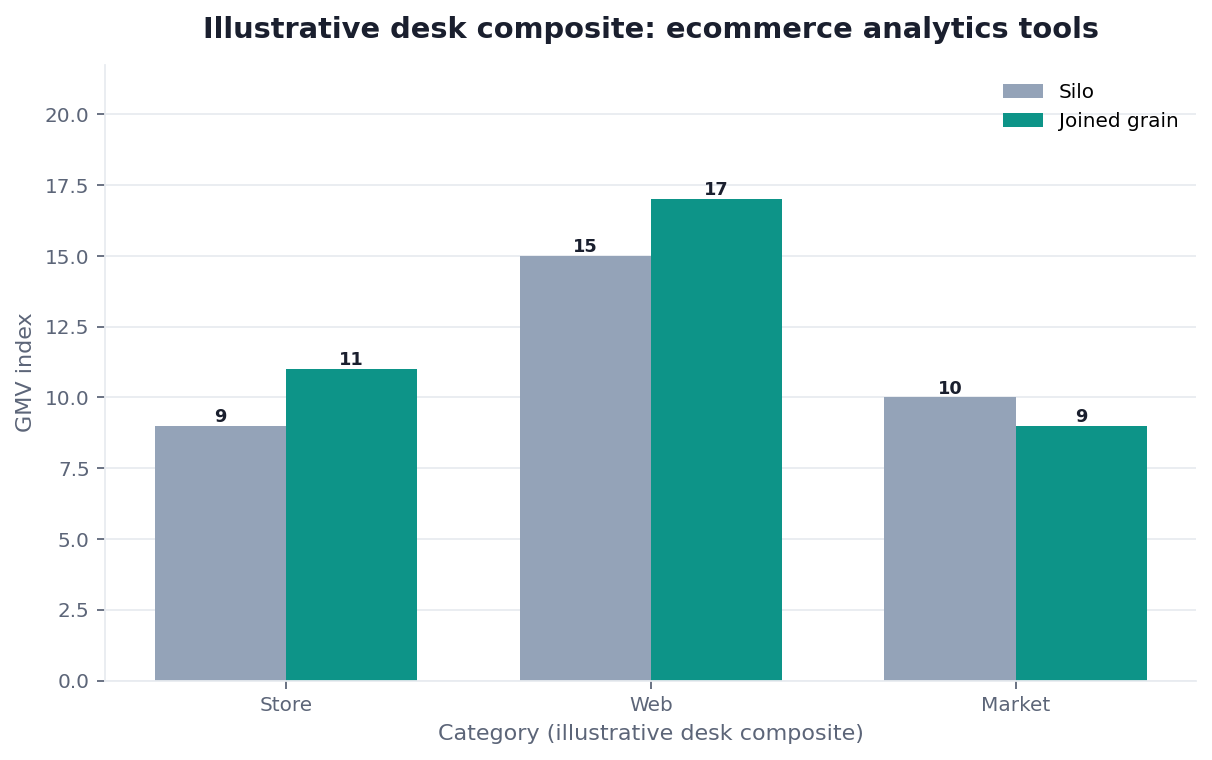
Figure. Illustrative desk composite (category × method). Not a customer experiment, SLA, vendor benchmark, or official statistic.
| Evidence class | What you can cite | What you cannot claim |
|---|---|---|
| Desk composite on this page | Grain, collision, inspectable artifacts | Customer uplift %, vendor bake-off win |
| Published authority (linked above) | Identifier and catalog practice from the cited sources | That those sources ran this desk sample |
The operator rejected session rank as a reorder list. Paid spend and reordering remained held because causal evidence and complete dated cost were unavailable. The desk log records those decisions. The CSV exposes six illustrative aggregates and two held actions.
Evidence Boundaries and Independent Validation
The scenario is not customer, order, vendor-comparison, accounting, campaign, or benchmark data, a representative sample, controlled study, or proof of commercial impact. No named third-party tool was installed, benchmarked, certified, or ranked. Source rows, SKU identities, monetary values, SQL, cost vintages, tool configurations, denominators, and reconciliations are unavailable.
The 18,400 lines do not form a disclosed sampling frame. The 12 ranked SKUs, four missing-cost SKUs, six return flips, two fee flips, and 9.4% return rate cannot be independently recomputed. They must not be generalized to a vendor or retailer.
The source check separates direct official guidance from analogies. The open protocol specifies an external comparison. As of 2026-08-31, no qualifying independent report, customer validation, certification, or media investigation exists.
The output checker confirms displayed labels and values only. It does not establish source accuracy, feature availability, vendor quality, causal impact, accounting treatment, compliance, or performance elsewhere.
Ecommerce analytics tools expose source grain. Ecommerce analytics tools name cost vintage. Ecommerce analytics tools preserve unmapped rows. Ecommerce analytics tools document return lag. Ecommerce analytics tools reconcile totals. Ecommerce analytics tools reveal query logic. Ecommerce analytics tools separate sessions from sales. Ecommerce analytics tools label estimated allocations. Ecommerce analytics tools hold unsupported actions. Ecommerce analytics tools remain independently testable before release.
How to Cite This Page
Page: Zhu, W., & InfiniSynapse Data Team. (2026). Ecommerce analytics tools across order sources. InfiniSynapse. https://infinisynapse.com/en/blog/ecommerce-analytics-tools
Run: InfiniSynapse Data Team. (2026). Desk log EAT-JOIN-20260823 (illustrative retail composite). https://infinisynapse.com/blog-media/ecommerce-analytics-tools/downloads/desk-log-EAT-JOIN-20260823.md
Neither is an independent vendor benchmark, certification, customer study, accounting opinion, or purchase recommendation. Cite unavailable configurations, two held actions, and first-party limitations.
Selection Scorecard for Ecommerce Analytics Tools
Score a stack from 1 (weak) to 5 (strong).
| Criterion | What “5” looks like | Disqualifier |
|---|---|---|
| Grain control | Order line and SKU keys named | Session metrics sold as SKU profit |
| Cost join | Dated COGS or a labeled estimate | Unnamed blended cost |
| Source honesty | Missing cost and unmapped IDs listed | Silent inner joins |
| Audit trail | Plan and SQL downloadable | Chat-only answers |
| Write path | Read-only; no price or listing updates | Agent can reprice the store |
| Replay | Same goal next week, same sentence | One-off screenshots |
Ecommerce analytics tools score well when merchandisers can ask the question and finance can open the join.
Failure Modes That Keep a Session Toy
Name the failure before you ship the pack.
Ranking sessions as if they were sold units
Add-to-cart and checkout starts are attention. They are not contribution. Ecommerce analytics tools that sort the catalog by session events will fund SKUs that never clear fees.
Inner-joining away unmapped marketplace IDs
A silent inner join makes the remaining catalog look clean. Ecommerce analytics tools should print the match rate. If 8 percent of marketplace lines have no internal SKU, publish the orphans.
Cost vintage that nobody can name
An average cost from a closed year will make a newly negotiated SKU look worse than it is, or better. Ecommerce analytics tools should print the cost date next to the rank.
A fourth pattern is currency mix without a dated rate.
Check four things on your own sources before a tool run: the SKU key, the contribution sentence, the cost vintage, and the return lag.
| Live guide | Open it when |
|---|---|
| ecommerce analytics | the missing object is orders, SKUs, and margin across sources |
| retail analytics | store and digital must share a grain |
| SKU margin analysis | contribution after fees is the decision |
| data governance | the contribution sentence must be owned |
Join orders and cost on one authorized grain
Connect a read-only order source or upload a sanitized order-and-cost extract, bind the contribution note, and ask which SKUs flip after returns and fees. This check uses only sources you authorize.
Commercial association: You do not need the workspace to complete the educational diagnosis on this page.
Open InfiniSynapseHow this page is sourced. William Zhu is cofounder of InfiniSynapse (GitHub @allwefantasy); no personal LinkedIn, procurement credential, retailer affiliation, or independent auditor role is claimed. His profile establishes authorship, not vendor-neutral qualification. Desk decisions are recorded in run EAT-JOIN-20260823. Reviewed internally by analytics engineering · data platform · LLM security · editor. Editorial standards · corrections · publishing principles. COI: InfiniSynapse sells an AI-native Data Agent. GAO, the UK Government, Census, W3C, Schema.org, IFLA, DataCite, and Wikimedia did not validate this run. This is not procurement, accounting, financial, legal, retail, marketing, or investment advice.
Frequently Asked Questions
Are session dashboards enough if conversion looks healthy?
Bottom line: No. Ecommerce analytics tools that stop at sessions cannot defend SKU contribution. Join order lines and a dated cost before you treat a conversion rank as a reorder list.
Do I need a retail warehouse before the tools are real?
Bottom line: No. Ecommerce analytics tools are real when order lines, a catalog key, and a signed contribution sentence can be joined and replayed. A warehouse is optional for the first honest weekly pack.
What is a safe first question on a new stack?
Bottom line: Ask which SKUs look profitable before returns and unprofitable after a stated lag. That question forces grain, money, and quality into one table.
Can this replace pricing, ERP, or the store admin?
Bottom line: No. Ecommerce analytics tools explain contribution on authorized reads. They do not write prices or listings. Keep the agent read-only.
Can readers recompute the 18,400-line result?
Bottom line: No. Source rows, configurations, and reconciliations are unavailable. The CSV makes six aggregates and two held actions inspectable, not independently reproducible.
Has an independent buyer benchmarked these tools?
Bottom line: No named third-party tool is ranked, and no qualifying external report is published as of 2026-08-31. The protocol defines a defensible comparison.
Conclusion
Ecommerce analytics tools earn their keep when they join orders and cost on a grain you can reopen. A session toy will keep looking busy. Lock the keys, bind the contribution words, publish missing-cost lines, and refuse ranks that hide orphans. The weekly pack is the product; the chat paragraph is not.
When the keys and the lag rule are written, you can ask the same flip question on a read-only source at https://app.infinisynapse.com/. Download the pack, keep the SQL, and rerun next week with the same definitions.