Data Analysis Process: 6 Steps & Checklist (2026)
By the InfiniSynapse Data Team · Named accountability: cofounder William Zhu (GitHub @allwefantasy) · Last updated: 2026-09-17 · Last verified: 2026-09-17 · Next review: 2026-12-17 · We run end-to-end analytical workflows in production; this guide lays out the process exactly as disciplined analysts follow it—with evaluation criteria and a worked path through all six steps. About / credentials: editorial standards. Company overview: About InfiniSynapse.
Conflict of interest: InfiniSynapse publishes this guide and sells an AI-native analytics product that can automate mechanical middle steps of the data analysis process. The six-step sequence and governance citations below are from desk practice and independent standards—not InfiniSynapse win claims. Corrections: corrections policy.
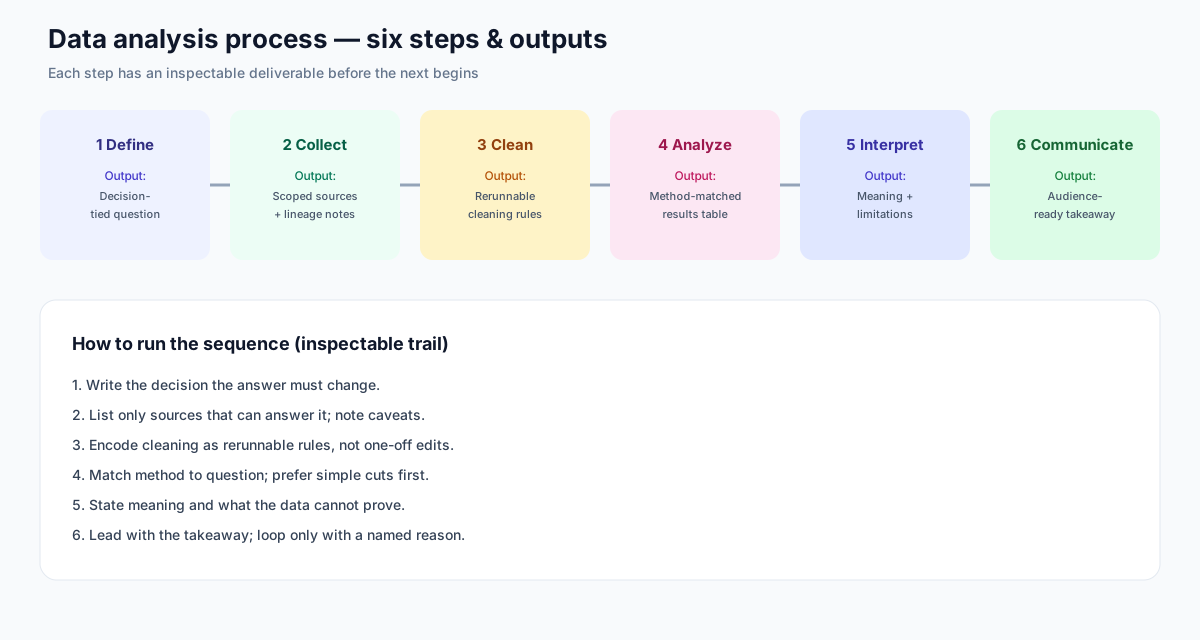
Figure: each stage of the data analysis process produces an inspectable output before the next begins.
Table of Contents
- TL;DR
- How We Evaluated the Six-Step Sequence
- Why a Defined Sequence Matters
- Step 1: Define the Question
- Step 2: Collect the Data
- Step 3: Clean the Data
- Step 4: Analyze the Data
- Step 5: Interpret the Results
- Step 6: Communicate the Findings
- Six Steps Versus Five-Step Maps and CRISP-DM
- Structured Process Versus Ad-Hoc Improvisation
- How AI Changes Process Execution
- Adapting the Sequence to the Task
- The Process as a Loop
- Process Discipline Scorecard
- Common Failures That Skip a Step
- Frequently Asked Questions
- Conclusion
TL;DR
Direct answer: the data analysis process is a repeatable six-step sequence: define the question, collect the data, clean it, analyze it, interpret the results, and communicate the findings. Each step produces an inspectable output before the next begins. Following that sequence deliberately—rather than improvising—is what separates reliable analysis from confident guessing.
Who this is for: anyone who needs a clear, repeatable data analysis process—students learning the steps, analysts running a weekly pack, or a manager who has to judge whether a number is ready to act on.
What you'll learn: how we evaluate the six steps, the artifact each stage must leave, how this map sits next to five-step and CRISP-DM labels, how the sequence compares to ad-hoc work, and how AI changes execution without skipping judgment.
This guide sits within the data analysis complete guide; align the six steps to the shared formal definition before you start Step 1. For the exploration phase inside Step 4, see exploratory data analysis. For methods applied during analysis, see data analysis techniques. A start-to-finish walk sits in a data analysis example.
How We Evaluated the Six-Step Sequence
We assessed the data analysis process the way production teams judge a workflow before trusting it for recurring decisions. Each step was checked for a named failure mode, an inspectable deliverable, scale from a quick question to a high-stakes pack, and whether AI can take mechanical work without skipping judgment.
The Wikipedia overview of data analysis frames the activity as inspecting, cleaning, transforming, and modeling data to surface useful information. That is the academic skeleton. The table below is the operating map we use when a team asks us to recommend a data analysis process they can rerun next Monday.
| Process step | Inspectable output | What good looks like | Common failure |
|---|---|---|---|
| Define | Decision-tied question | Specific ask tied to a choice | Vague goals that cannot be answered |
| Collect | Scoped sources + lineage | Right data documented with source | Downloading everything available |
| Clean | Rerunnable rules + log | Documented choices a peer can replay | One-off manual fixes that drift |
| Analyze | Method-matched results | Method matched to question | Sophisticated technique, wrong question |
| Interpret | Meaning plus limitations | Independent cut confirms the claim | Overclaiming from a single cut |
| Communicate | Audience-ready takeaway | Takeaway first, action named | Technical dump with no action |
| Loop | Named reason to rerun | New questions trigger deliberate reruns | Endless reanalysis without closure |
| Governance | Trail from raw to conclusion | A second person can reopen the path | Black-box numbers stakeholders cannot verify |
Why a Defined Sequence Matters
A defined data analysis process matters because unstructured work wanders, skips steps, and produces unreliable results. The checklist forces a clear question before collection, cleaning before trust, and honest interpretation before communication. Each step guards against a specific failure.
The value of a defined data analysis process is not rigidity but reliability. Experienced analysts internalize the steps so they become second nature, freeing attention for the judgment each stage requires. The same sequence holds for a spreadsheet question and a multi-source investigation.
Step 1: Define the Question
The data analysis process begins with defining a clear, specific question, because a vague question produces a useless answer. "Understand our customers" is not a question; "which customer segment has the highest repeat-purchase rate" is. The precision of that first line shapes everything that follows, determining what data you need and what analysis to run.
Write a decision-tied question
Defining the question well — the highest-leverage move in the whole sequence — also means clarifying why it matters and what decision it will inform. A question tied to a real decision keeps the analysis focused and ensures the result will be used. Analysts who rush past this first step often produce technically competent work that answers the wrong question, wasting the entire effort. Time spent sharpening the question is the highest-leverage investment you will make.
Write the decision in the same sentence as the metric: "If paid social CPL stays above search, we move 20% of next month's budget." If you cannot name the decision, Step 1 of the data analysis process is not done.
Step 2: Collect the Data
The second step of the data analysis process is collecting the data needed to answer the question: identify sources, pull the records, and combine them when the answer lives in more than one system.
Collect the right data, not all data
A key discipline in this step is collecting the right data rather than all available data. More data is not always better; only data that bears on the question matters, and irrelevant columns add noise and effort. When a documented file already measures the decision, start with secondary data analysis before you fund a new collection. Documenting where data came from and any collection caveats is also part of sound analytical practice, since these details affect how results should be interpreted later.
The inspectable output of this step in the data analysis process is a short source list: system, grain, date window, and one caveat a reviewer would otherwise have to guess.
Step 3: Clean the Data
Cleaning is the step of the data analysis process that consumes the most time and prevents the most errors. Raw data is messy: duplicates, inconsistent formats, missing values, and outright mistakes. The cleaning step resolves these so analysis rests on trustworthy input, because analyzing dirty data produces confident but wrong conclusions.
Encode cleaning as rerunnable rules
Effective cleaning involves removing duplicates, standardizing categories, fixing data types, and deciding deliberately how to handle missing values. Each decision should be documented, since how you clean shapes results. Many analysts underestimate this step, but experienced practitioners know that most analytical work is preparation—and a rushed cleaning stage undermines everything built on top.
A one-off spreadsheet edit is not a cleaning log. If a second person cannot replay the rule, this step of the data analysis process did not finish.
Step 4: Analyze the Data
With clean data ready, the data analysis process moves to analysis itself: examining data to answer the question. This may involve calculating summaries, comparing groups, identifying trends, or applying statistical methods, depending on what the question requires. This is the step people picture when they think of analysis, though it depends entirely on preparation before it.
Match the method to the question
A principle of this step is to match the method to the question rather than reaching for the most sophisticated technique. Often a simple comparison answers better than an elaborate model. Exploratory data analysis frequently precedes formal work within this step, helping you understand data before drawing conclusions. Use when Step 4 is a forecast for validation and leakage checks. The families you pick live in data analysis methods; the data analysis process only decides that the method must answer the Step 1 question.
Practical example: a five-person marketing team runs the data analysis process weekly on campaign performance. They define the question—"which channel delivered the lowest cost per qualified lead last month?"—pull warehouse exports for spend and CRM conversions, clean duplicate UTM tags, group by channel, and compare cost per lead. Interpretation surfaces paid social underperforming search by 34% on the metric that matters to budget allocation. They communicate a one-slide takeaway to leadership and reallocate twenty percent of spend—recovering roughly $18,000 in quarterly waste on that desk composite. Treat those figures as an illustrative desk run, not a customer SLA. The outcome-focused loop matches Harvard Business Review's skills-based hiring research on demonstrated analytical impact over activity metrics alone.
Step 5: Interpret the Results
Interpretation is the step of the data analysis process where results become meaning. A number by itself says nothing; interpretation decides what it implies for the question and whether it makes sense. This step demands judgment: is the finding real or an artifact, does it answer the question, and what are its limitations?
State meaning and limits
Honest interpretation means checking results against intuition and independent cuts, and resisting the temptation to overstate a finding. If a result surprises you, that is a cue to verify rather than celebrate. Acknowledging what the data cannot say is as important as reporting what it can. This interpretive judgment is the part of analytical work that machines cannot fully replicate.
Write two sentences before you build a slide: what the number means for the decision, and what would falsify it. That pair is the Step 5 output of the data analysis process. A rising number is not automatically a trend in data—separate lasting direction from seasonality and noise in What Is Trend in Data? vs Seasonality.
Step 6: Communicate the Findings
The final step of the data analysis process is communicating findings so others can act on them. Lead with the takeaway, choose visuals that clarify, and state the decision implication. Tailor language to the audience and keep uncertainty visible. If listeners cannot name the action after one minute, Step 6 of the data analysis process is not done.
Six Steps Versus Five-Step Maps and CRISP-DM
Search results for the same data analysis process often show five steps (ask, prepare, process, analyze, share) or six (those five plus act). The CRISP-DM standard uses a different six: business understanding, data understanding, data preparation, modeling, evaluation, and deployment. None of those maps contradict this page. They fold interpretation into analyze or share, and they fold "act" into communication or a later operations handoff.
| Label on this page | Common five-step label | CRISP-DM neighbour |
|---|---|---|
| Define | Ask | Business understanding |
| Collect | Prepare | Data understanding |
| Clean | Process | Data preparation |
| Analyze | Analyze | Modeling |
| Interpret | (folded into Analyze or Share) | Evaluation |
| Communicate | Share / Act | Deployment |
Keep one map per team. This data analysis process names Interpret because that is where silent failures hide: a correct table attached to the wrong claim. If a course uses Ask / Prepare / Process, map those words onto Define / Collect / Clean. Do not run two sequences in parallel.
Structured Process Versus Ad-Hoc Improvisation
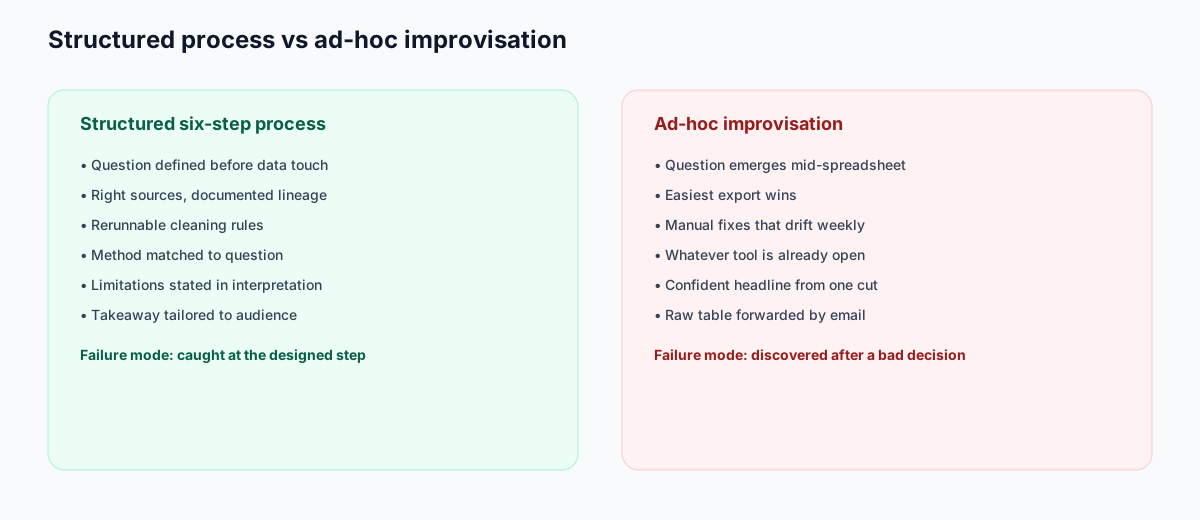
Teams evaluating the data analysis process sometimes improvise successfully on small questions—and fail silently on larger ones. The table below contrasts following the sequence deliberately versus ad-hoc improvisation.
| Dimension | Structured six-step process | Ad-hoc improvisation |
|---|---|---|
| Question clarity | Defined before data touch | Emerges mid-spreadsheet |
| Data scope | Right sources, documented | Whatever was easiest to export |
| Cleaning | Rerunnable, auditable rules | Manual fixes that drift weekly |
| Method choice | Matched to question | Whatever tool is already open |
| Interpretation | Limitations stated | Confident headline from one cut |
| Communication | Takeaway tailored to audience | Raw table forwarded by email |
| Recurring work | Faster on second run | Rebuilt from scratch each cycle |
| Failure mode | Caught at the step designed to catch it | Discovered after a bad decision |
The data analysis process is not bureaucracy—it is insurance against predictable errors. Ad-hoc work can succeed once; the structured sequence succeeds reliably, especially when the same question returns monthly.
How AI Changes Process Execution
In 2026, AI-native tools are transforming how the data analysis process is executed, automating mechanical steps while leaving judgment-heavy ones to humans. An agent can handle much of collection, cleaning, and standard analysis—carrying a defined question through the mechanical middle of the workflow with an inspectable trail.
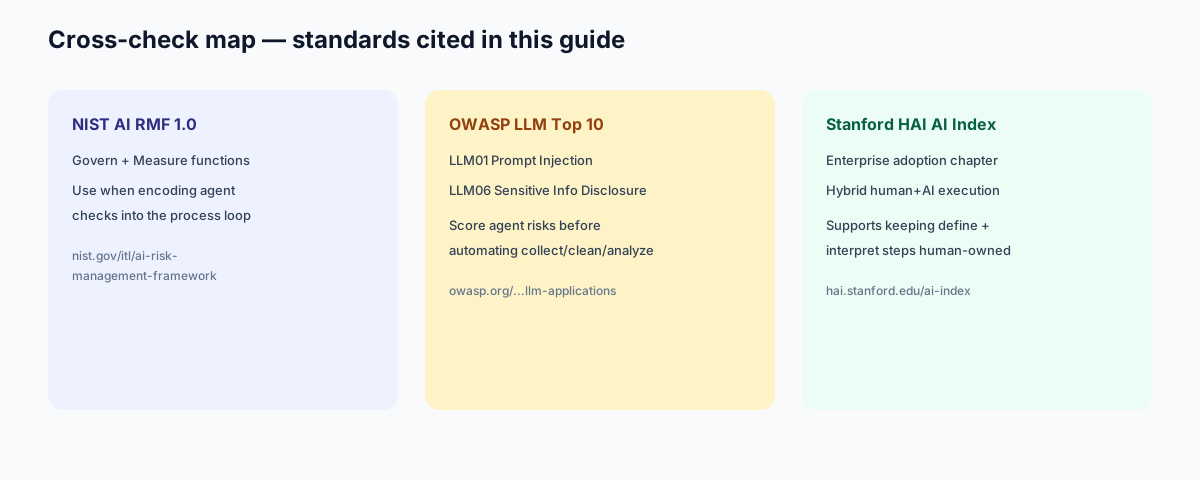
The human still defines the question and interprets the result, but the mechanical middle is automated, dramatically speeding recurring work. IBM's augmented analytics overview describes verification as essential: check row counts, sanity-check totals, and rerun on a held-out slice before trusting agent output. The Stanford HAI AI Index (see the enterprise adoption chapter in the latest AI Index report) documents how quickly organizations adopted this hybrid execution model. The six steps remain; how much a machine carries changes.
When agents touch collect, clean, or analyze in the data analysis process, map controls to the NIST AI Risk Management Framework AI RMF 1.0 Govern and Measure functions, and score agent-specific risks against OWASP Top 10 for LLM Applications items LLM01 (Prompt Injection) and LLM06 (Sensitive Information Disclosure).
Enterprise adoption patterns in Google Cloud's AI overview mirror the shift from pilots to governed analytical workflows where the six-step workflow is encoded once and rerun with human oversight.
Adapting the Sequence to the Task
The six steps of the data analysis process stay constant; their weight does not. A low-stakes question might spend moments on each stage. A high-stakes pack feeding a major decision warrants more time on cleaning and interpretation. A questionnaire export uses the same sequence with different weight: survey analytics spends the hours on cleaning, question-type summaries, one cross-tab, and open-text coding before the readout.
Low-stakes versus high-stakes weight
Adapting the data analysis process means reading the stakes honestly. Familiar data lightens cleaning; new or messy data dominates it. Exploratory questions spend more time in examination; confirmatory work spends it in interpretation. Never skip a step entirely.
The grouped bars below come from an InfiniSynapse desk composite: twelve weekly campaign questions and four quarterly packs on sanitized extracts. Cleaning stayed the heaviest step at both stakes. High-stakes work moved clock time into define and interpret. Treat the shares as illustrative, not a staffing SLA.
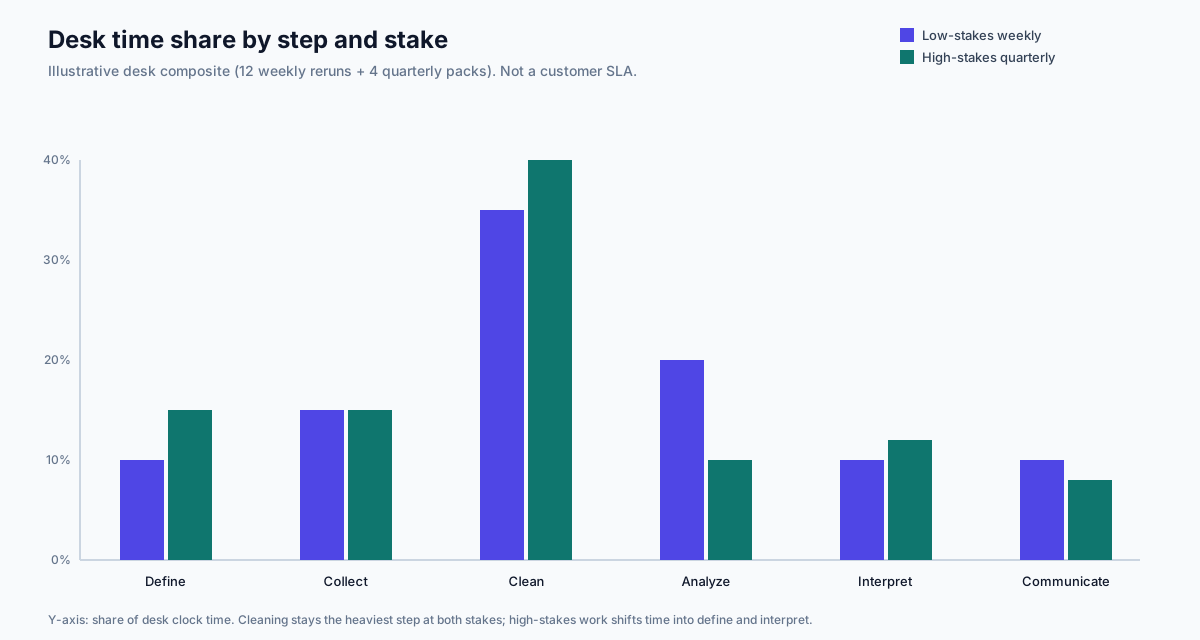
| Step | Low-stakes weekly share | High-stakes quarterly share |
|---|---|---|
| Define | 10% | 15% |
| Collect | 15% | 15% |
| Clean | 35% | 40% |
| Analyze | 20% | 10% |
| Interpret | 10% | 12% |
| Communicate | 10% | 8% |
The Process as a Loop
In practice the data analysis process is a loop, not a straight line. Interpretation raises new questions, a finding can expose a weak Step 1, and another pass is normal.
Treat the data analysis process as a loop: follow new questions with a named reason for each pass, and stop when the answer is solid enough for the decision at hand.
Process Discipline Scorecard
Assess your data analysis process discipline (1 point each):
| Check | Pass? |
|---|---|
| I define a specific question first | |
| I collect the right data, not all data | |
| I clean before analyzing | |
| I match method to question | |
| I interpret with honest judgment | |
| I communicate clearly to the audience | |
| I document decisions along the way | |
| I follow the steps deliberately |
6–8: disciplined process. 3–5: reinforce one step from the evaluation table. Below 3: adopt the full six-step sequence on the next real question.
Common Failures That Skip a Step
Three patterns show up whenever a team says they "already know the process" and still ship a bad number.
Starting in the warehouse. Collection without a decision-tied question produces a wide extract and a late rewrite of Step 1. A data analysis process that starts with a login is already off the rails.
Cleaning in the chart. Color and aggregation hide duplicates. If the cleaning log is empty, the chart is a draft.
Skipping interpret. A correct table forwarded by email is still ad-hoc work. The sequence is unfinished until someone states what the number means and what would falsify it.
Frequently Asked Questions
What are the six steps?
In the data analysis process, the six steps are define the question, collect relevant data, clean it into trustworthy form, analyze with appropriate methods, interpret results with honest judgment, and communicate findings clearly. Following this sequence deliberately separates reliable analysis from improvised guessing.
Which step typically takes the most time?
Cleaning usually takes the most time in a working data analysis process. Raw data contains duplicates, inconsistent formats, missing values, and errors that must be resolved before analysis. On the desk composite above, cleaning took 35–40% of clock time.
How does this compare to the five-step process?
Five-step maps (ask, prepare, process, analyze, share) cover the same data analysis process. Ask is Define, prepare is Collect, process is Clean, and share is Communicate. This page names Interpret separately so a correct table cannot skip the claim. Act, when a course lists it as a sixth step, sits after Communicate as the decision the takeaway was written to change.
How do analyze and interpret differ?
The analyze step examines data to produce results such as summaries or comparisons. The interpret step decides what those results mean for the question and whether they make sense. Analysis produces numbers; interpretation turns them into meaning through judgment.
How do AI tools change execution?
AI-native tools speed the mechanical middle of the data analysis process—collection, cleaning, and standard analysis—while humans still define the question and interpret the outcome.
Conclusion
The data analysis process is a repeatable six-step sequence—define, collect, clean, analyze, interpret, communicate—and following it deliberately is what makes analysis reliable rather than lucky. Each step guards against a specific failure and leaves an inspectable output. In 2026 AI-native tools automate mechanical work while humans supply the question and judgment.
To see the process automated end to end with an inspectable trail, read the complete data analysis guide and what AI-native data analysis means. Platform catalog and quality-SLA shifts that sit around the six steps are in data management trends. Then try the InfiniSynapse web app free on registration.