Data Method: How to Choose the Right Analysis
By William Zhu & the InfiniSynapse Data Team · Published: 2026-07-09 · Last updated: 2026-09-24 · About: Editorial standards
Author credentials: William Zhu is an InfiniSynapse cofounder and open-source data builder (GitHub @allwefantasy). This guide uses a reproducible question-to-method decision framework and a worked retention example; it does not claim that one method is universally best.
Commercial interest: InfiniSynapse sells an AI-native data analysis platform. The collection, analysis, assumption, and validation guidance below is tool-independent. Product context is isolated near the end.

SEO Title: Data Method: How to Choose the Right Analysis
Meta Description: Match data collection and analysis choices to question, data type, sample, assumptions, and decision with this data method guide and worked example.
Slug: /blog/data-analysis-methods
Target keyword: data method
Table of Contents
- TL;DR
- What Is a Data Method?
- Collection Methods vs Analysis Methods
- Primary and Secondary Data Methods
- Quantitative, Qualitative, and Mixed Methods
- Match the Method to the Question
- Worked Example
- Method, Methodology, Technique, and Tool
- Check Assumptions Before Trusting Results
- How AI Can Apply a Data Method
- Frequently Asked Questions
TL;DR
Direct answer: A data method is a systematic way to collect, prepare, or analyze data. Choose the collection method first, then select an analysis method that matches the question, data type, sample, assumptions, and decision. The simplest valid method is usually better than a sophisticated method that answers the wrong question.
The phrase is broad. A survey is a data collection method; regression is a data analysis method; a mixed-method study deliberately combines numerical and qualitative evidence. Those activities belong in one chain, but they are not interchangeable.
Use this guide when you need to move from “we have a question” to an evidence-backed conclusion. For the full sequence around that decision, see the data analysis process. For lower-level procedures such as chart selection and transformations, use the data analysis techniques guide.
This data method guide keeps each stage visible so the final claim can be traced back to its source.
What Is a Data Method?
A data method is a repeatable procedure for obtaining or examining evidence. It should state what is measured, where the data comes from, how observations are selected, how records are transformed, which analytical logic is applied, and how the result will be checked.
That definition is wider than “run a statistical model.” If the customer sample excludes people who cancelled, no regression can repair the collection bias. If interview coding has no explicit categories, a polished theme chart is not reproducible. Method quality begins before analysis.
Three questions establish scope:
- Collection: How will observations enter the dataset?
- Analysis: What operation will answer the research or business question?
- Validation: What evidence could reveal that the conclusion is wrong?
The UK Data Service guidance on research data explains why documentation and provenance must travel with the data, not be reconstructed after the result.
Collection Methods vs Analysis Methods
SERP results for “data method” mix collection and analysis because searchers often need both. The distinction is practical:
A complete data method separates these stages so that a collection choice is not mistaken for analytical proof.
| Stage | Method examples | Produces | Main failure risk |
|---|---|---|---|
| Collection | Survey, interview, observation, experiment, sensors, transaction logs | Raw observations | Coverage, response, measurement, or selection bias |
| Preparation | Validation, coding, deduplication, joining, imputation | Analysis-ready records | Leakage, silent exclusions, changed meaning |
| Analysis | Descriptive statistics, inference, regression, clustering, thematic analysis | Estimates, patterns, themes, predictions | Invalid assumptions or wrong question fit |
| Validation | Holdout testing, sensitivity analysis, triangulation, peer review | Confidence limits and failure evidence | Confirming only the preferred result |
A collection method does not determine the analysis automatically. Survey responses can be summarized descriptively, compared inferentially, or coded thematically. Transaction logs can support cohorts, time-series models, experiments, or anomaly detection.
Surveys and questionnaires
Use surveys when the variables can be expressed as consistent questions across many respondents. Define the sampling frame, wording, response options, and treatment of non-response before launch. The Pew Research Center survey methodology illustrates how sampling and mode affect what survey estimates mean.
Interviews, focus groups, and observation
Use interviews when context, motives, or language matter more than standardized counts. Focus groups surface interaction and shared vocabulary but can amplify dominant voices. Observation is valuable when reported behavior and actual behavior may differ.
Experiments and operational records
Use experiments when you can assign an intervention and estimate a causal effect under a defined design. Use operational records when systems already capture events, but document missing events, schema changes, bots, retries, and identity rules. “Automatically collected” does not mean unbiased.
Primary and Secondary Data Methods
Primary data is collected for the current question. Secondary data already exists because someone collected it for another operational or research purpose.
| Choice | Advantage | Limitation | Required check |
|---|---|---|---|
| Primary data | Variables and sample can fit the question | Slower, more expensive, participant burden | Consent, instrument validity, sampling plan |
| Secondary data | Faster access and historical coverage | Definitions may not fit; provenance may be incomplete | Original purpose, coverage, revisions, license |
A primary data method is appropriate when the required variable does not exist, the population is reachable, and the decision justifies new collection. A secondary method is appropriate when an existing dataset has compatible definitions and sufficient provenance.
Choosing a data method therefore includes deciding whether existing evidence can support the claim before commissioning new collection.
The U.S. Census Bureau data methodology is a useful model for checking definitions and source context before treating a public table as a universal fact. For a dedicated reuse checklist, read secondary data analysis.
Do not call web-accessible data “open” without checking its license and collection context. Public availability, legal reuse, population coverage, and analytical suitability are separate questions.
Quantitative, Qualitative, and Mixed Methods
Once the evidence source is defined, classify the analysis by the kind of claim you need.
The analysis half of a data method should begin only after the source, unit, population, and measurement rules are explicit.
Quantitative methods
Quantitative methods operate on numerical or consistently coded variables. Common families include:
- Descriptive statistics: summarize the observed dataset with counts, rates, distributions, and robust summaries.
- Inferential statistics: estimate population quantities or test hypotheses from a sample while representing uncertainty.
- Regression: estimate conditional relationships between an outcome and one or more predictors.
- Time-series analysis: model temporal structure, trend, seasonality, and forecast uncertainty.
- Clustering: search for groups based on a declared distance, representation, and validation criterion.
- Predictive modeling: estimate future or unknown outcomes and test generalization on unseen data.
The American Statistical Association statement on statistical significance is an important reminder that a threshold does not measure effect size, practical importance, or the probability that a hypothesis is true.
Qualitative methods
Qualitative methods analyze language, observation, documents, images, or experience. Thematic analysis develops and reviews patterns of meaning; content analysis applies explicit coding categories; grounded approaches develop concepts iteratively from evidence.
Good qualitative work is not a collection of convenient quotations. It needs a documented corpus, coding procedure, reflexive decisions, counterexamples, and a clear relationship between evidence and claim. For deeper implementation, use the qualitative data analysis guide.
Mixed methods
Mixed methods combine quantitative and qualitative evidence for a reason. A team might identify a retention decline in event data, estimate which segments changed, and interview selected customers to explain the mechanism.
The integration point must be explicit. Decide whether qualitative evidence explains a numerical result, helps design a later survey, or challenges the definitions used in the quantitative dataset. Merely placing a chart beside three quotations is not integration.
Match the Method to the Question
Choose the question family before choosing software:
A defensible data method links one question family to suitable evidence, an analysis approach, and a minimum validation check.
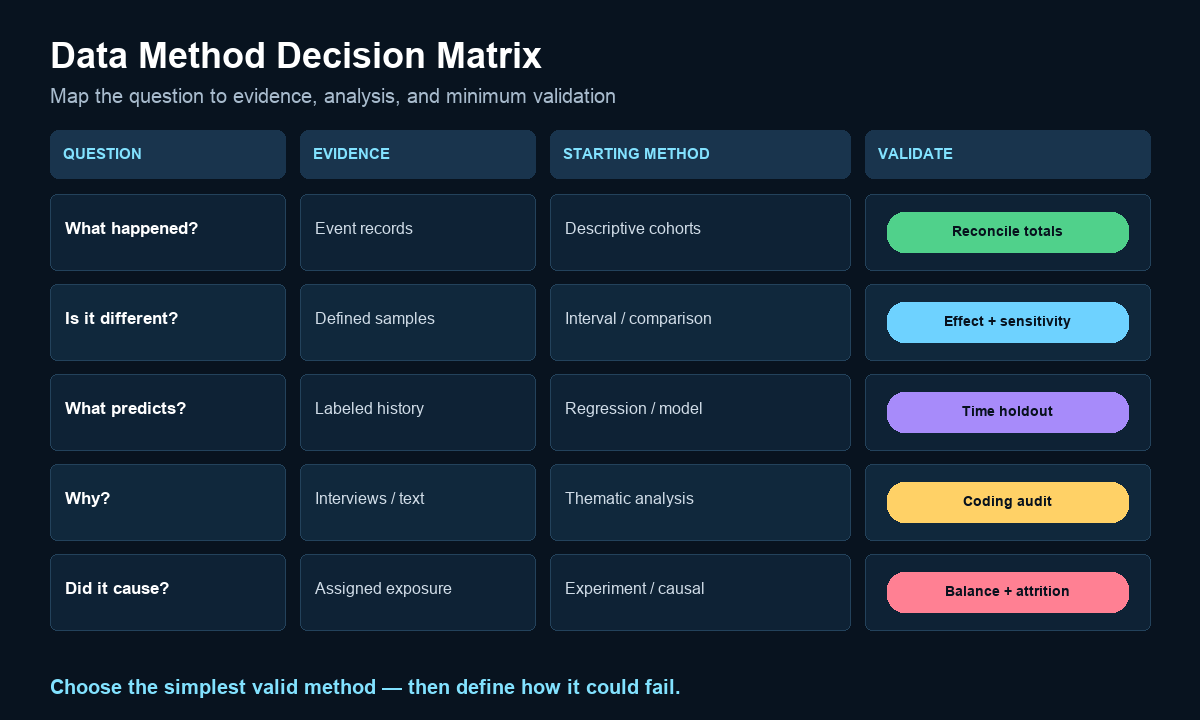
| Question | Suitable evidence | Starting analysis method | Minimum validation |
|---|---|---|---|
| What happened? | Complete event or transaction records | Descriptive statistics and cohorts | Reconcile totals and missing records |
| Is the difference larger than sampling noise? | Defined samples with known selection | Confidence interval or inferential comparison | Effect size, assumptions, sensitivity |
| What is associated with the outcome? | Outcome plus plausible predictors | Regression or stratified analysis | Diagnostics, leakage and confounding review |
| What will happen next? | Time-ordered historical examples | Forecast or predictive model | Time-based holdout and baseline comparison |
| Why did people behave this way? | Interviews, open text, observations | Thematic or content analysis | Coding audit and negative cases |
| Which natural groups appear? | Comparable features across cases | Clustering | Stability and business interpretability |
| Did an intervention cause a change? | Randomized or defensible quasi-experimental design | Experiment or causal estimator | Balance, attrition, pre-analysis rules |
When that comparison has to say how probable a positive effect is, the method is bayesian data analysis. A confidence interval stays in the row above.
Step 1: State the decision
Write what changes if the analysis supports one conclusion rather than another. “Understand customers” is too broad. “Decide whether to change onboarding for first-week self-serve accounts” is actionable.
Step 2: Define the unit and population
Specify whether a row represents a user, account, order, session, interview, or day. Define the population to which the conclusion should apply. Many wrong methods begin with a denominator no one named.
Step 3: Classify the claim
Separate description, association, prediction, explanation, and causation. A predictive model can rank risk without establishing why risk changes. An interview can explain an experience without estimating prevalence.
Step 4: Check feasibility and assumptions
Confirm that the needed variables, sample coverage, time order, and method assumptions are available. Prefer the simplest method that can produce the required claim honestly.
Step 5: Predefine validation
Choose reconciliation totals, holdouts, robustness checks, coding review, or triangulation before seeing the preferred answer. Validation designed after the result can become justification rather than testing.
This decision framework complements the four types of data analysis, which organizes questions as descriptive, diagnostic, predictive, and prescriptive.
Worked Example: Customer Retention
Suppose repeat purchase rate fell from 31% to 26%. The decision is whether to redesign onboarding, change discount policy, or treat the movement as ordinary variation.
Collection plan
Use transaction records for purchase timing, campaign records for acquisition source, product events for onboarding completion, and purposively selected interviews for context. Define a customer once, establish the observation window, and document refunds and merged accounts.
Analysis sequence
- Reconcile customer and order counts against finance totals.
- Describe retention by acquisition cohort, product, geography, and onboarding completion.
- Estimate uncertainty around the five-point difference.
- Model the relationship between repeat purchase and acquisition source while controlling for cohort and product mix.
- Code interview material for recurring barriers and search for cases that contradict the leading explanation.
Decision evidence
Imagine the decline concentrates among discount-acquired customers who did not complete onboarding, while interviews identify unclear replenishment timing. That evidence supports testing onboarding reminders for that segment. It does not prove discounts caused poor retention; assignment was not randomized.
The value of the worked example is the chain: decision → collection → preparation → analysis → validation → bounded conclusion. Another analyst can inspect each transition instead of receiving an unexplained model output.
This worked data method example also shows why one business question may need several compatible methods rather than one impressive model.
Method, Methodology, Technique, and Tool
These terms overlap in casual writing but answer different questions:
| Term | Meaning | Example |
|---|---|---|
| Methodology | The rationale connecting assumptions, evidence, and research design | Mixed-method design to measure and explain retention |
| Method | The systematic approach used to collect or analyze evidence | Survey, regression, thematic analysis |
| Technique | A specific operation within a method | Bootstrap interval, one-hot encoding, codebook review |
| Tool | Software used to execute or document the work | SQL, R, Python, NVivo, spreadsheet |
Software is not the data method. Running k-means in Python does not establish that clustering answers the business question, that the features are comparable, or that the clusters are stable. Choose the logic first, then the implementation.
Check Assumptions Before Trusting Results
Every method limits the claims it can support.
A data method remains provisional until its assumptions and likely failure modes have been checked against the actual evidence.
- Sampling: Who had a chance to appear, and who is absent?
- Measurement: Does the variable represent the concept consistently?
- Independence: Are observations repeated, nested, or connected?
- Time: Could later information have leaked into an earlier prediction?
- Missingness: Why is a value absent, and is absence related to the outcome?
- Model form: Would a nonlinear, heterogeneous, or time-varying pattern invalidate the estimate?
- Qualitative reflexivity: How did researcher position and coding choices shape themes?
For predictive methods, scikit-learn's model evaluation documentation distinguishes metrics from validation design. A high score on a leaked or unrepresentative split is not useful evidence.
Report uncertainty and limitations beside the finding. Do not hide them in an appendix after stakeholders have acted.
How AI Can Apply a Data Method
AI can profile a table, suggest candidate methods, draft SQL or Python, summarize model diagnostics, and help organize qualitative coding. It can also select the wrong unit, invent a column meaning, leak future information, or describe association as causation.
Require an inspectable method card:
| Field | Required entry |
|---|---|
| Decision | What action the result informs |
| Unit and population | What each row means and who the claim covers |
| Sources | Tables, files, interviews, collection dates |
| Method | Collection, preparation, and analysis steps |
| Assumptions | Conditions required for interpretation |
| Validation | Reconciliation, holdout, sensitivity, or coding review |
| Limitations | Claims the evidence cannot support |
The NIST AI Risk Management Framework provides a broader structure for governing AI-assisted decisions. Human review should focus on framing, source meaning, claim scope, and consequential actions—not merely whether generated code runs.
InfiniSynapse is one commercial tool for governed, inspectable analysis; the InfiniSynapse web app can apply workflows across connected data. The same method card should be required regardless of platform.
Frequently Asked Questions
What does data method mean?
A data method is a systematic procedure for collecting, preparing, analyzing, or validating evidence. In context, specify whether you mean a collection method such as a survey or an analysis method such as regression.
Is data collection a data method?
Yes. Surveys, interviews, observation, experiments, sensors, and operational records are data collection methods. They determine what evidence enters the analysis and which populations the result can represent.
What is the simplest data method?
For many questions, a reconciled descriptive summary is the simplest valid starting point. Counts, rates, medians, distributions, and cohorts can answer what happened before a team introduces inference or machine learning.
Which data method should I use for survey results?
Use descriptive statistics for closed-response distributions, inferential methods when generalizing from a defensible sample, and thematic or content analysis for open-text responses. The survey design and sampling frame limit every downstream claim.
Can one study use multiple data methods?
Yes. A mixed-method study may combine operational data, a survey, interviews, statistical comparison, and thematic analysis. State why each method is needed and how the findings will be integrated.
Conclusion
A data method is not a software feature or a fashionable model. It is the explicit chain from question and evidence to analysis, validation, and decision.
Start by separating collection from analysis. Define the unit and population, classify the claim, select the simplest valid approach, and decide how the result could fail. Quantitative, qualitative, and mixed methods then become choices you can justify rather than a list to memorize.
That discipline turns a data method into an auditable decision path instead of a label attached after the result.
For the larger learning path, continue with the complete data analysis guide or compare concrete operations in data analysis techniques.