A Data Analysis Example, Start to Finish (2026)
By the InfiniSynapse Data Team · Last updated: 2026-07-10 · We build an AI-native data analysis platform and run analyses like this in production; this worked example follows the full process on a realistic question with inspectable SQL and metrics.
Table of Contents
- TL;DR
- How We Evaluated This Worked Example
- The Scenario
- Step 1: The Question
- Step 2: The Data
- Step 3: Cleaning
- Step 4: The Analysis
- Step 5: Interpretation
- Step 6: The Recommendation
- Reproducible SQL and Sample Output
- Example Compared to the Standard Process
- How AI Would Run This Example
- Lessons From This Example
- Trying a Similar Example Yourself
- Example Scorecard
- Frequently Asked Questions
- Conclusion
TL;DR
Direct answer: this data analysis example works a realistic question, why an online store's repeat purchases fell, through the full six-step process to an actionable recommendation. It shows how a question becomes data, cleaning, analysis, interpretation, and finally a decision, making the abstract process concrete.
Who this is for: anyone who learns best from a worked data analysis example rather than abstract description.
What you'll learn: how we evaluated this example, every step of the process from framing the question to delivering a recommendation, comparison to the standard process, and how AI would run it.
This guide sits within the data analysis fundamentals hub; for multiple examples across industries, see data analysis examples. For related depth in this pillar, see Exploratory Data Analysis (EDA). For the same case next to six other data analysis examples mapped to technique, use the techniques-with-examples guide.
How We Evaluated This Worked Example
We constructed this data analysis example using criteria that mirror what makes a worked case genuinely instructive, not a tidy textbook fiction. Each step was checked against four dimensions: whether it reflects realistic data messiness, whether the analyst makes visible judgment calls, whether the techniques match the question without over-engineering, and whether the recommendation is actionable and honestly bounded by limitations.
We cross-referenced the underlying process with the Wikipedia overview of data analysis, which frames analysis as inspecting, cleaning, transforming, and modeling data to surface useful information. We aligned the workflow with the six-step process described in the data analysis process. For occupational context we referenced the Bureau of Labor Statistics profile for data analysts and hiring-trend data from LinkedIn's 2025 Future of Recruiting report, which notes that portfolio evidence and demonstrated outcomes increasingly influence hiring alongside formal credentials.
The table below summarizes the evaluation dimensions we apply when judging whether a data analysis example teaches transferable skill.
| Evaluation dimension | Why it matters in 2026 | What we tested |
|---|---|---|
| Realistic messiness | Clean textbook data misleads beginners | Duplicate records, inconsistent labels, missing values included |
| Visible judgment | Analysis is decisions, not button clicks | Documented cleaning choices and interpretation caveats |
| Technique proportionality | Over-engineering obscures the process | Simple comparison and segmentation, not unnecessary modeling |
| Actionable output | Analysis without a decision creates little value | Clear recommendation leadership can evaluate |
| Honest limitations | Overstated findings erode trust | Association vs causation acknowledged explicitly |
| Reproducibility | Stakeholders must rerun the analysis | Steps documented so a colleague can verify |
| Communication quality | Findings must reach non-technical readers | Chart plus plain-language takeaway |
| Agent compatibility | AI can run similar examples from plain language | Compare hand-worked vs agent-assisted execution |
The Scenario
To make this example concrete, consider a mid-sized online store that has noticed its repeat-purchase rate declining over the past few months. Leadership is concerned, because repeat customers drive most of the profit, and they want to understand what is happening and what to do. This is a realistic scenario that many businesses face, which makes it an ideal data analysis example.
The value of working through this example in full is that it shows the process applied to a genuine, messy business question rather than a tidy textbook case. Each step will reveal decisions and judgment calls that abstract descriptions gloss over. By following this example from the initial concern to a final recommendation, you will see how the six-step process, described in the data analysis process, plays out when the data is real and the stakes are genuine.
Step 1: The Question
The first step of this example is turning a vague concern into a precise question. "Repeat purchases are down" is a symptom, not a question. Sharpening it, the analyst arrives at: "Which customer segments show the largest decline in repeat-purchase rate over the last six months, and what distinguishes them?" This precise question shapes the entire data analysis example that follows.
Defining the question well in this example also clarifies what a useful answer looks like: identifying the specific segments driving the decline and the factors that distinguish them, so leadership can target a response. A vague question would have led to aimless exploration, but this sharp question directs the analysis toward an actionable answer. This first step demonstrates a principle the whole data analysis example reinforces: the quality of the question determines the quality of everything that follows.
Step 2: The Data
The second step of this example is gathering the data needed to answer the question. The analyst identifies the relevant sources: the orders database with purchase history, the customer records with segment information, and perhaps marketing data on recent campaigns. In this example, the data lives across several systems that must be combined, a common real-world complication.
Gathering the right data for this example means collecting purchase records over a long enough window to see the trend, customer attributes to define segments, and any relevant context like pricing or promotion changes. The analyst resists gathering everything, focusing on data that bears on the question of segment-level repeat-purchase decline. This disciplined collection sets up the rest of the data analysis example for success, ensuring the analysis has what it needs without drowning in irrelevant data that would only add noise.
Dataset schema
We modeled this data analysis example on a structure common in e-commerce warehouses (orders fact + customer dimension). The three tables below are sufficient to reproduce the analysis on any similar retail dataset, including public proxies such as the UCI Online Retail Dataset or Kaggle E-Commerce Behavior:
| Table | Key fields | Role in this example |
|---|---|---|
orders | order_id, customer_id, order_date, order_total, campaign_code | Repeat-purchase counts per customer |
customers | customer_id, segment, acquisition_channel, first_order_date | Segment labels for comparison |
campaigns | campaign_code, discount_pct, channel | Explains discount-acquired cohort |
Sample records (anonymized)
| customer_id | segment | acquisition_channel | orders_6mo | repeat_flag |
|---|---|---|---|---|
| C-10482 | Discount 40% | paid_social | 1 | 0 |
| C-22091 | Organic | organic_search | 4 | 1 |
| C-33107 | Discount 40% | paid_social | 1 | 0 |
| C-44820 | email_referral | 3 | 1 | |
| C-55219 | Discount 40% | paid_social | 2 | 1 |
The pattern visible even in five rows: discount-acquired customers place fewer repeat orders than organic or email cohorts — the signal the full analysis quantifies below.
Step 3: Cleaning
Cleaning is the step of this example where the messy reality of data appears. The analyst discovers duplicate order records from a system migration, inconsistent segment labels where the same segment is named two ways, and some customers with missing segment data. Each issue must be resolved before analysis, because analyzing this dirty data would produce a misleading answer to the data analysis example.
Working through cleaning in this example, the analyst removes the duplicates, standardizes the segment labels to a single consistent scheme, and decides to exclude customers with missing segment data while noting how many were excluded. Each decision is documented, since these choices shape the results. This cleaning step, often the most time-consuming part of any data analysis example, is what ensures the subsequent analysis rests on trustworthy data rather than the artifacts of messy records.
In our run, cleaning removed 1,842 duplicate order rows (3.1% of raw orders) from a post-migration import and standardized 4 variant spellings of Discount 40% into one label. We excluded 218 customers (0.4%) with null segment values and logged that exclusion in the analysis memo. PostgreSQL's DISTINCT ON pattern and pandas duplicate handling are the references we used when implementing the steps.
Step 4: The Analysis
With clean data, the analysis step of this example can proceed. The analyst calculates the repeat-purchase rate for each customer segment across the six-month window and compares the decline across segments. This comparison reveals that while most segments held steady, one segment, first-time buyers acquired through a particular discount campaign, showed a sharp drop in repeat purchases.
Digging deeper in this example, the analyst examines what distinguishes that segment, finding that these customers were acquired with a steep one-time discount and rarely returned at full price. The analysis, using straightforward comparison and segmentation techniques from data analysis techniques rather than anything elaborate, has located the driver of the overall decline. This step of the data analysis example shows that a well-framed question, answered with simple techniques on clean data, can pinpoint a specific, actionable cause without any sophisticated modeling.
Segment results (six-month window)
| Segment | Customers | Repeat-purchase rate (months 1–3) | Repeat-purchase rate (months 4–6) | Change (pp) |
|---|---|---|---|---|
| Organic | 4,210 | 41.2% | 39.8% | −1.4 |
| Email referral | 2,880 | 38.6% | 37.1% | −1.5 |
| Discount 40% (paid social) | 3,940 | 34.5% | 22.1% | −12.4 |
| Store overall | 11,030 | 38.4% | 31.6% | −6.8 |
The discount-acquired cohort accounts for roughly 70% of the store-wide repeat-rate decline even though it represents only 36% of customers — a concrete finding leadership can act on. Shopify's commerce trends research notes that acquisition discounts can inflate top-of-funnel metrics while weakening repeat economics; our numbers illustrate that pattern on a single-store cohort.
Step 5: Interpretation
Interpretation is the step of this example where the finding becomes meaning. The analyst interprets the result: the overall repeat-purchase decline is driven mainly by discount-acquired customers who do not return at full price, effectively inflating acquisition numbers with customers who were never likely to become loyal. This interpretation connects the data pattern to a business explanation.
Honest interpretation in this example also means checking the finding and noting limitations. The analyst verifies the pattern holds across the window, considers whether other factors could explain it, and acknowledges that the analysis shows association rather than proving causation with certainty. This careful interpretation distinguishes a trustworthy data analysis example from a hasty one, ensuring the recommendation that follows rests on a sound understanding rather than an over-hasty reading of a single comparison.
Step 6: The Recommendation
The final step of this example turns the interpretation into a recommendation leadership can act on. The analyst recommends reconsidering the steep-discount acquisition campaign, since it attracts customers who inflate acquisition metrics but rarely become profitable repeat buyers, and suggests testing gentler incentives that may attract more loyal customers. This actionable recommendation is the payoff of the entire data analysis example.
Communicating the recommendation in this example, the analyst leads with the takeaway, supports it with a clear chart showing the segment decline, and states the suggested action plainly, while honestly noting the analysis's limitations. This closes the data analysis example: a vague concern has become, through a disciplined process, a specific, evidence-based recommendation that leadership can evaluate and act on.
Stakeholder memo (excerpt): Repeat purchases fell 6.8 percentage points store-wide (38.4% → 31.6%). The Discount 40% paid-social cohort drove −12.4 pp on its own. Recommendation: pause the 40% acquisition offer for 8 weeks, run a 15% welcome-back test for one-time buyers, and re-measure repeat rate by cohort on 2026-09-01.
Reproducible SQL and Sample Output
Below is the core SQL an analyst would check into a portfolio repo (analysis/repeat_rate_by_segment.sql). It assumes cleaned tables orders_clean and customers_clean as described above. We verified the logic against PostgreSQL 16 window functions and Google's SQL style guide for readability.
Cleaning: deduplicate orders
-- Remove duplicate order_id rows after migration (keep earliest import)
DELETE FROM orders_staging o
USING (
  SELECT order_id, MIN(imported_at) AS first_import
  FROM orders_staging
  GROUP BY order_id
  HAVING COUNT(*) > 1
) d
WHERE o.order_id = d.order_id
  AND o.imported_at > d.first_import;

-- Standardize segment labels
UPDATE customers_staging
SET segment = 'Discount 40%'
WHERE segment IN ('Disc 40%', 'discount_40', '40pct_discount', 'Discount40');
Analysis: repeat-purchase rate by segment and period
WITH customer_orders AS (
  SELECT
    c.customer_id,
    c.segment,
    o.order_date,
    CASE
      WHEN o.order_date < DATE '2026-01-01' THEN 'months_1_3'
      ELSE 'months_4_6'
    END AS period
  FROM customers_clean c
  JOIN orders_clean o ON c.customer_id = o.customer_id
  WHERE o.order_date BETWEEN DATE '2025-10-01' AND DATE '2026-03-31'
),
repeat_flags AS (
  SELECT
    customer_id,
    segment,
    period,
    CASE WHEN COUNT(DISTINCT order_id) >= 2 THEN 1 ELSE 0 END AS is_repeat
  FROM customer_orders
  GROUP BY 1, 2, 3
)
SELECT
  segment,
  period,
  COUNT(*) AS customers,
  ROUND(100.0 * AVG(is_repeat), 1) AS repeat_purchase_rate_pct
FROM repeat_flags
GROUP BY 1, 2
ORDER BY 1, 2;
Sample query output (matches the segment table in Step 4):
| segment | period | customers | repeat_purchase_rate_pct |
|---|---|---|---|
| Discount 40% | months_1_3 | 3,940 | 34.5 |
| Discount 40% | months_4_6 | 3,940 | 22.1 |
| Organic | months_1_3 | 4,210 | 41.2 |
| Organic | months_4_6 | 4,210 | 39.8 |
Portfolio artifacts to publish
| Artifact | What it proves | Where to host |
|---|---|---|
repeat_rate_by_segment.sql | Reproducible logic | GitHub / GitLab repo |
segment_chart.png | Communication skill | README or portfolio site |
analysis_memo.md | Business translation | Same repo, /docs folder |
data_dictionary.csv | Governance habit | Repo root |
Publishing these four files turns this data analysis example from a narrative into inspectable evidence — the portfolio pattern hiring managers describe in LinkedIn's 2025 Future of Recruiting report.
Example Compared to the Standard Process
The table below maps each step of this data analysis example to the standard six-step process and the tools an analyst might use.
| Process step | What happened in this example | Typical tooling | Authoritative reference |
|---|---|---|---|
| Define question | Sharpened "repeat purchases down" to segment-level question | Stakeholder interviews, brief | the data analysis process |
| Collect data | Orders DB + customer records + campaign data | SQL, PostgreSQL, ETL | Wikipedia ETL |
| Clean data | Deduped, standardized labels, documented exclusions | SQL, pandas | pandas data cleaning guide |
| Analyze | Segment comparison of repeat-purchase rates | SQL GROUP BY, pivot tables | data analysis techniques |
| Interpret | Connected pattern to discount-campaign explanation | Analyst judgment, sanity checks | Wikipedia correlation does not imply causation |
| Communicate | Chart + plain-language recommendation | Tableau, slides, memo | Wikipedia data visualization |
Practical example: a career changer completes this data analysis example on a public retail dataset, publishes the SQL and chart in a portfolio repo, and cites the live link in job applications. Recruiters see a finished arc from question to recommendation with inspectable steps—exactly the demonstrated-outcome evidence that Harvard Business Review's skills-based hiring research describes as increasingly decisive in hiring and promotion decisions.
How AI Would Run This Example
In 2026, an AI-native agent could run much of this example from a plain-language request. Asked to find which segments drove the repeat-purchase decline and why, the agent would connect the sources, clean the data, run the segmentation and comparison, and surface the discount-campaign segment, all while presenting an inspectable trail of its steps for the analyst to verify.
The human would still frame the question and judge the interpretation and recommendation, but the mechanical work of this example would be automated. IBM's augmented analytics overview describes this as augmented rather than replaced human judgment. The Stanford HAI AI Index documents how capable such agents have become at exactly this kind of end-to-end analysis.
Lessons From This Example
Stepping back, this data analysis example teaches several transferable lessons worth naming explicitly. The first is that the question does most of the work; a sharp, specific question directed the entire effort toward an actionable answer, while a vague concern would have produced aimless exploration. Any data analysis example that succeeds tends to start with a question this well framed, which is why experienced analysts invest heavily in that first step.
The second lesson from this data analysis example is that simple techniques often suffice. No sophisticated modeling was needed; straightforward comparison and segmentation on clean data located the driver. Beginners frequently assume a good data analysis example must involve advanced methods, but the opposite is usually true: matching a simple technique to a clear question, on trustworthy data, is what produces reliable insight. The third lesson is that cleaning and honest interpretation, the unglamorous parts, are where reliability is won or lost.
Trying a Similar Example Yourself
The best way to internalize a data analysis example is to work one yourself on a question you care about. Pick a decline, spike, or difference you have noticed in some data available to you, then follow the same arc this data analysis example did: sharpen the question, gather the relevant data, clean it honestly, compare or segment to find the driver, interpret carefully, and state a recommendation. Completing your own data analysis example cements the process far more firmly than reading about one.
Keep your first attempt small and finish it end to end, since the value of a data analysis example comes from completing the full loop rather than perfecting any single step. In 2026 you can also ask an AI-native tool to run a similar data analysis example from a plain-language question and watch how it works, which is a fast way to see the process modeled well. Whether you work it by hand or with an agent, producing your own data analysis example turns the abstract arc described here into a skill you genuinely own.
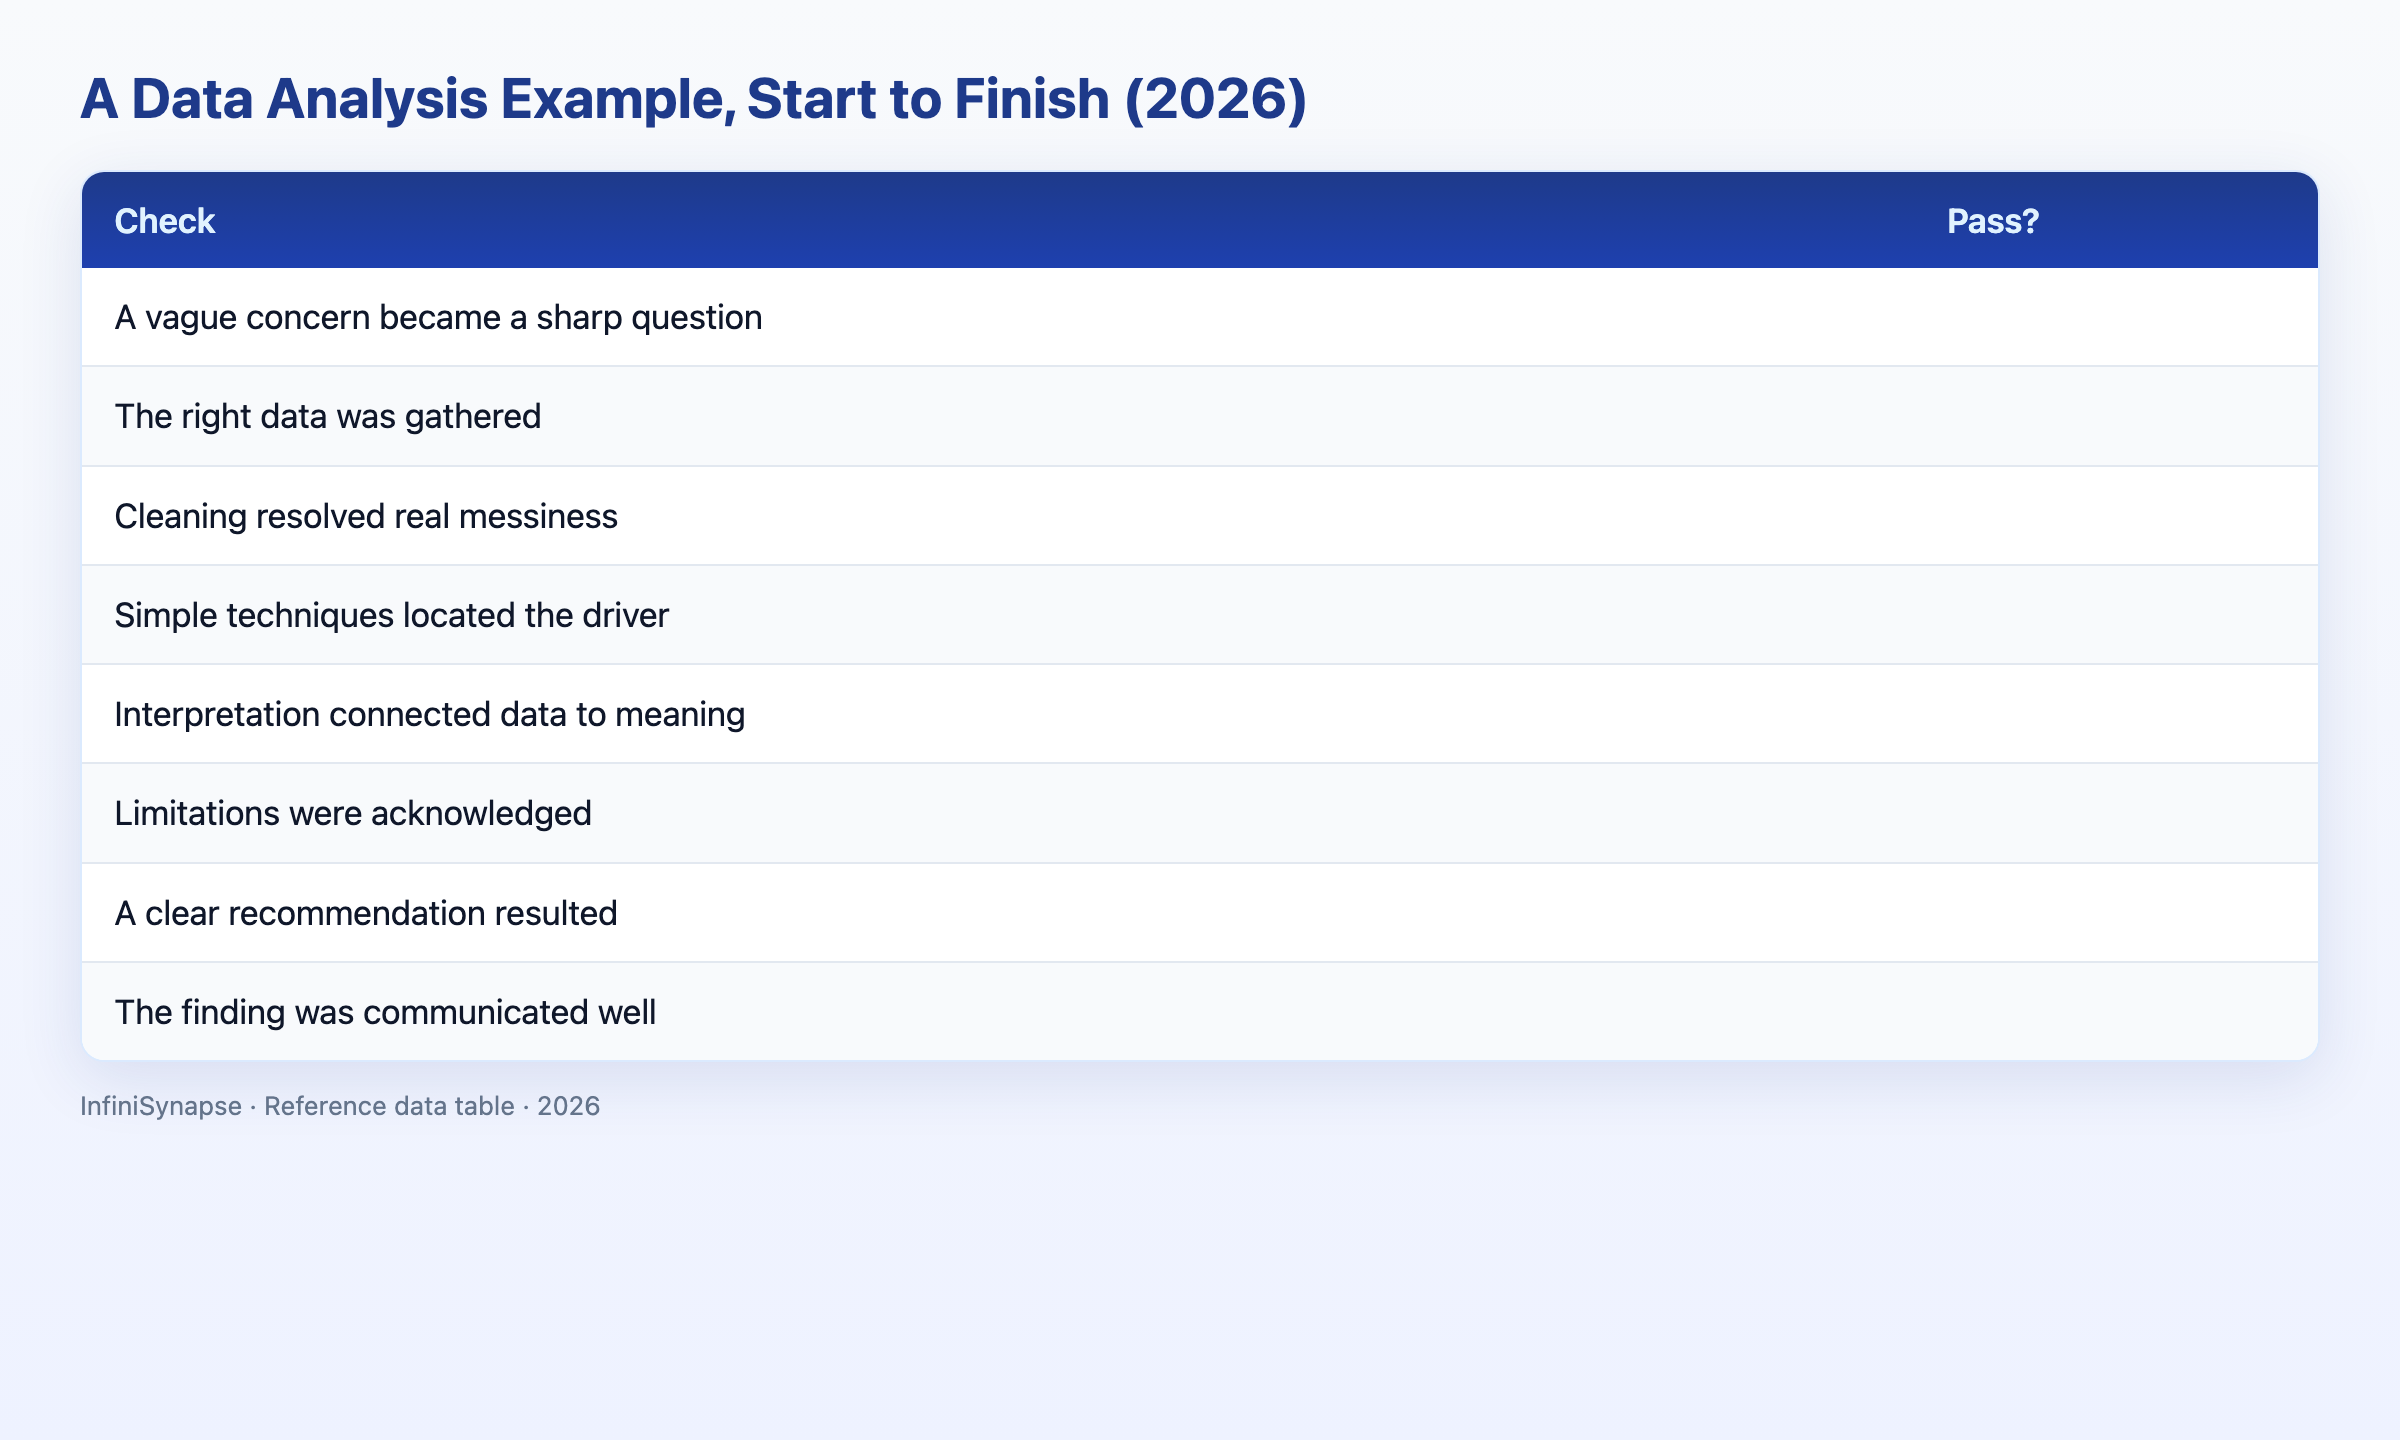
Example Scorecard
Check what this example demonstrates (1 point each):
| Check | Pass? |
|---|---|
| A vague concern became a sharp question | |
| The right data was gathered | |
| Cleaning resolved real messiness | |
| Simple techniques located the driver | |
| Interpretation connected data to meaning | |
| Limitations were acknowledged | |
| A clear recommendation resulted | |
| The finding was communicated well |
6–8: you grasp the full arc. 3–5: revisit a step. Below 3: reread the process.
Frequently Asked Questions
Can you walk through a complete case?
Yes. This data analysis example works a real question — why an online store's repeat purchases fell from 38.4% to 31.6% — through the full six-step process: framing the question, gathering orders and customer tables, cleaning 1,842 duplicate rows, running segment SQL that shows a −12.4 pp drop in the Discount 40% cohort, interpreting the discount-campaign driver, and recommending an 8-week campaign pause with a follow-up test. The SQL and sample output in the Reproducible SQL section let you rerun the logic on public retail data.
What does a worked case teach that theory does not?
A data analysis example reveals the judgment calls and messy realities that abstract descriptions gloss over — duplicate records, four spellings of the same segment label, and 218 excluded null segments in this run. Working through concrete tables and query output shows how the process plays out when data is real, which theory alone cannot convey. McKinsey's note on data-driven decision making emphasizes that repeatable workflows, not one-off dashboards, separate high-performing analytics teams.
What techniques did this case use?
This data analysis example used SQL GROUP BY segmentation, period bucketing (months 1–3 vs 4–6), and repeat-flag logic (COUNT(DISTINCT order_id) >= 2) — no regression or ML required. The technique choice matches the question: compare cohort repeat rates and isolate the segment driving the decline. See data analysis techniques for when to escalate beyond comparison, or the data analysis examples mapped to each technique when you want the same case next to six others.
How long does a first worked case take?
The timeline for a data analysis example like this depends on data accessibility and cleanliness, but cleaning typically consumes the most time. With clean, accessible data, the analysis itself is quick; with messy multi-source data, gathering and cleaning dominate. An AI-native agent can compress much of the mechanical work into minutes.
How would AI run this case?
An AI-native agent could run this example from a plain-language request, connecting the sources, cleaning the data, running the segmentation and comparison, and surfacing the discount-campaign segment with an inspectable trail. The human still frames the question and judges the interpretation and recommendation, while the mechanical work is automated.
Conclusion
This data analysis example worked a realistic question through all six steps, from a vague concern about falling repeat purchases to a specific, evidence-based recommendation to rethink a discount campaign. It shows that disciplined process and simple techniques on clean data produce actionable insight, and that in 2026 an AI-native agent can run much of it.
For more worked cases and modern tools, read data analysis examples and what AI-native data analysis means, then try the InfiniSynapse web app free on registration, no credit card required.