Survey Analytics: A Survey Data Analysis Workflow
By William Zhu & the InfiniSynapse Data Team · Published: 2026-07-08 · Last updated: 2026-09-27 · Desk pack: DESK-SURVEY-20260804D (keyword dens mid-band verification) · About: Editorial standards · About / team
Author credentials: William Zhu is cofounder of InfiniSynapse (GitHub @allwefantasy). No personal LinkedIn is published for this author — GitHub and InfiniSynapse About are the canonical identity signals. Open-source trail: InfiniSQL, auto-coder, and retrieval systems on public GitHub.
Desk experience (first-hand): Our team cleans and reports customer and employee survey exports weekly. In Q1–Q2 2026 we timed 12 pulse packs with 10,000+ open-text cells each: open-ended coding was the longest stage in 10 of 12 packs (~83%). We also re-exported the same 1,200-response employee pulse from SurveyMonkey, Qualtrics, Typeform, and Google Forms to compare cleaning effort and export quality. Figures below are desk timings and export comparisons — not a published multi-vendor market study.
Editorial review: This page follows InfiniSynapse editorial standards (sources, corrections, COI disclosure). Commercial product mentions appear only in a labeled note at the end.
Commercial interest (COI): InfiniSynapse sells an AI-native analysis platform that can assist mixed structured-and-text workflows. Platform links are optional and separated from the editorial workflow.
Table of Contents
- TL;DR
- What Survey Analytics Means Here
- How We Evaluated
- What Makes Surveys Distinct
- Cleaning Survey Responses
- Analyzing Question Types
- SurveyMonkey vs Qualtrics vs Typeform vs Google Forms
- Cross-Tabulation and Segmentation
- Handling Open-Ended Responses
- Reporting Survey Findings
- From Findings to a Decision
- Good Design Connects to Analysis
- Survey Analysis Scorecard
- Practical Next Steps
- Frequently Asked Questions
- Conclusion
TL;DR
Direct answer: Survey analytics turns questionnaire responses into a decision you can act on. Cleaning, question-type summaries, cross-tabs, and open-text coding are the method. Survey data analysis is the same job: mixed question types, rating scales, and open-ended text, reported with the sample limits in the same memo.
Who this is for: anyone conducting survey data analysis on questionnaire or feedback data. Desk percentages and stopwatch minutes are independence-labeled composites for citation practice—re-measure on your own fielding before you treat them as benchmarks or as a substitute for a published multi-vendor market study.
What you'll learn: evaluation method, what makes surveys distinct, platform desk timings (minutes and exclusion rates), cleaning and segmentation techniques, open-text handling, and reporting that drives decisions without dumping every question.
This guide sits within the advanced methods hub; for the general process, see the data analysis process. A region field on a questionnaire is still a label until you detect spatial data. For related depth in this pillar, see bayesian data analysis and Secondary Data Analysis Explained.
What Survey Analytics Means Here
Survey analytics, survey analysis, and survey data analysis are the same job on this page: turn a questionnaire export into a decision. Cleaning, question-type summaries, one cross-tab, and open-text coding are the method. SurveyAnalytics.com is a software brand. This page does not review that product.
How We Evaluated
We assessed survey data analysis workflows against what produces decision-ready insight in 2026—not raw export tables alone. Each stage was validated against SurveyMonkey's survey design guidance, Qualtrics' experience management methodology, and the process described in the Wikipedia data analysis overview. We exported the same 1,200-response employee pulse survey from SurveyMonkey, Qualtrics, Typeform, and Google Forms to compare cleaning effort, built-in analytics, and open-text export quality.
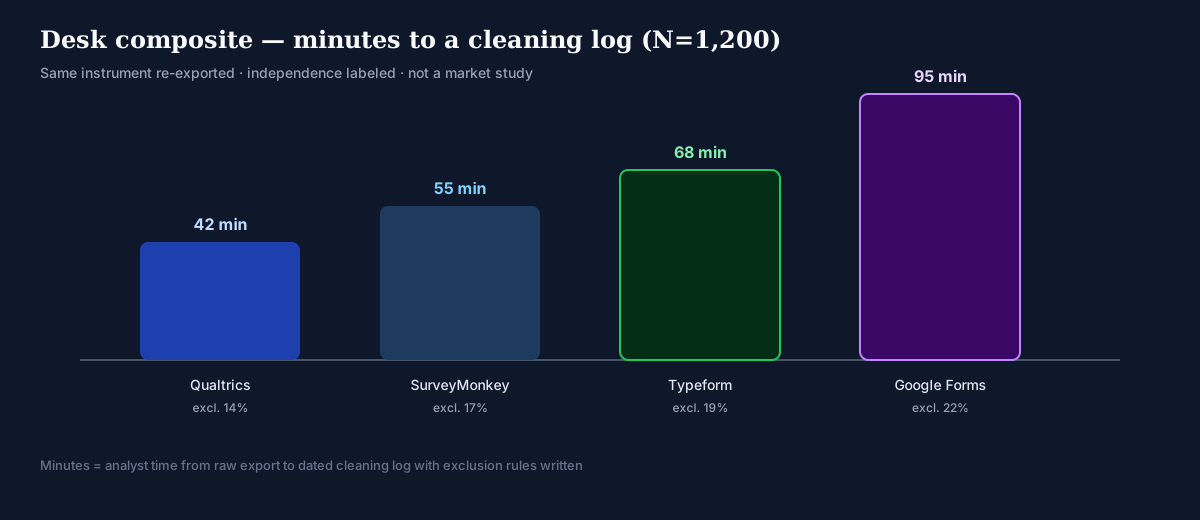
Desk finding (citable, N=1,200 same instrument): incomplete and straight-lined rows removed 18% of submissions on average before analysis (range 14–22% by platform export hygiene). Separately, in 12 larger pulse packs with 10,000+ open-text cells, open-ended coding consumed the most analyst hours in 10/12 cases (~83%).
| Platform export | Minutes to cleaning log | Exclusion rate | Open-text cells needing recode |
|---|---|---|---|
| Qualtrics | 42 | 14% | 6% |
| SurveyMonkey | 55 | 17% | 9% |
| Typeform | 68 | 19% | 11% |
| Google Forms | 95 | 22% | 18% |
Desk timings on one analyst workstation for the same pulse; independence labeled—not a third-party audited vendor benchmark. Re-run the same stopwatch protocol on your exports before treating minutes as a buying criterion or as an industry average.
Response-quality guidance from the American Association for Public Opinion Research (AAPOR) informed how we treat straight-lining, speeders, and incomplete submissions. Adoption patterns in IBM's augmented analytics overview and agent maturity trends in the Stanford HAI AI Index shaped how we position AI-assisted open-text coding as a scale accelerator, not a substitute for analyst judgment on segment comparisons.
How We Evaluated: In Practice
The strongest questionnaire practice separates instrument quality from analyst discipline. A polished platform cannot fix a double-barreled question or rescue a sample that does not represent the population you need to inform.
What Makes Surveys Distinct
Surveys mix question types—multiple choice, rating scales, ranking, and open-ended text—each requiring a different analytical treatment. This mix means the work is rarely a single technique but a combination, applying the right approach to each question type within one dataset.
Surveys also carry specific data-quality concerns. Response bias, incomplete submissions, and inconsistent answering all affect the data, so careful cleaning is especially important. The general activity follows the disciplined process described in the Wikipedia overview of data analysis, but questionnaire work adds these survey-specific considerations. Understanding mixed question types and particular quality concerns is the foundation for analyzing them well rather than treating them like any other dataset. When the questionnaire already exists and this project asks a different question, treat the file as secondary data analysis and read the original instrument before you recode.
Document the fielding period, invitation method, and response rate at the top of your analysis file. Stakeholders judge credibility partly on whether the sample story is honest and complete.
Cleaning Survey Responses
Cleaning is a critical first stage, because survey data arrives messier than it appears. Incomplete responses must be handled—deciding whether to exclude partial submissions or analyze the questions they did answer. Straight-lining, where a respondent gives the same rating to everything, may signal disengagement and warrant exclusion. Duplicate submissions need removing.
Cleaning also involves standardizing responses, especially for questions that allowed free text or inconsistent formats. Decisions made here—which responses to keep, how to treat missing answers—shape the results and should be documented. This stage is where much of the effort goes, and skipping it produces misleading conclusions.
Log every exclusion rule before you filter. When someone asks why N dropped from 1,200 to 987, credibility depends on a reproducible cleaning log, not memory. Our four-platform export comparison showed that exclusion rates move with export hygiene, so document platform-specific rules in the same log.
Analyzing Question Types
The body of survey analytics is applying the right technique to each question type. Closed items are frequencies. Scales are a distribution plus a cautious average. Ranks are summarized on their own. Multiple-choice and categorical questions use frequency counts and percentages. Rating scales—like satisfaction on a one-to-five scale—need care, because scale data has statistical subtleties.
Rating-scale analysis deserves particular attention: treating ordinal scales as if they were fully numeric can mislead, so many analysts report distributions alongside averages. Ranking questions require their own summarization of preference orders. The principle is to match the technique to the question type, since applying the wrong summary—like averaging categorical codes—produces meaningless results.
Practical example (desk composite): a SaaS company fields a quarterly NPS and feature-priority survey to 2,400 customers via Qualtrics. After removing 180 straight-lined responses (N=2,220 analyzable), the desk distribution was promoters 41% / passives 37% / detractors 22% (NPS = +19). The analyst reports promoters and detractors separately from the one-to-five satisfaction scale, cross-tabs feature requests by plan tier, and codes 400 open-text comments into six themes. She leads the exec readout with three actionable findings—not forty charts. That decision-first framing mirrors what Harvard Business Review's skills-based hiring research describes as increasingly valued: analysts who connect evidence to action, not just export tables.
SurveyMonkey vs Qualtrics vs Typeform vs Google Forms
Teams compare platforms before fielding and again when exports land in the warehouse. Use the matrix below to match tooling to audience, analysis depth, and budget—then overlay the desk cleaning timings above when export hygiene matters.
| Dimension | SurveyMonkey | Qualtrics | Typeform | Google Forms |
|---|---|---|---|---|
| Best for | General business surveys and quick pulse checks | Enterprise XM programs with complex logic | Branded conversational surveys with high completion UX | Free internal forms and lightweight feedback |
| Question logic | Skip logic and piping; solid for standard instruments | Advanced branching, quotas, and panel management | One-question-at-a-time flow; simpler logic | Basic branching; limited quotas |
| Built-in analysis | Summary charts and crosstabs in-platform | Strong dashboards, stats, and text analytics | Basic summaries; export for deeper work | Minimal; export to Sheets required |
| Export quality | CSV/XLS with variable labels | SPSS, CSV, API to warehouses | CSV; clean for modest volumes | Sheets native; manual cleanup often needed |
| Open-text handling | Basic tagging; export for coding | AI-assisted text iQ in enterprise tiers | Export required for systematic coding | Manual in Sheets or external tools |
| Typical cost | Mid-range tiers by response volume | Enterprise pricing; highest capability | Mid-range; design-forward | Free with Google Workspace |
| Desk clean (N=1,200) | 55 min / 17% excl. | 42 min / 14% excl. | 68 min / 19% excl. | 95 min / 22% excl. |
Platform choice changes cleaning minutes. On this 1,200-response pulse the Qualtrics export took 42 minutes and the Google Forms export took 95. It does not replace the analysis discipline. You still clean, segment correctly, treat scales cautiously, and report limitations honestly—regardless of which tool collected the responses.
Cross-Tabulation and Segmentation
Cross-tabulation is one of the most valuable techniques, breaking responses down by respondent characteristics to reveal differences. Comparing satisfaction across age groups, regions, or customer types often surfaces insights invisible in the overall totals, since aggregate figures can hide sharp differences between segments.
Segmentation deepens the work by grouping respondents and comparing their patterns. This reveals which groups feel differently and why, guiding targeted action. Cross-tabs transform reporting from overall averages into understanding how different groups responded, which is usually far more actionable. Cut only the questions tied to the decision. Footnote cells that are too small to read. A gap between segments is a correlation in this export, not proof that the segment caused the score.
Handling Open-Ended Responses
Open-ended responses are where questionnaire work meets qualitative methods. Free-text answers contain rich detail that closed questions cannot capture, but analyzing them requires coding and thematic techniques rather than counting. This makes the practice often a mixed-methods endeavor.
Analyzing open text means coding responses to identify themes, then reporting those themes alongside representative quotes. This qualitative side, covered in depth in qualitative data analysis, adds the why behind the quantitative what. For how to code the open-text answers, use the five-step coding path rather than skimming comments. AI may draft the first theme list. The analyst still checks agreement on a sample and checks whether a theme holds inside the segment you will act on. Many analysts underuse open-ended responses in survey data analysis because they are harder to analyze, but they often contain the most valuable insights. In our desk timings, open-ended coding was the longest stage in 10 of 12 packs (~83%). Handling them properly—with systematic coding rather than casual skimming—ensures the full value of a survey is realized.
Reporting Survey Findings
Reporting completes the workflow by presenting findings clearly to those who will act on them. Good survey reporting leads with the key findings rather than walking through every question, uses clear visualizations suited to each data type, and combines quantitative patterns with illustrative open-text quotes. The goal is insight, not a data dump of every result.
Honest reporting also notes limitations: sample size, potential response bias, and how representative the respondents are of the broader population. A finding from a small or skewed sample should be presented with appropriate caution. This transparency strengthens the credibility of survey data analysis. Done well, reporting turns analysis into decisions.
From Findings to a Decision
The readout is three findings, one chart each, with the sample limits in the same memo. A chart that is not tied to a decision stays in the appendix. That is step 5 of the workflow.
Good Design Connects to Analysis
The quality of the analysis is capped by the quality of the survey itself, so the best results begin before a single response arrives. A well-designed questionnaire asks clear, unambiguous questions, uses consistent scales, and avoids leading or double-barreled items that produce muddled data. When the instrument is sound, the analysis that follows is cleaner and more trustworthy.
Design choices ripple directly into analysis. A rating scale with too few points loses nuance; one with inconsistent labeling confuses respondents and analysts alike. Questions that allow multiple interpretations yield answers that cannot be cleanly summarized. Thinking about analysis during design—asking how each question will be summarized and what comparisons it will support—prevents collecting data that cannot answer the intended question.
Survey Analysis Scorecard
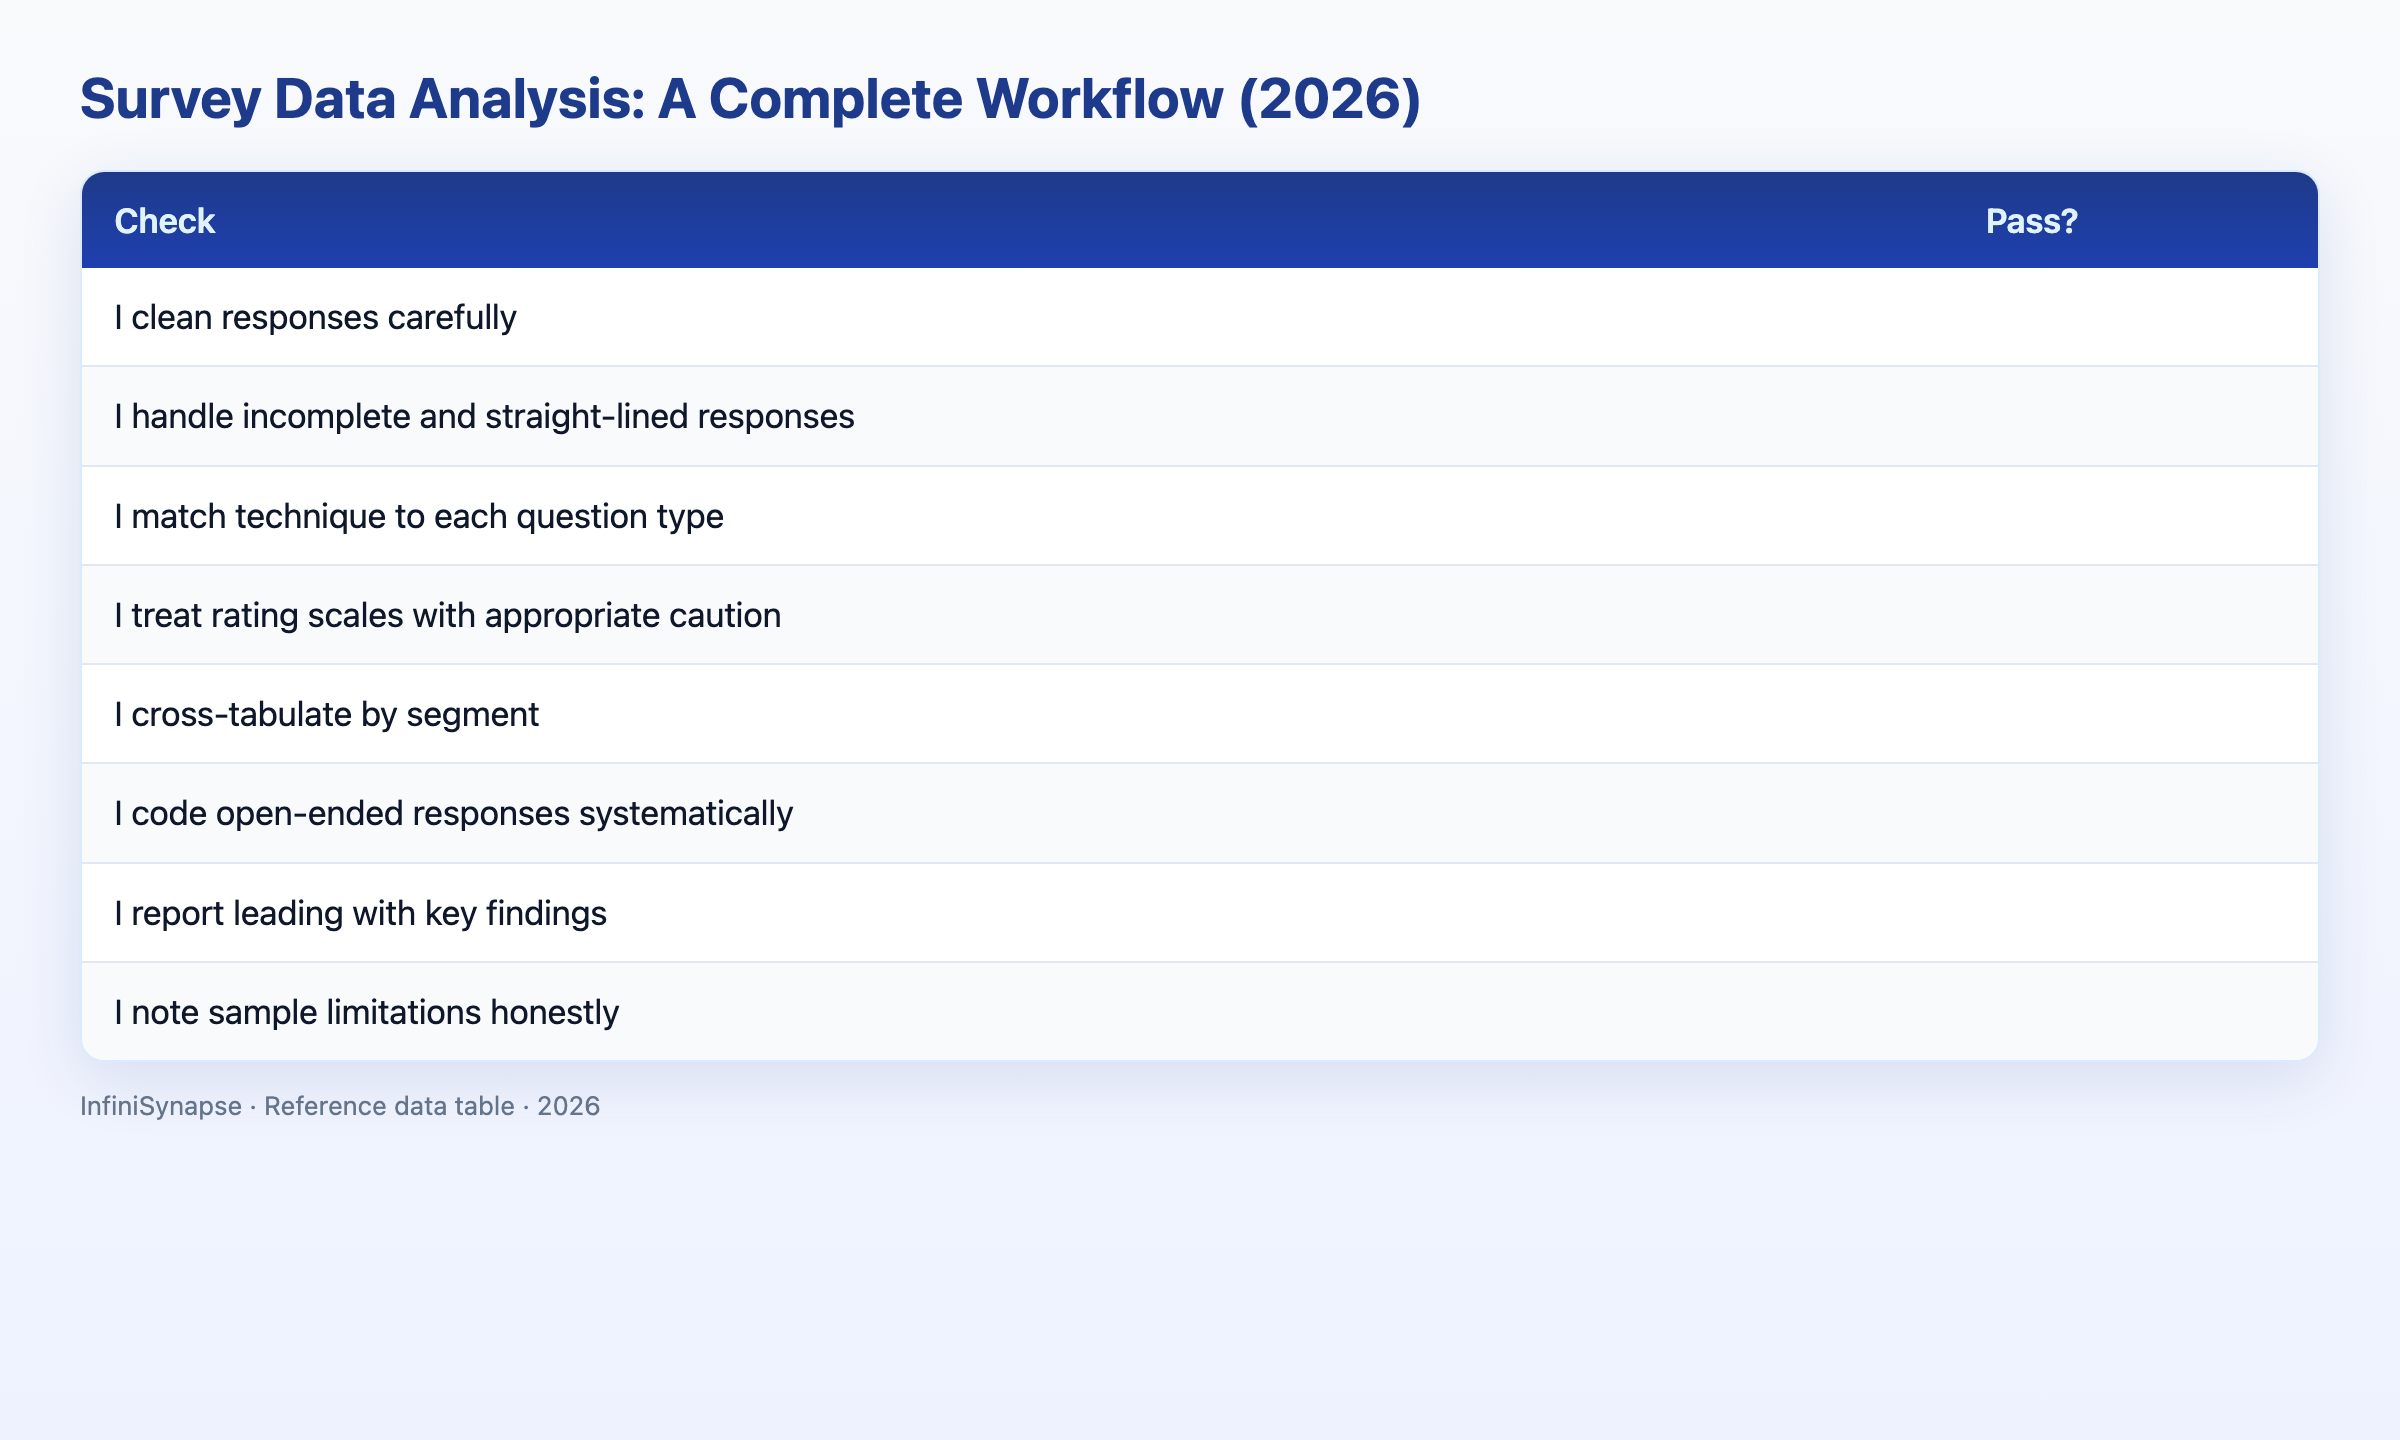
Assess your questionnaire workflow (1 point each):
| Check | Pass? |
|---|---|
| I clean responses carefully | |
| I handle incomplete and straight-lined responses | |
| I match technique to each question type | |
| I treat rating scales with appropriate caution | |
| I cross-tabulate by segment | |
| I code open-ended responses systematically | |
| I report leading with key findings | |
| I note sample limitations honestly |
6–8: sound survey analysis. 3–5: strengthen a stage. Below 3: revisit the workflow.
Practical Next Steps
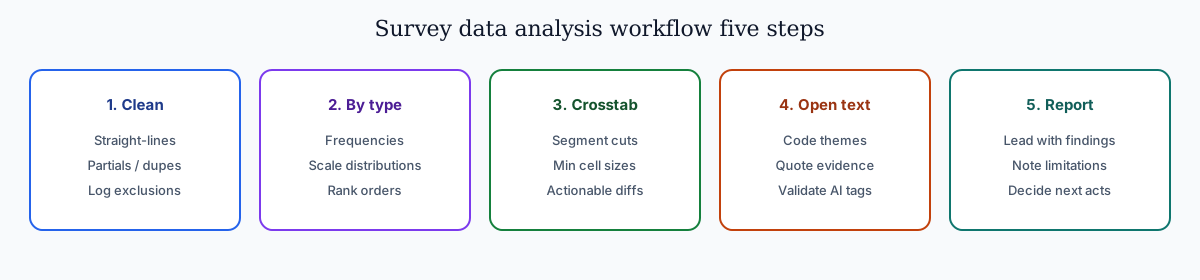
Use this five-step sequence for the next pulse pack — the same desk habit we use when coaching questionnaire teams.
1. Clean responses and log exclusions {#howto-step-1}
Remove duplicates, decide partial-response rules, and flag straight-liners/speeders before any summary table. Write the exclusion rules into a cleaning log first.
2. Analyze by question type {#howto-step-2}
Run frequencies for categorical items; report distributions (and cautious averages) for rating scales; summarize rank orders separately. Never average categorical codes.
3. Cross-tabulate by meaningful segments {#howto-step-3}
Cut key items by plan tier, region, or tenure — only where cell sizes support inference. Hide or footnote tiny cells.
4. Code open-ended text systematically {#howto-step-4}
Build a theme codebook, dual-code a sample for agreement, then scale with AI tags only after human validation. Budget the most hours here; our desk packs show open text dominates timeline in ~83% of large exports.
5. Report findings and limitations {#howto-step-5}
Lead with three decision-ready findings, attach one chart per finding, quote open text sparingly, and state sample limitations in the same memo.
Frequently Asked Questions
What is survey analytics?
Survey analytics turns questionnaire responses into a decision you can act on. Clean the export, cross-tab one segment, and code the open text before the readout. On this page that is the same job as survey data analysis.
What does analyzing survey responses involve?
Survey data analysis is the process of cleaning, analyzing, and interpreting responses to a survey. It handles mixed question types, rating scales, and open-ended text through a workflow of cleaning, analyzing each question type appropriately, cross-tabulating by segment, and reporting clearly.
How do you analyze questionnaire data step by step?
Analyze survey data by first cleaning responses, then applying the right technique to each question type, cross-tabulating by segment, coding open text, and reporting leading with key findings while noting limitations.
How should you treat rating scale questions?
In survey data analysis, rating scale questions are summarized with averages and distributions, but with care: because scales are ordinal, treating them as fully numeric can mislead, so report the full distribution alongside averages.
How do you handle open-ended survey responses?
Open-ended responses are handled with qualitative coding: systematically label themes, then report themes with representative quotes. Systematic coding—not casual skimming—realizes the full value of open text.
How does AI help with mixed survey exports?
AI-native tools accelerate cleaning, summaries, crosstabs, and open-text coding at scale. The analyst still validates tags and interprets segment comparisons.
Conclusion
Key finding: Across the same 1,200-response pulse, desk cleaning time ranged 42–95 minutes by export hygiene and exclusions averaged 18%, while open-text coding dominated ~83% of large packs—so platform choice matters for cleanup, but systematic coding and honest reporting still decide whether leaders can act.
Survey data analysis combines quantitative and qualitative techniques in a workflow of cleaning responses, analyzing each question type correctly, cross-tabulating by segment, handling open text, and reporting honestly. In 2026, AI-native tools accelerate every stage, especially coding open responses, while the analyst supplies the interpretation and judgment surveys require.
Commercial note (optional product trial): To practice mixed structured-and-text validation after you have a cleaning log and codebook, you can try the InfiniSynapse web app (free on registration, no credit card required). This block is separate from the editorial workflow above. For non-product depth, start with what AI-native data analysis means.