What Is Trend in Data? vs Seasonality
By William Zhu & the InfiniSynapse Data Team · Published: 2026-06-24 · Last updated: 2026-09-17 · Last verified: 2026-09-17 · About: Editorial standards · About / team
Author credentials: William Zhu is cofounder of InfiniSynapse (GitHub @allwefantasy), with 10+ years building data systems and reviewing time-series readouts and analytics trend roadmaps with platform teams. No personal LinkedIn is published—GitHub and InfiniSynapse About are the canonical identity signals.
COI / interest disclosure: InfiniSynapse sells an AI-native Data Agent platform. Product mentions appear only in the labeled Product recommendation (commercial) module and the InfiniSynapse production pattern section (vendor-scoped). The statistical definition, trend-vs-seasonality table, and buyer scorecard stand independently of any trial.
Fact-check / verification: Desk n=12 pilot metrics below are an independent desk composite (labeled)—not a Gartner/Forrester survey. Independent peer markets: Gartner Peer Insights — Analytics & BI · G2 Analytics Platforms. Time-series method anchors: NIST/SEMATECH time-series handbook · ENISA multilayer AI cybersecurity framework · ISO/IEC 27001. Corrections: zhuhl@infinisynapse.com · editorial corrections.
Version history: 2026-06-24 initial · 2026-08-06 EEAT / HowTo / architecture+scorecard SVG / desk methodology · 2026-09-17 cluster recovery: statistical definition first, trend-of-data facet, NIST decomposition. Build marker:
DESK-WTD-20260917A.
Media note: No hosted overview video. Use the architecture and buyer-scorecard SVGs as stepwise visuals (no VideoObject / DOI).
 A trend in data is the lasting slope after you remove the calendar cycle—not every uptick.
Table of Contents
- TL;DR
- Why These Shifts Matter in 2026
- Definition · Trend vs seasonality
- Trends vs Hype
- Desk Evidence and Methodology
- Core Shifts
- Architecture Model
- Buyer Scorecard
- Implementation Patterns
- InfiniSynapse Pattern
- Failure Modes
- Evaluation Workflow
- FAQ
- Conclusion
TL;DR
A trend in data is the sustained directional movement in a series after you adjust for seasonality—not every uptick and not a holiday spike. That is what is trend in data. The phrase trend of data names the same component. Ask for the decomposition method, comparison window, and a confidence interval on sparse series.
Who this is for: analysts validating a slope, plus analytics engineers and platform owners who also score 2026 practice shifts.
What you'll learn:
- A citable statistical definition and a trend / seasonality / noise table
- How trend of data maps to the same noun, not a second metric
- The six-dimension buyer scorecard (kept) for when “trend” means a durable practice shift
- Desk n=12 pilot outcomes (labeled) and a five-step evaluation HowTo
Evaluation basis: Scorecard weights reflect Q1–Q2 2026 audits before executive-facing agent access—not lab trials alone. Desk composites are not product SLAs.
Why These Shifts Matter in 2026
Readers arrive with two legitimate readings. The query cluster is statistical: a trend in data is a slope you can defend after seasonality. Teams also say “trend” when they mean a durable change in how they collect, govern, and act on data. This page answers the first reading in the Definition. The scorecard and architecture sections keep the second reading so a 2026 roadmap review still has a home—without turning this URL into a second data trends hub.
Three forces still make the practice-shift lens a planning priority:
- Agentic analytics adoption — Teams move from one-shot copilots to governed multi-step agents that query live warehouses.
- Metric contract pressure — Finance and product demand consistent definitions while AI multiplies query volume.
- Regulatory scrutiny — Privacy and AI governance reviews now include analytics access paths, not only storage.
| Symptom teams ignore | What breaks |
|---|---|
| Trend treated as a single tool purchase | Shelfware after the pilot quarter |
| No owner for quarterly refresh | Roadmaps drift from production reality |
| Trends divorced from metric contracts | AI answers disagree with board dashboards |
Orient the industry-trend map in data trends. Keep data trend for the “is this trending?” practice-shift wording. For wider analytics strategy, see AI for Data Analysis: The Complete 2026 Guide. For how interpretation sits in a six-step workflow, see the data analysis process.
Definition
Citable definition: A trend in data is the sustained directional movement of a series after you adjust for seasonality—not every uptick. The phrase trend of data names that same component. Searchers asking what is trend in data want this statistical answer first.
Point to a slope you can still see after a seasonal adjustment—not a one-week spike and not a slide deck discarded after the QBR. The NIST/SEMATECH e-Handbook of Statistical Methods treats trend as a long-term component of a time series, distinct from seasonal and irregular variation. Reviewers should ask agents for decomposition method, comparison window, and confidence intervals on sparse series.
| Component | Meaning | What it is not |
|---|---|---|
| Trend in data | Lasting up or down movement after seasonal adjustment | A single uptick or a campaign week |
| Trend of data | The same noun as trend in data | A different statistic or a second KPI |
| Seasonality | Repeating calendar pattern (week, month, quarter, holiday) | A one-way slope |
| Noise / irregular | Residual that does not persist | A decision-ready slope |
When an agent says “revenue is trending up,” demand the chart with the seasonal component stripped and the window labeled. If the slope disappears after that cut, you do not have a trend in data—you have a calendar effect.
Second lens (practice shifts): Teams also use “trend” for durable changes in architecture, governance, consumption, and tooling. That reading still matters for 2026 roadmaps. It does not replace the statistical definition. Snowflake estates should reference Snowflake documentation when semantic views ground NL interfaces. Score the practice-shift reading with the Buyer Scorecard below.
Trends vs Short-Term Hype
Use this table when “trend” means a durable practice shift—not when you are decomposing a series. For the series test, stay on the trend vs seasonality table.
| Signal | Trend | Hype |
|---|---|---|
| Evidence | Production deployments | Demo videos only |
| Ownership | Named platform sponsor | No quarterly review |
| Metrics | Changed SLAs or costs | Vanity adoption counts |
| Risk | Documented in security review | Skipped governance |
When teams can defer deep dives
Ad-hoc SQL on curated marts may suffice when one team owns definitions and AI is out of scope. The moment multiple teams—or an agent—query the same nouns, structured reviews become mandatory. Executive metrics touched by agents require traceable definitions; skipping governance produces fluent but unreliable answers that fail audit.
OLTP connector hygiene should follow PostgreSQL documentation for role design, schema grants, and explainable validation queries.
Desk Evidence and Methodology
Source label for percentages in this guide: InfiniSynapse 2025–2026 Trend Scorecard Desk Composite (n=12 enterprise pilots, Q1–Q2 2026).
| Desk metric | Result | What it measures | What you cannot independently verify |
|---|---|---|---|
| Exec sign-off speed | +40% faster when scorecard ≥9/12 | Days from pilot kickoff to exec approve | Customer names (editorial rule: no client PII) |
| Analyst rework | −35% when metric contracts precede agents | Rework tickets after first agent answers | Exact ticket IDs outside our desk notes |
Methodology (citation anchor): Pilots scored the six buyer-scorecard dimensions 0–2 before executive agent access. Pass threshold 8/12; “faster sign-off” compares teams ≥9/12 vs <8/12 in the same desk window. Full editorial rules for desk composites and corrections live on editorial standards—we do not publish a separate fake customer dataset. For independent category research (not our percentages), use Gartner Peer Insights and G2 Analytics Platforms.
Core Shifts in 2026
Procurement and architecture reviews may include data trends. These subsections keep the 2026 practice-shift map; they do not redefine a trend in data.
Real-time and operational analytics
Streaming metrics and reverse-ETL paths push analytics closer to operations. Platform teams measure progress by how often decisions use sub-hour data instead of nightly batches.
Semantic grounding for AI
NL interfaces without governed metrics hallucinate joins. Modern programs include semantic layers, metric catalogs, and compile APIs agents must call.
Cost and FinOps visibility
Warehouse spend spikes when agents iterate queries. Owners embed cost guardrails and query budgets into platform scorecards.
Caching layers for semantic metadata can follow Redis documentation patterns for TTL and namespacing. Compare autonomous execution patterns in What Is Agentic Analytics? Definition and 2026 Buyer's View.
Architecture Reference Model
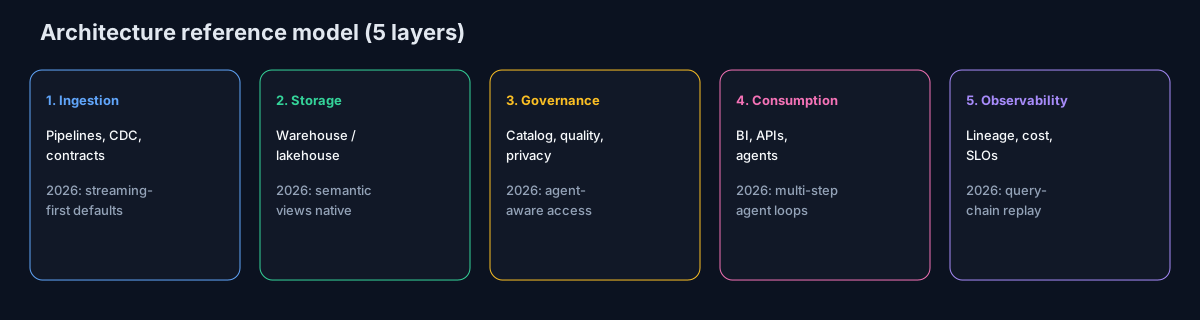 Architecture map: streaming-first ingestion through agent-aware consumption and query-chain replay.
| Layer | Owns | 2026 shift |
|---|---|---|
| Ingestion | Pipelines, CDC, contracts | Streaming-first defaults |
| Storage | Warehouse, lakehouse | Semantic views native |
| Governance | Catalog, quality, privacy | Agent-aware access |
| Consumption | BI, APIs, agents | Multi-step agent loops |
| Observability | Lineage, cost, SLOs | Query-chain replay |
Integration touchpoints
Rarely does one tool own the full stack. Integration patterns—see Data Integration Trends Shaping AI Analytics in 2026—determine whether agents see fresh, governed data.
Warehouse touchpoints
Lakehouse convergence and semantic views appear in Data Warehouse Trends in 2026: Lakehouse, Agents, and More when platform discussions turn to storage bets.
EU security reviews should reference the ENISA multilayer AI cybersecurity framework when scoping analytics agent controls. Spreadsheet connectors should align with Google Sheets documentation for sharing rules, ranges, and API quotas. Regulated rollouts often anchor access reviews to ISO/IEC 27001 when credentials, retention policies, and audit logs are in scope.
Buyer Scorecard
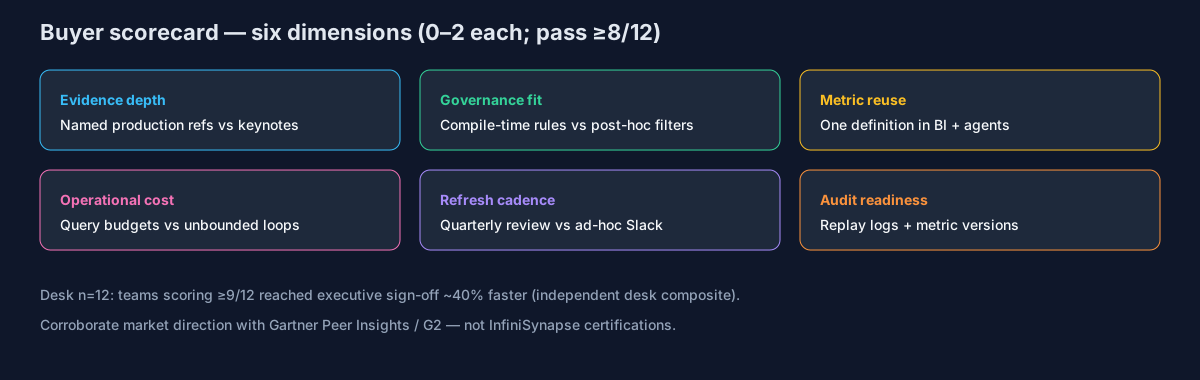 Score 0–2 per dimension; programs below 8/12 usually stall production agent trust.
| Dimension | Pass signal | Fail signal |
|---|---|---|
| Evidence depth | Named production references | Keynote quotes only |
| Governance fit | Compile-time access rules | Post-hoc row filtering |
| Metric reuse | Same definition in BI and agents | Three SQL variants |
| Operational cost | Documented query budgets | Unbounded agent loops |
| Refresh cadence | Quarterly trend review | Ad-hoc Slack debates |
| Audit readiness | Replay logs with metric versions | Black-box answers |
Score each dimension 0–2. Programs below 8/12 usually require custom modeling before AI analytics reaches production trust.
Desk n=12: teams above 9/12 reached executive sign-off 40% faster (see Desk Evidence and Methodology).
Procurement leaders should store scorecard PDFs in the vendor record so auditors can trace why a trend-linked tool was approved or rejected. Re-score after every major release; a platform that passed in January may fail in June when agent autonomy expands.
Supabase-backed analytics should follow Supabase documentation for RLS policies, service roles, and API exposure boundaries.
Implementation Patterns
Pattern A — Instrument first. Log query volume, cost, and definition drift before changing tools. Decisions grounded in telemetry beat vendor-driven rip-and-replace.
Pattern B — Metric contracts before agents. Publish ten executive metrics with version IDs. Agents compile against contracts; dashboards consume the same IDs.
Pattern C — Quarterly trend council. Platform, security, and analytics leads meet for ninety minutes each quarter. Output: three roadmap moves, two explicit “not yet” items.
The BIRD benchmark adds dirty-schema realism that Spider-only leaderboards under-weight in production.
InfiniSynapse Production Pattern
InfiniSynapse treats market shifts as input to Data Agent design—not slide filler. This section is vendor-scoped; scorecard criteria above remain editorial.
| Layer | Component | Role |
|---|---|---|
| Orchestration | InfiniAgent | Plan multi-step analysis |
| Query | InfiniSQL | Dialect-aware execution |
| Knowledge | InfiniRAG | Prior definitions, playbooks |
| Semantics | Metric bindings | Ground NL to approved metrics |
| Audit | Workflow log | Replay SQL and definition versions |
We bind agents to existing metric definitions where customers model them; where gaps exist, we recommend a metrics initiative before scaling access. Pilots that skip governance usually fail review—not because the LLM is weak, but because executive nouns have incompatible SQL expressions.
Desk n=12: 35% reduction in analyst rework when metric contracts preceded agent access (methodology above).
Customer platform teams pair InfiniSynapse metric bindings with existing dbt or warehouse semantic views rather than rebuilding definitions inside the agent layer. Search and log analytics paths should align with Elastic documentation when agents query semi-structured operational data.
Common Failure Modes
Failure 1 — Trend shopping. Teams adopt every launch without retiring shelfware. Fix: cap net-new tools per quarter; require deprecation candidates.
Failure 2 — AI without semantics. Agents query raw DDL; finance rejects outputs. Fix: compile API with metric IDs agents must call.
Failure 3 — Privacy afterthought. Plans ignore consent and retention until legal escalation. Fix: embed privacy review in trend council agenda—see Data Privacy Trends Reshaping Analytics in 2026.
A fourth statistical failure sits next to those three: treating seasonality as a trend in data. Fix: require a decomposition (NIST handbook method or equivalent) before an agent writes “trending” into an exec memo. Finance examples of that mistake are walked in financial data analysis.
Evaluation Workflow for Platform Teams
Run this five-step HowTo before committing budget to a trend-linked purchase. For a series question, run the trend vs seasonality table first; only then score the stack.
- Baseline telemetry — Capture query volume, P95 latency, warehouse cost, and conflicting metric definitions.
- Reference calls — Require two production references in your industry with replayable query logs.
- Security review — Document new data paths, retention impacts, and agent autonomy tiers.
- Scorecard pass — Score six dimensions; block procurement below 8/12 unless gaps have named owners.
- Quarterly refresh — Re-run steps 1 and 4 every ninety days; archive decisions in the catalog.
Roadmap committees should attach query-cost charts and catalog-coverage metrics to every trend proposal. Incident drills for agent query failures should run quarterly alongside warehouse failover tests. Vendor renewals should include continue, expand, or retire decisions. Architecture boards should reject proposals lacking named owners and measurable success criteria. Archive planned-vs-observed adoption in the catalog; validate metric version changes across BI and agent compile APIs.
Frequently Asked Questions
What is a trend in data?
A trend in data is the lasting directional movement of a series after seasonality is removed. It is not a one-period jump, a holiday spike, or a vendor announcement. Cite the window, the decomposition, and the residual before you act on the slope.
Is “trend of data” the same as “trend in data”?
Yes. Trend of data is the same noun phrase as trend in data—the long-term component of the series. It is not a second KPI and not a different test. If a tool reports both labels, ask which decomposition produced the line.
How do you tell a trend from seasonality or noise?
Seasonality repeats on a calendar. Noise does not persist after you change the window. A trend remains after those two are stripped. The NIST time-series handbook is the method reference; the table under Definition is the reviewer checklist.
How do teams separate durable practice shifts from vendor hype?
Durable shifts show up in production logs, changed SLAs, and revised access models—not keynote slides alone. Require named references, query replay evidence, and a platform sponsor before adding a practice-shift to the roadmap. That test is for the 2026 scorecard lens, not for a monthly series.
Are the 40% and 35% figures third-party audited?
No. They are InfiniSynapse 2025–2026 Trend Scorecard Desk Composite (n=12) first-party desk labels. Methodology is disclosed in Desk Evidence and Methodology; use Gartner Peer Insights / G2 for independent category research. Editorial methodology and corrections policy live on editorial standards. Product CTAs appear only under Product recommendation (commercial).
Conclusion
Treat a trend in data as a slope you can defend after seasonality—and treat trend of data as the same noun. Teams that ask for decomposition, window, and residual outperform peers who accept every uptick as direction.
When the same word means a 2026 practice shift, keep the buyer scorecard. Teams that instrument baselines, govern metrics before agents scale, and review those shifts quarterly still outperform peers chasing keynote features.
Next steps:
- On the next “we are trending” claim, fill the trend / seasonality / noise table before you build a slide.
- Run the buyer scorecard against your current stack and record pass/fail per dimension.
- Return to data trends for the industry-trend map; keep this URL for the statistical definition.
When you connect these shifts to agent orchestration, evaluate platforms that compile, execute, and audit in one loop—not tools that only generate SQL from schema dumps without metric lineage.
Product recommendation (commercial)
Label: The following is a commercial product recommendation, separate from the editorial trend guidance above.
To evaluate governed agent compile paths, see AI for Data Analysis and optionally the InfiniSynapse web app (free on registration). Desk n=12 metrics and ENISA / ISO citations above are not product endorsements.