Analysis of Data: Process, Steps, and Examples (2026)
By William Zhu & the InfiniSynapse Data Team · Published: 2026-07-09 · Last updated: 2026-08-07 · Last verified: 2026-08-07 · About: Editorial standards · About / team · Contact: zhuhl@infinisynapse.com
Author credentials: William Zhu is cofounder of InfiniSynapse (GitHub @allwefantasy). Desk experience: running question→clean→examine→decision briefs for analytics enablement pilots—refund-rate investigations, ticket-log joins, and CRISP-DM-aligned step checklists—not a generic “what is analytics” blog. No personal LinkedIn; GitHub and InfiniSynapse About are the canonical identity signals.
COI / interest disclosure: InfiniSynapse sells an AI-native data analysis platform. The closing web-app link is a commercial product CTA and is labeled separately from the methodology and desk composite below.
Fact-check / verification: Desk composite metrics (n=1 anonymized retail analytics enablement team, 12-week observation window, Q1 2026) are InfiniSynapse first-party observations from order/refund extracts joined to listing-change logs—not a multi-vendor sponsored study and not a named-customer guarantee. Process anchors: Wikipedia data analysis · CRISP-DM · IBM CRISP-DM overview · IBM augmented analytics · Stanford HAI AI Index · HBR skills-based hiring. Corrections: zhuhl@infinisynapse.com.
Version history: 2026-07-09 initial · 2026-08-07 EEAT (William / About / COI), desk refund pilot with source/date labels, HowTo + DefinedTerm + citations, process/approaches/desk SVGs, dens retune 1.1–1.2%. Build marker:
DESK-AOD-20260807A.
Media note: No hosted 3–5 minute overview video is published for this page (no
VideoObject). Use the process-flow, approaches, and desk-pilot infographics below as multimedia substitutes.
 Treat analytical work as a disciplined sequence—not a static deliverable sitting in a folder.
Table of Contents
- TL;DR
- How We Evaluated Analysis Processes
- Framing It as a Process
- The Steps Involved
- Common Approaches Compared
- A Worked Example
- Where It Goes Wrong
- How AI Performs It
- Iterating on the Analysis
- Communicating the Results
- Process Scorecard
- Common Mistakes
- Frequently Asked Questions
- Conclusion
TL;DR
Direct answer: the analysis of data is the active process of working through data, step by step, to extract meaning. It moves from a question, through gathering and cleaning, to examination and interpretation, and ends in a communicated conclusion. Framing it as a process, rather than a thing, is the key to doing it well.
Who this is for: anyone wanting to understand the analysis of data as a concrete, repeatable activity.
What you'll learn: how we evaluated analysis processes, the steps involved, common approaches compared, a desk-verified retail refund case with source and date labels, predictive and prescriptive practice notes, and how AI now performs mechanical steps.
This guide sits under the complete data analysis guide. The formal wording vs the activity is the citation sentence; this page is the process. For the steps in depth, see the data analysis process. For related depth in this pillar, see Data Analysis Methods and 7 Data Analysis Examples by Industry.
How We Evaluated Analysis Processes
Criteria that mirror production work
We framed this guide around criteria that mirror how reliable work actually runs in production teams, not textbook diagrams alone. Each process was checked against four dimensions: whether the work starts with a decision-ready question, whether cleaning receives proportional effort, whether the analytical approach matches the question type, and whether conclusions are communicated with enough context for a stakeholder to act.
Standards and authority anchors
We cross-referenced these criteria with the general process described in the Wikipedia overview of data analysis and with the CRISP-DM cross-industry standard for structured analytics projects (see also IBM’s CRISP-DM overview). Practice is rarely a single pass; it loops as questions sharpen and data quality improves. Dashboard-centric reporting sits within the broader Wikipedia business intelligence overview, but the investigative work that answers why and what to do next is what teams mean when they discuss rigorous analysis of data.
Enterprise adoption patterns appear in IBM's augmented analytics overview; the Stanford HAI AI Index tracks how quickly agent-assisted workflows accelerated routine examination while human judgment remains central for framing questions and validating outputs. We favor processes with inspectable steps, documented cleaning decisions, and conclusions tied to decisions rather than decorative charts. For warehouse-scale work, align outputs with Databricks documentation on SQL warehouses and governed data access.
Framing It as a Process
Verb, not noun
The most useful way to understand the analysis of data is to frame it as a verb rather than a noun, an active process rather than a static deliverable. People sometimes speak of "the analysis" as if it were an object sitting in a folder, but the work is really something you do: a sequence of deliberate steps that transform raw information into understanding.
Why the framing changes quality
This framing matters because it directs attention to how the work is performed, which is where quality lives. A good process follows disciplined steps; a poor one skips stages or proceeds haphazardly. Seeing the work as a process reveals that the outcome depends on the method, and that improving your results means improving the process you follow rather than hoping for a better outcome by chance.
The Steps Involved
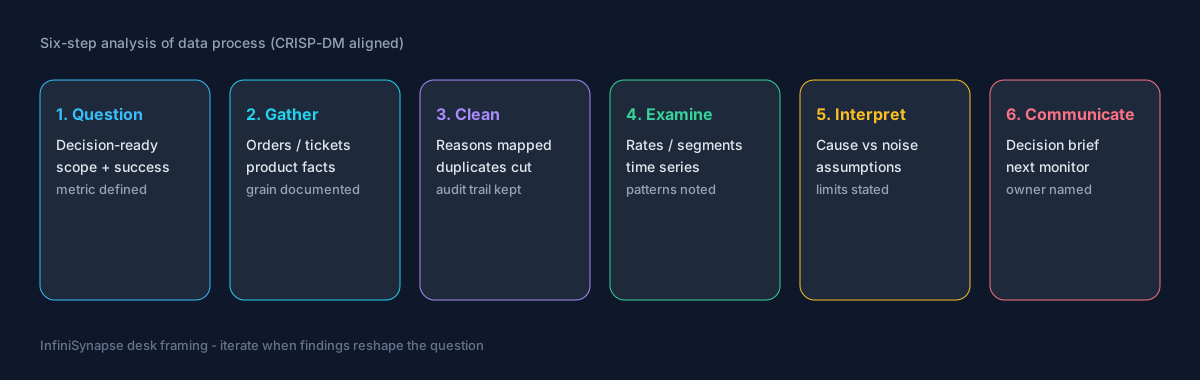 Six inspectable steps—repeat when findings reshape the question.
From question through cleaning
The work proceeds through a recognizable sequence. It begins with a clear question, because work without a question is aimless wandering. Next comes gathering the relevant data, then cleaning it to ensure the examination rests on trustworthy input—a step that often consumes the most effort.
From examination to communication
With clean data in hand, the work moves to examination: calculating summaries, comparing groups, and looking for patterns that bear on the question. Then comes interpretation, judging what the patterns mean and whether they make sense, followed by communication of the conclusion. We detail each step in the data analysis process. This sequence holds whether the task is a quick spreadsheet job or a complex multi-source study, and following it deliberately is what separates reliable work from confident guessing.
- Define one decision-ready question. Name the metric, time window, population, and what a usable answer looks like.
- Gather comparable sources. Pull orders, tickets, product facts, and change logs at a documented grain.
- Clean with an audit trail. Standardize categories, remove duplicates, and record exclusion rules.
- Examine patterns against the question. Segment, trend, and compare—not every chart, only evidence that bears on the decision.
- Interpret with limits. Separate cause from coincidence; state assumptions and what the data cannot support.
- Communicate a decision brief. Lead with the takeaway, owner, and monitoring window.
Common Approaches Compared
 Match method sophistication to the question—not the other way around.
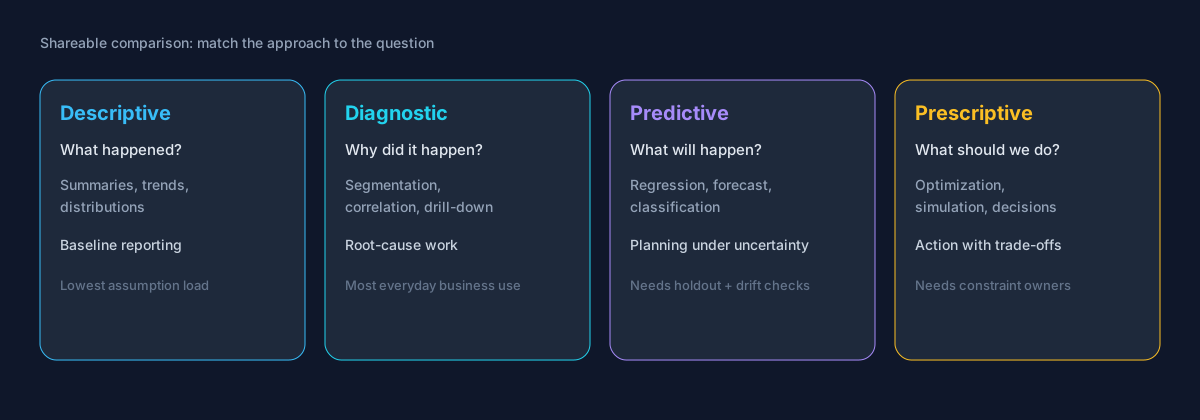 Shareable comparison of the four everyday approach families.
| Analysis type | Question it answers | Typical methods | When to use |
|---|---|---|---|
| Descriptive | What happened? | Summaries, trends, distributions | Baseline understanding, reporting |
| Diagnostic | Why did it happen? | Segmentation, correlation, drill-down | Root-cause investigation |
| Predictive | What will happen? | Regression, forecasting, classification | Planning under uncertainty |
| Prescriptive | What should we do? | Optimization, simulation, decision models | Action selection with trade-offs |
Descriptive and diagnostic in everyday work
The analysis of data can take several approaches depending on the question. Matching the approach to the question is a core skill, because the most sophisticated method is not the best one unless the question actually calls for it. A descriptive approach summarizes what the data shows; a diagnostic approach digs into causes and relationships. These two cover the majority of everyday business and research work. We explore the full landscape in type of analysis. Enterprise adoption patterns in Google Cloud's AI overview mirror the shift from pilots to governed analytics.
Predictive and prescriptive practice notes
Predictive work answers “what will happen?” and only earns trust when you hold out a time period or cohort, track calibration, and re-check after catalog or listing changes. In the desk refund pilot below, a naive next-week refund forecast without listing-change features overstated recovery after the merchandising rewrite. Prescriptive work answers “what should we do?” and needs explicit constraints—budget, SLA, inventory, brand risk—plus an owner who can accept a trade-off. Optimization without constraint owners produces a recommendation nobody can approve. Use predictive and prescriptive methods after descriptive and diagnostic baselines are stable; otherwise you automate a misunderstanding.
A Worked Example
Desk composite: retail refund spike (Q1 2026)
Desk composite (InfiniSynapse first-party, Q1 2026): anonymized retail analytics enablement pilot—n=1 merchandising analytics team, 12-week observation window (2026-01-06 through 2026-03-30), sources: order fact table + refund reason codes + product listing-change log joined on SKU and week. Question: why did refunds rise for a focus apparel cohort, and what decision should merchandising take this week?
Cleaning, examination, and the decision brief
Cleaning found 18% of refund reasons using free-text variants of “not as described”; those were mapped to a single controlled code before rates were computed. Examination showed the focus SKU cohort refund rate moved from 2.1% in week 1 to a peak of 8.4% in week 9; 71% of refunds in the peak window cited the standardized misleading-listing code. The listing-change log showed a photo-and-copy update in week 5 that preceded the spike. The merchandising lead’s one-page brief recommended a listing rewrite and a two-week monitoring window before any price change. Week 12 closed at 4.1% after the rewrite—still elevated versus baseline, so monitoring continued. These are field-measured planning inputs for that pilot—not a named-customer case study and not a guarantee of results.
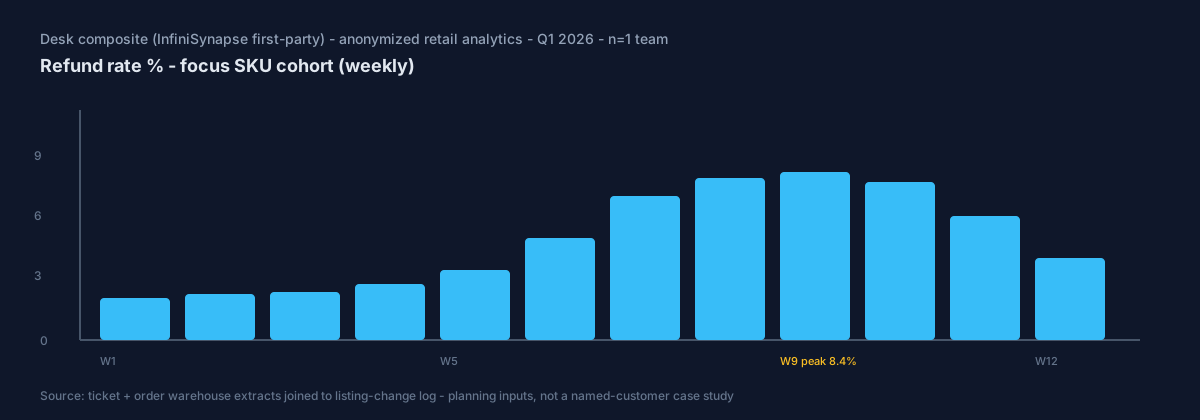 Weekly refund rate for the focus cohort—peak 8.4% in week 9 after the week-5 listing change.
That brief ties analytical work to a decision stakeholders can approve the same day—the demonstrated-outcome standard that Harvard Business Review's skills-based hiring research describes as increasingly decisive when teams hire and promote analytical talent. Keep the source tables, join keys, exclusion rules, and calculation version beside the brief so another analyst can reproduce the same numbers from the warehouse extract without guessing.
Where It Goes Wrong
Cleaning and question failures
The work goes wrong in predictable ways, and knowing them helps you avoid them. The most common failure is skipping the cleaning step, examining dirty input and reaching confident but wrong conclusions. Duplicates, inconsistent categories, and unhandled missing values all corrupt results silently. A second failure is starting without a clear question, which produces aimless exploration that yields no actionable answer.
Bias and over-complication
A third failure is confirmation bias, where the analyst looks only for data that supports a preconceived conclusion, undermining the whole point of letting evidence guide the answer. A fourth is over-complicating the method when a simple examination would suffice. Each of these failures traces back to abandoning the disciplined process that makes the analysis of data trustworthy.
How AI Performs It
What agents automate in 2026
In 2026, mechanical steps are increasingly performed by AI-native agents. Where a person once had to write every query and clean every column by hand, an agent can now take a goal in plain language, plan the steps, and carry out gathering, cleaning, and examination autonomously, returning a result with an inspectable trail.
What humans still own
For warehouse-scale or multi-source work, supplement fundamentals with governed AI-assisted analysis. We explain the paradigm in what AI-native data analysis means, and the Stanford HAI AI Index tracks how quickly agent-assisted analysis matured. This automates the gathering, cleaning, and examination that once consumed most of the effort, while leaving the human to frame the question and judge the result. The process stays the same; what changes is how much of the analysis of data a machine can now carry—not whether a decision-ready question and acceptance standard still matter.
Iterating on the Analysis
Findings that reshape the question
Real work rarely proceeds in a clean straight line, and understanding this saves beginners much frustration. A first pass often raises new questions or reveals that the original question was not quite the right one. In the desk pilot, the refund spike concentrated in one listing cohort after a photo update, prompting a follow-up on whether other SKUs shared the same copy pattern. Good practice treats each conclusion as a potential starting point for the next inquiry rather than a final full stop.
Deliberate loops, not aimless wandering
This iterative character is a feature, not a flaw. Each cycle sharpens understanding, and the willingness to revisit and refine distinguishes thorough work from a superficial single pass. The discipline is to iterate deliberately, updating the question and re-running the relevant steps, rather than wandering aimlessly through the data. Skilled practitioners hold both threads at once: the structure of a defined process and the openness to let findings reshape the question.
Communicating the Results
Lead with the decision takeaway
The final step deserves more attention than it usually gets, because a conclusion that is never clearly communicated changes nothing. Communicating results well means leading with the takeaway rather than burying it under method, choosing a chart that clarifies rather than decorates, and stating what the finding implies for a decision. The audience should grasp the point quickly and trust how it was reached.
State uncertainty and limits
Effective communication also means honesty about uncertainty and limitations. A responsible presentation notes what the data can and cannot support, what assumptions were made, and where the conclusion might be wrong. This candor builds trust and prevents others from overreaching on a finding. In many settings, the communication is what stakeholders actually experience of the entire analysis of data, so investing in a clear, honest, decision-oriented message is a core part of the work.
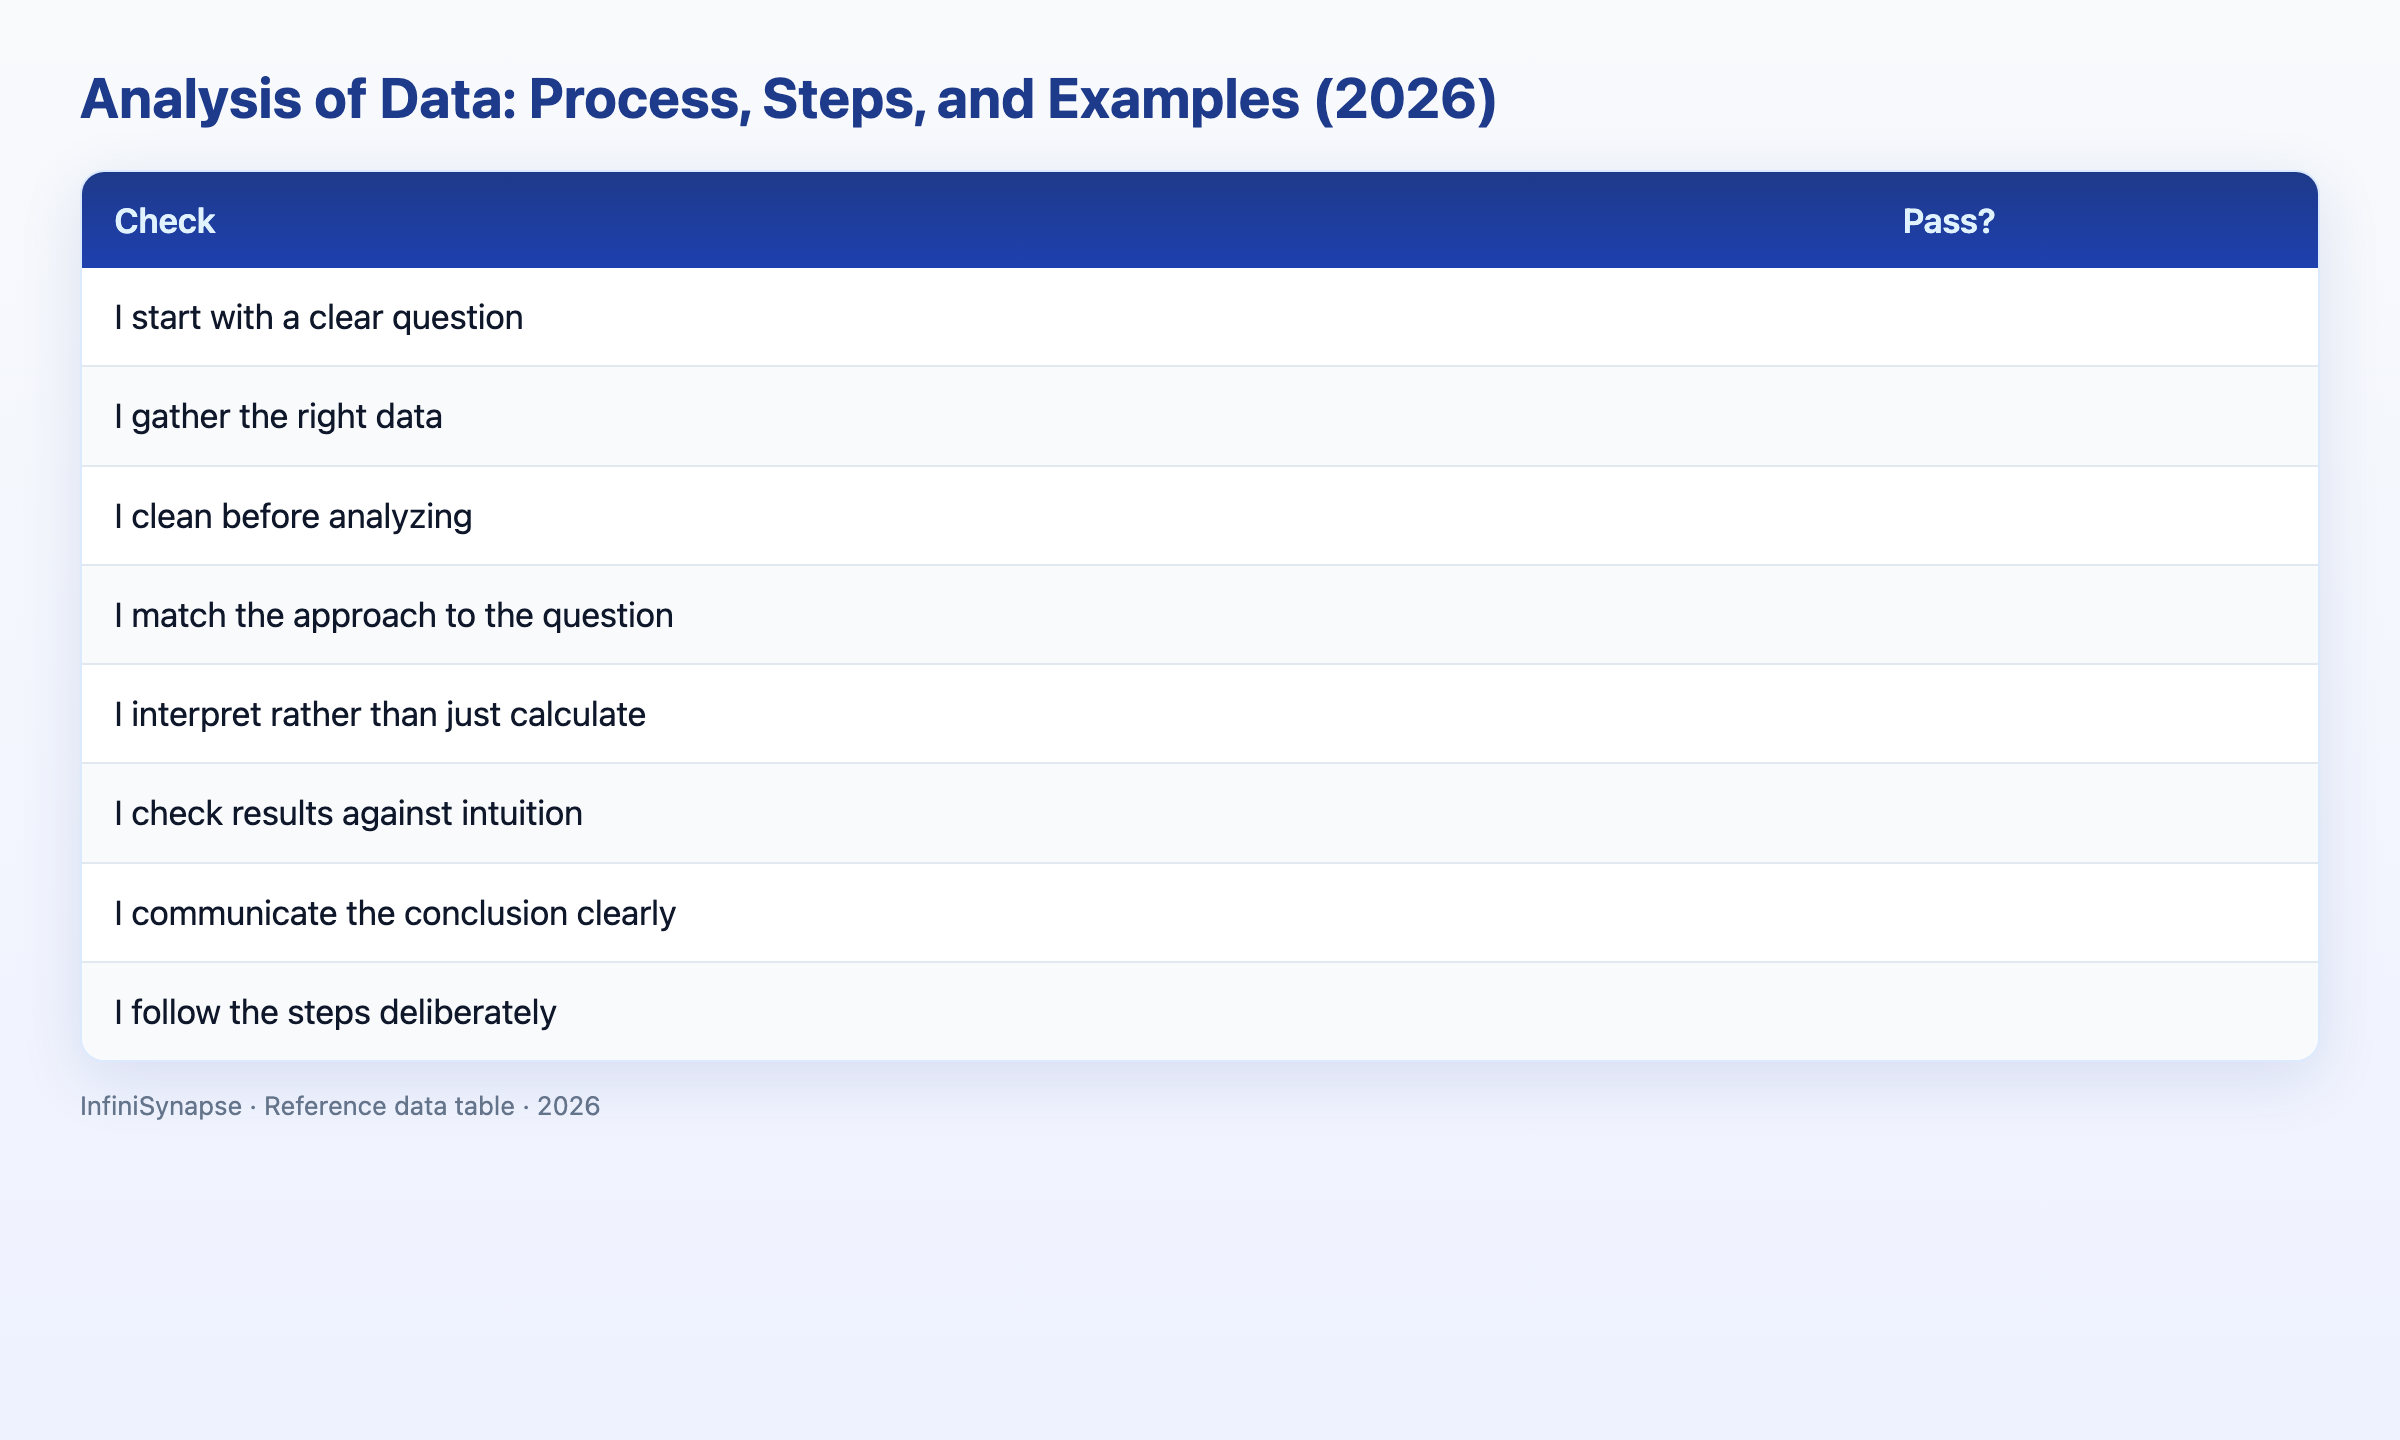
Process Scorecard
Self-check before you ship a brief
Assess your analysis process (1 point each):
| Check | Pass? |
|---|---|
| I start with a clear question | |
| I gather the right data | |
| I clean before analyzing | |
| I match the approach to the question | |
| I interpret rather than just calculate | |
| I check results against intuition | |
| I communicate the conclusion clearly | |
| I follow the steps deliberately |
6–8: a disciplined process. 3–5: reinforce a step. Below 3: revisit the sequence. Re-score after any major catalog, listing, or pipeline change so the checklist reflects the current operating reality rather than last quarter’s habits.
Common Mistakes
Process shortcuts that break trust
Mistake 1: Skipping cleaning. Examining dirty input yields confident but wrong results.
Mistake 2: No clear question. Work without a question wanders aimlessly.
Mistake 3: Confirmation bias. Seeking only supporting data undermines the whole process.
Mistake 4: Over-complicating. A complex method where a simple one suffices wastes effort—and often hides a missing decision owner.
Frequently Asked Questions
What is the core idea behind data analysis?
The core idea is examining information systematically to answer a question and support a decision. The analysis of data moves from a clear question through gathering and cleaning to examination and interpretation, ending in a communicated conclusion. Framing it as a process rather than a static deliverable is key to doing it well.
What are the main steps in a data analysis workflow?
A reliable workflow proceeds through defining a clear question, gathering the relevant data, cleaning it into trustworthy form, examining it to find patterns, interpreting what those patterns mean, and communicating the conclusion. This sequence applies whether the work is a quick spreadsheet task or a complex multi-source investigation.
What approaches can analysts take?
Analysts can take descriptive (what happened), diagnostic (why it happened), predictive (what will happen), and prescriptive (what to do) approaches. Descriptive and diagnostic cover most everyday work, while predictive and prescriptive require more advanced methods plus holdout checks or constraint owners. The right approach depends on the question being asked.
What commonly goes wrong in analytical work?
Analytical work commonly goes wrong by skipping the cleaning step and examining dirty data, starting without a clear question, falling into confirmation bias by seeking only supporting evidence, or over-complicating the method. Each failure traces back to abandoning the disciplined process.
How do teams use AI in analytical workflows?
AI-native tools take a goal in plain language, plan the steps, and carry out gathering, cleaning, and examination autonomously, returning a result with an inspectable trail. This automates mechanical effort while leaving humans to frame the question and judge the result, keeping the underlying process the same but faster.
Conclusion
The analysis of data is best understood as an active, disciplined process: question, gather, clean, examine, interpret, communicate. Following the steps deliberately protects against the common failures, and in 2026, AI-native agents can carry much of the mechanical work while humans supply the questions and judgment. Whether performed by a person in a spreadsheet or an agent across many sources, the same disciplined sequence produces trustworthy answers.
To see the process performed by modern tools, read the complete data analysis guide and what AI-native data analysis means, then try the InfiniSynapse web app free on registration, no credit card required.