Microsoft Excel Data Analysis: Advanced Techniques for 2026
By the InfiniSynapse Data Team · Last updated: 2026-09-16 · Last verified: 2026-09-16 · We build an AI-native data analysis platform and work with power users daily; this guide reflects the Microsoft stack teams actually buy, then the advanced Excel techniques that pay off—not novelty tricks.
Table of Contents
- TL;DR
- Microsoft software for data analysis
- How We Evaluated
- Beyond the Basics
- Dynamic Arrays and Modern Formulas
- LAMBDA and Reusable Logic
- What-If Analysis and Solver
- Power Query and Light Automation
- Excel vs Google Sheets vs Power BI vs Python
- The Boundary of Advanced Excel
- Selection Scorecard
- Practical Next Steps
- Frequently Asked Questions
- Conclusion
TL;DR
Direct answer: Microsoft software for data analysis is a stack, not one app. Excel (Analysis ToolPak, Power Query, Solver) is the desktop grid. Power BI is governed dashboards. Fabric is the SaaS lakehouse plus Power BI. Start in Excel; graduate when refresh, scale, or certified metrics outgrow the workbook.
Who this is for: analysts asking which Microsoft software for data analysis to buy—and power users extending microsoft excel data analysis before graduating to BI or code.
What you'll learn: the Microsoft product map and public list prices, then the advanced Excel techniques (dynamic arrays, LAMBDA, What-If, Solver, Power Query) that still repay learning time, plus ceiling signals.
This guide sits within the data analysis tools hub; for fundamentals, see Excel data analysis: complete how-to. For related depth, see Excel as a data analysis tool and analyse office statistics. In-grid copilots are scored separately on best AI for Excel data analysis.
Microsoft software for data analysis
If the query is Microsoft software for data analysis, start here. Excel is the default answer on resumes and in labs, but it is one product in a family. Pick the row that matches the job, then use the advanced Excel sections below when the grid is still the right surface.
Public list prices are vendor-published entry seats as of 16 September 2026—not a quote. Confirm current SKUs on the vendor page. Fabric and Power BI Premium are capacity- or tenant-tied; we do not invent a fake “from $X” for those rows.
| Microsoft product | Best job | Public list / entry (Sep 2026) | When it is enough |
|---|---|---|---|
| Excel + Analysis ToolPak | Ad-hoc tables, stats, what-if | Included in Microsoft 365 | Modest files; inspectable models |
| Excel + Power Query / Power Pivot | Refreshable imports and data models | Same Microsoft 365 seat | Recurring CSV/folder packs |
| Power BI | Governed dashboards | Power BI Pro list seat; Premium is capacity | Certified metrics, wide audience |
| Microsoft Fabric | Lakehouse + engineering + Power BI | Fabric capacity | Multi-workload analytics estate |
| Copilot in Excel / Power BI Copilot | Natural-language help on a Microsoft 365 file or report | Copilot add-on on an eligible seat | File already in OneDrive/SharePoint |
| SQL Server / Azure Analysis Services | Warehouse and semantic models | Server / Azure SKU | IT-owned models, not a desktop grid |
 Illustrative: desktop Excel vs Power BI vs Fabric on scale and governance. Not a customer ROI study.
How to read the stack. Teams searching Microsoft software for data analysis usually mean Excel plus whatever Microsoft already licensed. Keep Excel for sandboxes and negotiation models. Move recurring executive packs to Power BI. Move multi-source engineering to Fabric. That split is the same ceiling described later in this guide—and in IBM's augmented analytics overview.
How We Evaluated
We assessed advanced microsoft excel data analysis techniques against what power users actually need in 2026: less formula dragging, readable reusable logic, scenario modeling without re-building sheets, and automation that survives refresh. Capabilities were validated against Microsoft Learn Excel training paths and Excel support documentation, the analytical process in the Wikipedia data analysis overview, patterns in IBM's augmented analytics overview, and agent maturity trends in the Stanford HAI AI Index. Product-family claims for Microsoft software for data analysis follow Microsoft Learn pages for Power BI and Fabric.
How We Evaluated: What To Verify
We compared advanced microsoft excel data analysis outcomes to workflows in Google Sheets, Power BI, and Python on identical scenario models to see where the grid still wins on transparency versus where it loses on governance.
How We Evaluated: In Practice
Techniques that look impressive in demos but break on edge cases scored lower than boring, auditable patterns—named tables, parameter sheets, and Power Query steps anyone can replay.
Beyond the Basics
Advanced microsoft excel data analysis starts when simple SUM and VLOOKUP chains become unmaintainable. The goal is not to impress with formula length but to make models readable: inputs on one sheet, logic on another, outputs and charts on a third. Dynamic arrays, LAMBDA, Data Tables, and Solver extend what the grid can model without leaving Excel.
Power users often over-invest in macros before mastering Power Query and modern functions. In our experience, microsoft excel data analysis maintainability improves faster when refreshable imports and named logic replace one-off VBA that only the author understands.
Advanced does not mean warehouse-scale. It means sophisticated questions on table sizes Excel still tolerates—tens or hundreds of thousands of rows—not millions.
Dynamic Arrays and Modern Formulas
Dynamic arrays changed microsoft excel data analysis by letting one formula spill results across a range—FILTER, SORT, UNIQUE, SEQUENCE, and combinations that replace fragile array-entry shortcuts. A single FILTER formula can subset a table by region and product faster than copying criteria columns.
XLOOKUP and XMATCH reduce brittle column-index math. LET names intermediate calculations inside a formula, improving readability on complex microsoft excel data analysis sheets. Together these functions reduce manual dragging—the source of many spreadsheet errors.
Learn spill rules: formulas need empty space below and to the right; overwriting spill ranges breaks the model. Microsoft Learn Excel modules document dynamic arrays; practice on a copy before editing production workbooks.
LAMBDA and Reusable Logic
LAMBDA lets you define custom functions inside the workbook—useful when the same microsoft excel data analysis calculation appears in dozens of cells with slightly different parameters. Pair LAMBDA with NAME MANAGER entries so sheets call readable function names instead of nested IF trees.
Use LAMBDA when: (1) the logic is stable; (2) testers can compare outputs to a baseline; (3) the team agrees on naming conventions. Skip LAMBDA when only one person understands the definition and documentation is missing—opaque custom functions erode the transparency that makes microsoft excel data analysis trustworthy.
LAMBDA is not a substitute for version-controlled code. When logic must live in CI/CD with tests, graduate to Python and treat Excel as a consumer of exported results.
What-If Analysis and Solver
What-If tools—Data Tables, Scenario Manager, Goal Seek—support microsoft excel data analysis models where inputs drive outcomes: pricing elasticity, capacity planning, simple forecasts. Data Tables show how one or two inputs swing a result across a grid; Goal Seek finds the input needed to hit a target output.
Solver adds constrained optimization for linear and nonlinear problems small enough for desktop Excel. Define decision variables, an objective cell, and constraints; Solver searches within bounds. Document every assumption—Solver answers are only as credible as the model structure.
Practical example: a supply planner models monthly cost under three freight rates and two demand scenarios using Data Tables, then uses Solver to minimize cost subject to service-level constraints. The entire microsoft excel data analysis model fits one workbook shared with operations leadership. When the same optimization must run nightly on ERP, WMS, and carrier APIs with millions of rows, the logic becomes a Python job; Excel keeps the executive sandbox.
Power Query and Light Automation
Power Query is the automation backbone of modern microsoft excel data analysis. Record import and transform steps once; refresh when new files arrive. Office Scripts (where enabled) can repeat UI actions in the browser Excel; VBA still exists on desktop but raises governance flags in many enterprises.
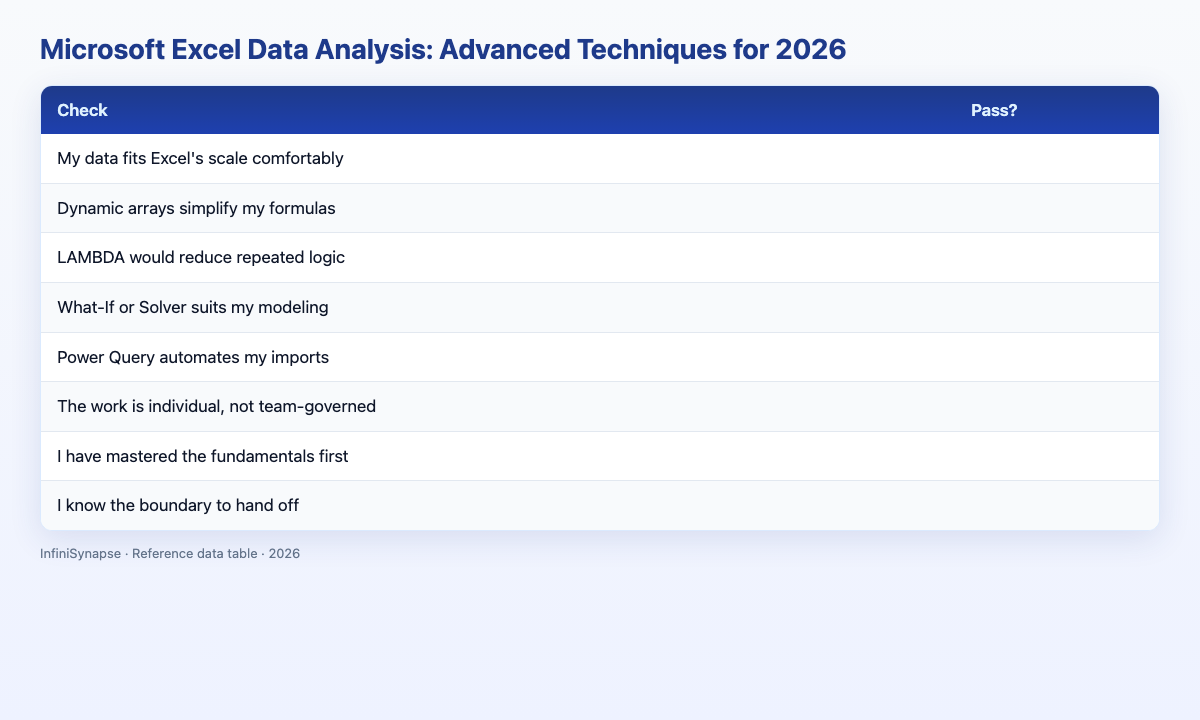
Prefer declarative Power Query steps over opaque macros. Each step appears in the Applied Steps list—closer to an audit trail than VBA hidden in binary workbooks. For recurring microsoft excel data analysis packs, store queries in templates with locked presentation sheets. The checks tab for that template is the analysis design excel checks sheet.
When refresh chains span five sources with different SLAs, Power Query alone struggles; that is when Power BI or scripted pipelines take over preparation while Excel hosts scenario views.
Team governance tip: store advanced microsoft excel data analysis templates on a read-only SharePoint library. Let analysts copy templates into working folders rather than editing the canonical file. That pattern preserves LAMBDA names, query steps, and Solver constraints without uncontrolled drift across departments.
Excel vs Google Sheets vs Power BI vs Python
Advanced microsoft excel data analysis competes with other surfaces depending on the bottleneck. Use the comparison below before investing weeks in workbook complexity. The Microsoft-only map is in Microsoft software for data analysis; this table is the cross-vendor view.
| Dimension | Excel | Google Sheets | Power BI | Python |
|---|---|---|---|---|
| Best for | Ad-hoc math, pivots, quick charts on modest tables | Lightweight collaboration and shared live sheets | Governed dashboards and recurring executive reporting | Custom statistics, ML, and reproducible pipelines |
| Data scale | Comfortable to ~500K rows; slows beyond | Similar ceiling; cloud row limits vary by plan | Warehouse-backed; millions of rows via models | Unlimited with engineering and compute |
| Collaboration | Desktop-first; co-authoring via OneDrive | Real-time multi-user editing native | Publish-and-consume dashboards for wide audiences | Notebooks and Git for technical teams |
| Statistics | Formulas plus optional Analysis ToolPak add-in | Built-in basics; fewer advanced stats | DAX modeling; not a full stats package | Full ecosystem (pandas, SciPy, statsmodels) |
| Automation | Macros, Power Query, Office Scripts | Apps Script | Scheduled refresh and semantic models | Scripts, schedulers, orchestration tools |
| Learning curve | Lowest; ubiquitous in business | Low; familiar grid metaphor | Moderate; data modeling concepts required | Steep; programming fluency expected |
Advanced microsoft excel data analysis wins when stakeholders need inspectable scenario models and fast what-if tweaks. Power BI wins recurring dashboards; Python wins production optimization and custom methods at scale.
Consider a skills ladder for power users: dynamic arrays first, then Power Query, then LAMBDA, then Solver. Skipping steps produces fragile models that look advanced but break when a single column name changes in the source export.
The Boundary of Advanced Excel
Even expert microsoft excel data analysis hits boundaries. Files that recalc for minutes, models nobody dares edit, and optimization macros that fail silently on edge cases are signals to stop adding complexity. Multi-source joins with different refresh cadences belong in a warehouse layer, not hidden Power Query folders.
IBM's augmented analytics overview describes how enterprises separate exploratory spreadsheets from governed metrics. The Stanford HAI AI Index notes rising use of agents for repetitive preparation—work advanced Excel users still do manually today.
Run a quarterly complexity audit on power-user workbooks: count hidden sheets, external links, and VBA modules. If the inventory grows faster than documented use cases, freeze new features until someone maps which cells executives actually read. Complexity without audience is a maintenance liability.
Keep advanced Excel for negotiation surfaces and executive sandboxes. Promote stable metrics to semantic models; promote stable code to Git.
Document every advanced model like a mini product: owner, refresh cadence, input sources, and known limitations. Microsoft excel data analysis at power-user depth still fails when only one person understands the workbook and they are on vacation during month-end close.
Selection Scorecard
Evaluate your next advanced microsoft excel data analysis investment (1 point each):
| Check | Pass? |
|---|---|
| Inputs, logic, and outputs live on separate sheets | |
| Dynamic arrays or LAMBDA reduce error-prone dragging | |
| Power Query handles refresh without manual steps | |
| What-If or Solver assumptions are documented | |
| Colleagues can edit the model without breaking it | |
| Row counts still perform acceptably | |
| I know which metrics will move to Power BI later | |
| Critical logic has an owner and review cadence |
6–8: advanced microsoft excel data analysis is healthy. 3–5: simplify before adding features. Below 3: restructure or graduate to BI/code.
Before adopting LAMBDA-heavy models org-wide, pilot with two analysts maintaining the same workbook for a month. If both can refresh queries and explain Solver constraints without calling the author, the pattern is ready to standardize.
Practical Next Steps
Verify against real job postings
Before committing time or budget, pull five recent job postings in your target market and list the SQL, visualization, and communication skills each repeats. Align your learning plan to those patterns rather than a generic syllabus. Many postings that say Microsoft software for data analysis mean Excel first, then Power BI if the team already publishes dashboards.
Frequently Asked Questions
What Microsoft software is used for data analysis?
Microsoft software for data analysis usually means Excel (often with Analysis ToolPak and Power Query), Power BI for governed reports, and Microsoft Fabric when the estate needs a lakehouse plus engineering. SQL Server or Azure Analysis Services appear when IT owns the semantic model. Excel is the starting product, not the whole stack.
Is Excel the only Microsoft software for data analysis?
No. Excel is the grid. Power BI, Fabric, Copilot add-ons, and warehouse SKUs are also Microsoft software for data analysis. Stay in Excel for inspectable what-if models; leave Excel when refresh cadence, row counts, or certified metrics require a platform.
How much does Microsoft software for data analysis cost?
Excel rides a Microsoft 365 seat. Analysis ToolPak is a free Excel add-in. Power BI Pro is a per-user list seat; Fabric and Power BI Premium are capacity-priced. Copilot is an add-on on eligible Microsoft 365 seats. Confirm the current SKU on the vendor page—the table above is a Sep 2026 public-list snapshot, not a quote.
What counts as advanced Microsoft Excel data analysis?
Advanced microsoft excel data analysis includes dynamic arrays, LAMBDA custom functions, What-If and Solver modeling, and Power Query automation—techniques beyond basic pivots and single-cell formulas.
Should I learn VBA or Power Query first?
Learn Power Query first for repeatable microsoft excel data analysis imports and transforms. Add VBA or Office Scripts only when UI automation is truly required and governance allows it.
When is advanced Excel enough?
When data is modest, models need inspectable what-if scenarios, and refresh stays within Power Query's comfort zone. Microsoft excel data analysis at advanced depth is not enough for warehouse-scale production pipelines.
How does advanced Excel compare to Python?
Excel wins transparency and speed for stakeholder-facing models; Python wins reproducibility, testing, and scale. Many teams prototype advanced microsoft excel data analysis then codify stable logic in Python.
What is the first advanced feature to learn?
Start with dynamic arrays and Power Query—highest maintainability payoff for microsoft excel data analysis power users before LAMBDA or Solver.
Publish a one-page model map for any workbook that uses Solver or Data Tables. Decision makers should see which cells are inputs, which are outputs, and which constraints are non-negotiable—without opening the formula bar.
Conclusion
Microsoft software for data analysis starts with Excel and grows into Power BI or Fabric when the workbook is no longer the system of record. Advanced microsoft excel data analysis still rewards readable structure: dynamic arrays and LAMBDA reduce errors, What-If tools and Solver answer scenario questions, and Power Query automates refresh. Respect the ceiling—when models become fragile or data outgrows the grid, promote work to Power BI or Python.
Host a monthly office hour where power users demo one reusable technique. Shared patterns spread faster than policy memos and surface when the same workaround is reinvented in five departments—often a sign you need a template or a platform upgrade.
To practice the AI-era skills employers want, read what AI-native data analysis means and try the InfiniSynapse web app free on registration, no credit card required.
Keep a changelog tab in advanced workbooks listing query edits, new LAMBDA names, and Solver constraint changes. Future maintainers will thank you when month-end close leaves no time for archaeology.