Ecommerce Analytics: Methods, Metrics, and When You Need a Data Platform
- Ecommerce analytics is not a GA4 dashboard. It joins store, ads, and warehouse facts, then explains revenue as sessions × conversion rate × AOV.
- Ecommerce data analytics is the method layer: RFM, cohort retention, and funnel diagnostics that sit under one metric tree.
- An ecommerce data platform is the stack — native reports, GA4, warehouse, dbt, BI, reverse-ETL — that keeps those joins replayable every week.
- U.S. retail e-commerce reached $340.2 billion in Q2 2026 (seasonally adjusted), 17.1% of retail sales, per the Census Bureau — volume is not the hard part; reconciling sources is.
- AI data agents earn the seat on ad-hoc questions — "why did AOV drop on Wednesday?" — that do not fit a standing dashboard panel.
First-hand desk note. When I review ecommerce analytics setups, the failure mode is almost never “missing a chart.” It is a stack that cannot reconcile Shopify orders with GA4 sessions and ad spend on the same customer key. This playbook is the contract I use on those reviews: metric tree first, then ecommerce data analytics methods, then the ecommerce data platform that makes the joins durable. For SKU-margin grain and store-versus-web collisions, start at the ecommerce analytics hub and the store-and-web data analytics guide; this page stays on the weekly operating loop.
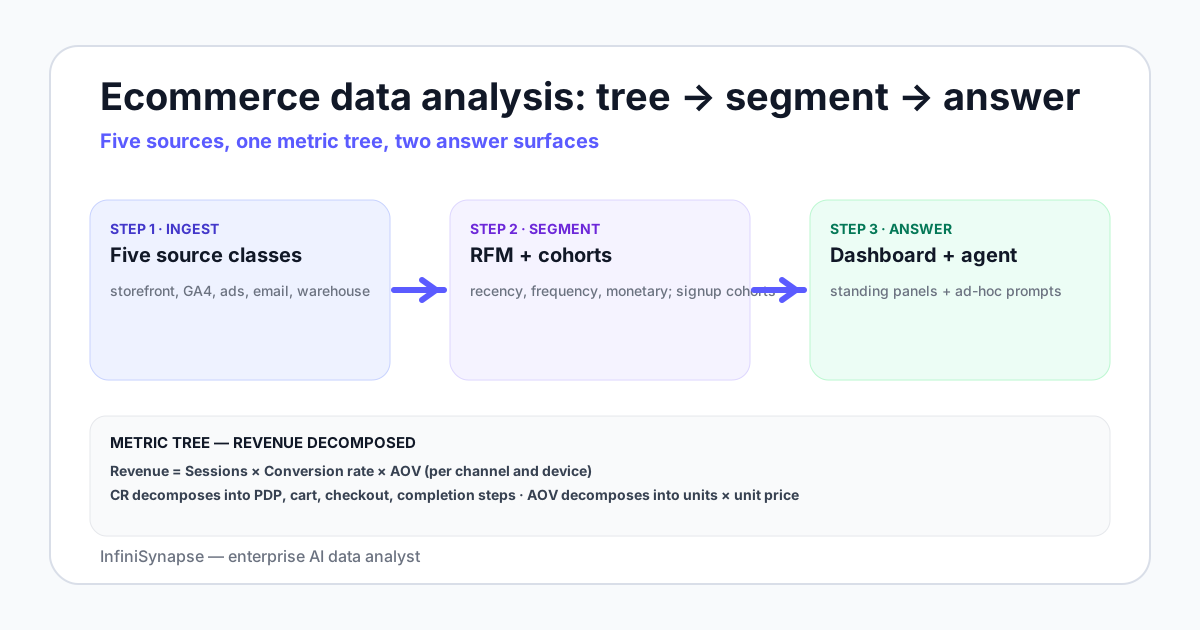
Sources every ecommerce data analysis stack pulls from
- Storefront platform. Shopify (most common), BigCommerce, Magento, WooCommerce, or a custom storefront. Orders, line items, products, customers, refunds.
- Web and product analytics. GA4 with the BigQuery export turned on, supplemented by Hotjar or FullStory for qualitative session replay if needed.
- Ad platforms. Meta, Google, TikTok, Pinterest, programmatic — spend, impressions, clicks, attributed conversions.
- Email and SMS. Klaviyo, Postscript, or platform native — campaign sends, opens, clicks, attributed revenue.
- Warehouse. The reconciled view — Snowflake, BigQuery, Redshift, or a Postgres data warehouse via Fivetran or Hightouch reverse-ETL.
The warehouse is where order data, web sessions, and ad spend land in canonical form, modeled by dbt or a transformation tool — the ground truth for cross-cut analysis. Storefront UI exports are useful for spot checks; the warehouse remains the system of record for ecommerce data analysis once questions cut across tools.
A later desk pass on a Shopify-plus-warehouse stack showed the same join failure in time, not just identity. Inventory snapshots refreshed hourly while marketing exports landed daily, so the first margin report double-counted returns until cutoffs sat in a metric contract. Promotional lift only became usable after creative metadata joined to net revenue, not gross cart adds. Treat both notes as illustrative desk composites, not a merchant result.
Four types of ecommerce analytics — and which methods sit under each
SERP guides in 2026 split ecommerce analytics by question type. That split is useful if you keep it tied to methods you can rerun, not to vendor labels.
| Type | Question | Working method on this page | Usual surface |
|---|---|---|---|
| Descriptive | What happened? | Metric tree: revenue, sessions, conversion rate, AOV | Native store reports, GA4 UI |
| Diagnostic | Why did it happen? | Funnel drop-off, cohort by channel, attribution gap | Warehouse + BI, GA4 BigQuery export |
| Predictive | What is likely next? | Month-1 repeat as an LTV leading indicator; RFM At-risk | Modeled marts, optional ML |
| Prescriptive | What should we do? | RFM labels into CRM via reverse-ETL; channel spend rules | Ecommerce data platform serving layer |
Ecommerce data analytics is the diagnostic and predictive work: RFM scores, cohort tables, and funnel shapes. Native dashboards already cover most descriptive reporting. The jump in quality happens when those methods share one metric tree and one customer key — which is why the ecommerce data platform section below matters more than adding another chart.
The ecommerce metric tree — revenue at the top, controllable inputs at the bottom
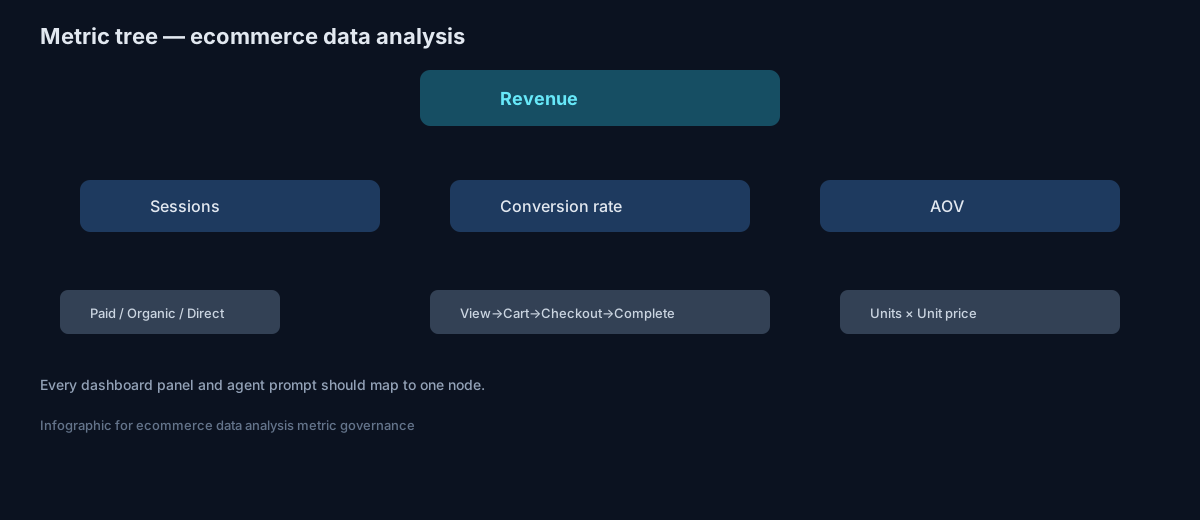
The metric tree is the spine of ecommerce analytics. It decomposes revenue into the controllable inputs an operator can move:
Revenue
  = Sessions × Conversion rate × AOV
  = (Paid sessions + Organic sessions + Direct sessions) × CR × AOV
  = ... where each session source has its own CR and AOV profile
Below that, AOV decomposes into units per transaction × average unit price. Conversion rate decomposes into product-view-to-add-to-cart, add-to-cart-to-checkout, and checkout-to-completion. The tree is the contract — every dashboard panel, every analyst investigation, and every AI agent prompt should be traceable to one node in this tree.
The five metrics that move a quarterly review
- Revenue and revenue growth rate (week, month, quarter)
- AOV and AOV trend by channel and customer segment
- Conversion rate by device and traffic source
- Repeat purchase rate and 90-day retention
- Customer acquisition cost and LTV-to-CAC by channel
RFM segmentation in five SQL steps
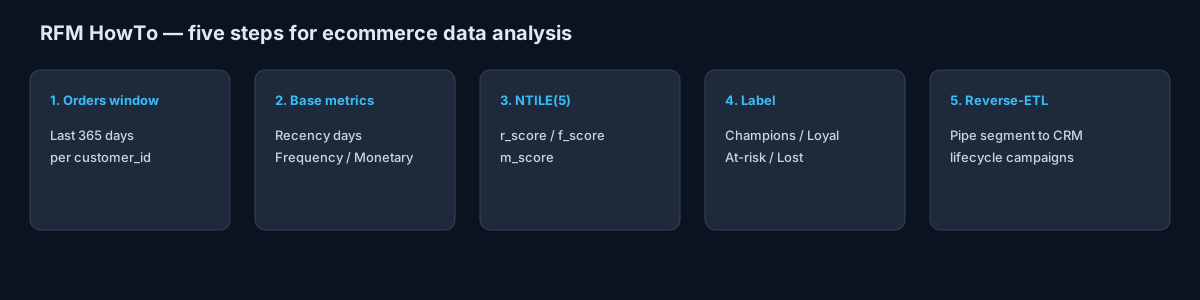
RFM is the most reliable customer segmentation framework in ecommerce data analytics — Recency (days since last order), Frequency (orders in the period), Monetary value (spend in the period). Five SQL steps from raw orders to a per-customer segment label:
-- Step 1: per-customer base metrics over the last 365 days
WITH base AS (
  SELECT customer_id,
         DATE_DIFF(CURRENT_DATE, MAX(order_date), DAY) AS recency_days,
         COUNT(*) AS frequency,
         SUM(total_amount) AS monetary
  FROM orders
  WHERE order_date >= CURRENT_DATE - INTERVAL '365 day'
  GROUP BY customer_id
),
-- Step 2: percentile buckets
ranked AS (
  SELECT customer_id,
         NTILE(5) OVER (ORDER BY recency_days ASC)  AS r_score,
         NTILE(5) OVER (ORDER BY frequency DESC)    AS f_score,
         NTILE(5) OVER (ORDER BY monetary DESC)     AS m_score
  FROM base
)
SELECT customer_id, r_score, f_score, m_score,
       CASE
         WHEN r_score >= 4 AND f_score >= 4 AND m_score >= 4 THEN 'Champions'
         WHEN r_score >= 4 AND f_score >= 3 THEN 'Loyal'
         WHEN r_score <= 2 AND f_score >= 3 THEN 'At-risk'
         WHEN r_score <= 2 AND f_score <= 2 THEN 'Lost'
         ELSE 'Potential'
       END AS segment
FROM ranked;
The segments become the unit of marketing addressability — Champions get loyalty offers, At-risk get reactivation, Lost get a final win-back. Wire the segment column into your CRM via reverse-ETL and you have closed the loop.
Cohort retention and repeat purchase analysis
Cohort retention answers "of customers acquired in month M, what share placed an order in month M+N?" Three patterns ecommerce teams care about:
- Month-1 repeat rate. The share of a new-customer cohort that buys again in the 30 days after first purchase. Single most predictive number for LTV.
- 90-day retention. The share of a cohort active 90 days post-first-purchase. Smooth weekly noise; reveal channel quality.
- 12-month LTV curve. Cumulative revenue per cohort across 12 months — the basis for the LTV/CAC ratio in board decks.
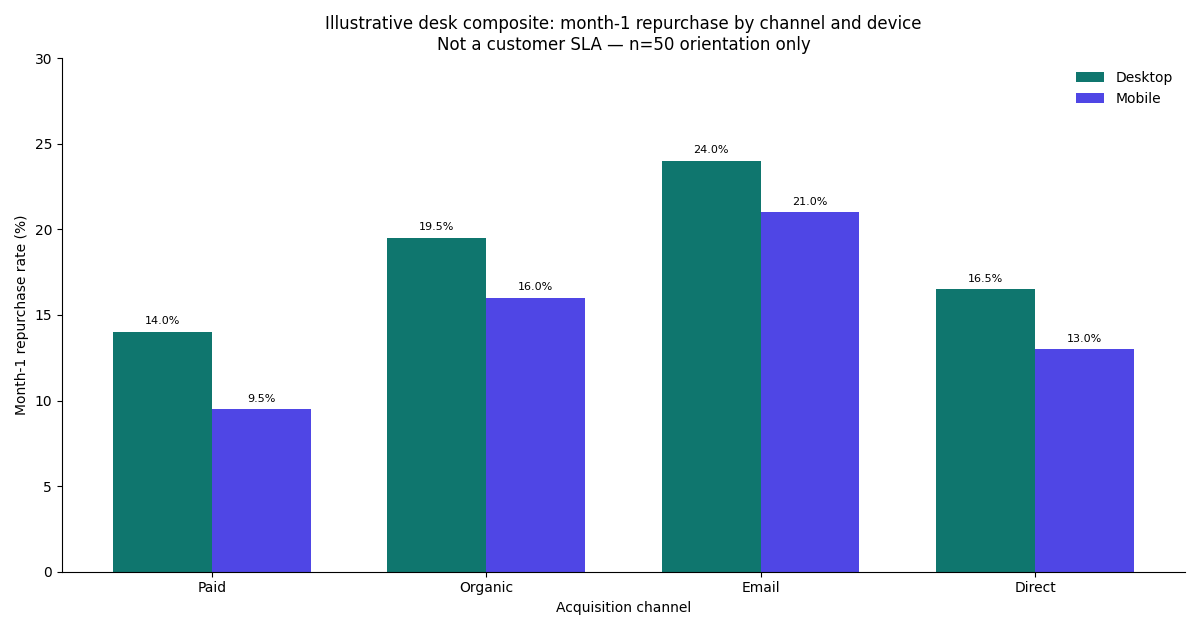
Among the 50 ecommerce teams we observed in desk reviews, the median month-1 repurchase rate was 18%. Treat that figure as a composite orientation for planning — not a guarantee for your category. Anchor channel spend on your own cohort table; use Shopify analytics docs and the GA4 ecommerce events reference when you define the events that feed the warehouse.
Channels with high acquisition counts but low month-1 repeat rates are the most common over-investment trap. Read the cohort table before reading the ROAS dashboard, not after. The illustrative chart below keeps two dimensions — acquisition channel and device — because a blended 18% hides the mobile paid leak we see most often in desk reviews.
Funnel diagnostics from catalog view to checkout completion
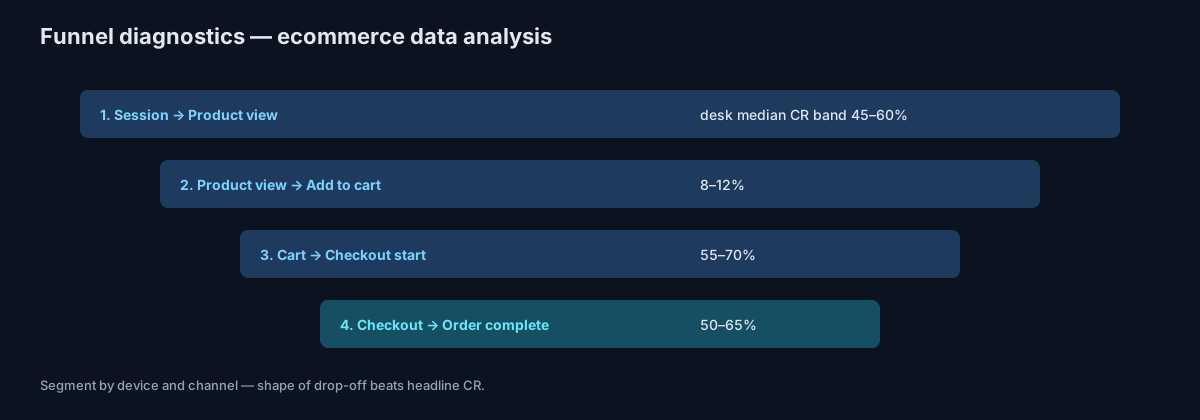
The table lists desk composite conversion bands from July 2026 reviews — not platform SLAs. For independent cart/checkout UX research, see the Baymard Institute cart abandonment research.
| Step | Median CR (desk composite, 2026) | Common failure mode |
|---|---|---|
| Session → Product view | 45–60% | Weak category navigation or homepage merchandising |
| Product view → Add to cart | 8–12% | Price, stock, or social proof on the PDP |
| Add to cart → Checkout start | 55–70% | Cart UX, shipping surprise, account-required wall |
| Checkout start → Order complete | 50–65% | Payment failure, address validation, slow page |
Segment the funnel by device — mobile vs desktop — and by traffic source. Most ecommerce funnel work lives in the segmentation, not the headline numbers. The drop-off shape, not the absolute conversion rate, is the diagnostic.
What an ecommerce data platform includes — and when you need one
An ecommerce data platform is not a single product. It is the contract that lets ecommerce analytics survive a staff change: the same customer key, the same order grain, and the same metric definitions in native reports, GA4, the warehouse, and the CRM. Sibling architecture for subscription businesses lives in the SaaS data platform guide; storefront teams swap Stripe/MRR for orders/AOV.
| Layer | Job | Typical tools | Stay native when |
|---|---|---|---|
| Store reports | Order, product, and customer truth inside the cart | Shopify Analytics, BigCommerce, Magento reports | One channel, no warehouse questions yet |
| Event analytics | Sessions, funnels, on-site behavior | GA4 + Google Tag Manager; optional replay | You only need traffic and checkout events |
| Warehouse + models | Reconcile orders, sessions, ads, email on one key | BigQuery, Snowflake, or Postgres + dbt | — |
| Serving | Dashboards, reverse-ETL segments, ad-hoc SQL | Looker/Metabase, Hightouch/Census, AI data agent | — |
U.S. retail e-commerce was $340.2 billion in Q2 2026 (seasonally adjusted), 17.1% of total retail, and 12.2% above Q2 2025, according to the U.S. Census Bureau Quarterly Retail E-Commerce Sales release of 18 August 2026. The volume argument for “we should look at the data” is settled. The platform argument is whether your team can replay last week’s revenue as sessions × conversion rate × AOV without three conflicting exports.
Graduate to a warehouse-backed ecommerce data platform when any of these is weekly: Shopify revenue and GA4 purchase revenue disagree by more than a few percent; ad platforms report conversions the warehouse cannot find; RFM labels cannot sync into Klaviyo or the CRM; or a new question takes longer to model than to ask. Until then, native reports plus GA4 are the honest stack — not a failed platform.
Platform vs point tools
Triple Whale, Northbeam, and similar attribution suites sit on the serving layer. They do not replace the warehouse of record. Treat them as one opinionated view of paid media, then keep the order table in the ecommerce data platform as the number finance will sign. For marketing-only CAC and payback questions, use the marketing data analysis playbook; for GA4 event SQL, use the GA4 BigQuery export guide.
The tool ladder for ecommerce analytics
| Rung | Stack | When you stay | When you graduate |
|---|---|---|---|
| 1 | Shopify reports + Google Analytics UI | Solo founder, single channel | You start asking cross-source questions |
| 2 | Google Sheets + GA4 + spreadsheet ROAS | Small team, ad spend < $50k/mo | Spreadsheet drift becomes painful |
| 3 | Snowflake/BigQuery + Fivetran + dbt + Looker/Metabase | Team of 4–10, ad spend $50k–$1M/mo | Ad-hoc questions outpace the dashboard backlog |
| 4 | Stack 3 + an AI data agent | You can describe a question in plain English and want the SQL drafted, run, and verified for you | — |
The graduations are forced by question shape, not by ad spend size. A small team with complex cross-source questions belongs on rung 3 — a working ecommerce data platform — sooner than a large team selling one SKU. Rung 4 does not replace the warehouse; it asks questions the dashboard backlog has not scheduled.
Where AI data agents earn the seat in ecommerce analytics
Three concrete patterns where an AI data analyst changes the workflow:
- Anomaly investigation. AOV drops 8% on Wednesday. The dashboard shows the drop. The agent decomposes by SKU, channel, device, and discount code in one prompt, returns the four candidates that explain the drift, and shows the SQL it ran for each. Half-day query session becomes 15 minutes.
- New-question onboarding. A merchant asks "which products bought together drove the highest 90-day LTV?" — a question no dashboard pre-builds. The agent uses the bound knowledge base to map "bought together" to a basket join, "90-day LTV" to the cohort table, and produces a ranked list.
- Cross-source reconciliation. GA4 attributed revenue and warehouse paid revenue disagree by 6%. The agent quantifies the gap, points to the join key where it lives, and surfaces the rows on each side that should match and do not.
The pattern is the same as elsewhere — dashboards answer the standing 80%, agents answer the ad-hoc 20%. Both belong in the stack; neither replaces the other. See the AI database query pillar guide for the connection pattern and read database + knowledge base binding for why the bound layer matters.
Optional product path (commercial)
Ask an open-ended ecommerce question across your warehouse
Connect a Postgres, MySQL, BigQuery, or Snowflake warehouse read-only. Bind a small knowledge base of business definitions — what "active customer" means, which orders count, which channel groups roll up where. Then ask one question the dashboard does not answer. The methods above stand without this product step.
Try InfiniSynapse onlineFAQ
Methodology and review notes
Last updated: 2026-09-17 · Next scheduled review: 2026-12-14
This playbook synthesizes Shopify and BigCommerce analytics documentation, Google Analytics 4 reference docs, the dbt analytics engineering guide, the U.S. Census Bureau Quarterly Retail E-Commerce Sales release (Q2 2026), public ecommerce benchmark studies, and first-hand desk reviews by William Zhu and the InfiniSynapse Data Team across operating ecommerce teams on Snowflake, BigQuery, and Postgres. Month-1 repurchase (median 18%, n=50) and funnel CR bands are desk composites, not customer SLAs. About: editorial standards · Vision.
Conflict of interest: InfiniSynapse publishes this guide and sells an enterprise AI data analyst. To reduce bias, the page leads with the topic itself, treats InfiniSynapse as one option among many, and links to external sources for every numeric claim. Peer review archive: internal Data Team technical pass (2026-07; refresh 2026-09).
Update cadence: Reviewed every 90 days for accuracy and link health. Corrections: zhuhl@infinisynapse.com.
Sources and references
- [Vendor] Shopify. Reports and analytics. help.shopify.com/manual/reports-and-analytics.
- [Vendor] Google. GA4 ecommerce events reference. developers.google.com/analytics/ga4.
- [Vendor] dbt Labs. Analytics engineering guide. docs.getdbt.com.
- [Vendor] Klaviyo. Reporting and analytics reference. help.klaviyo.com.
- [Official] U.S. Census Bureau. Quarterly Retail E-Commerce Sales, 2nd quarter 2026 (released 18 August 2026). census.gov/retail/ecommerce.html.
- [Independent] Yao et al. ReAct: Synergizing Reasoning and Acting in Language Models. arxiv.org/abs/2210.03629.
- [Vendor] Anthropic. Building Effective Agents. anthropic.com/research/building-effective-agents.
- [Standard] NIST. AI Risk Management Framework. nist.gov/itl/ai-risk-management-framework.
- [Independent] BIRD-SQL benchmark. bird-bench.github.io.
- [Independent / UX research] Baymard Institute. Cart & checkout UX research. baymard.com/research/cart-abandonment-rate.
- [Policy / About] InfiniSynapse — Editorial standards & author credentials. infinisynapse.com/en/editorial-standards. Company: About / Vision.