Big Data Visualization Services: Scope the Volume
By the InfiniSynapse Data Team · Published: 2026-07-15 · Last updated: 2026-10-12 · Next review: 2026-10-29 · About / Team: https://infinisynapse.com/en/editorial-standards (#about)
Named authors & credentials (Authority): William Zhu — InfiniSynapse cofounder; public professional background: GitHub @allwefantasy (InfiniSQL / open-source data systems). Desk contact: zhuhl@infinisynapse.com. Reviewer qualification frames: analytics engineering, data platform, editor. Traceable org authority: About / team · InfiniSynapse on GitHub.
Disclosure: we build InfiniSynapse, an AI-native Data Agent platform. This guide explains data visualization services as a build-versus-buy decision; InfiniSynapse appears only where AI-native analysis changes the services brief.
External validation status. Third-party category / peer signals (not InfiniSynapse product claims): Gartner Peer Insights — Analytics & BI Platforms, Gartner Peer Insights — Data and Analytics Service Providers, G2 Analytics Platforms, BARC research, NIST AI RMF, ISO/IEC 42001, AWS Well-Architected Framework, IBM augmented analytics. Peer-review archive: editorial standards. This page is vendor-affiliated; it is not a commissioned independent audit.
Table of Contents
- TL;DR
- How We Frame Them
- What They Are
- Big Data Visualization Services
- What They Cover
- Industry scenarios
- When They Fit
- Choosing a Provider
- Where the Market Came From
- Common Pitfalls
- Services in the Age of AI
- Readiness Scorecard
- Common Misconceptions
- Frequently Asked Questions
- Who wrote this
- References
- Conclusion
TL;DR
Direct answer: Big data visualization services fit when the missing piece is the view. Name volume, refresh, and the audience before you hire. Data visualization services are outside providers — agencies, consultancies, or freelancers — that design and build charts, dashboards, and reports for organizations that lack the in-house skill, time, or capacity. In 2026 they fit occasional, high-craft work you cannot justify hiring for full-time, and fit poorly when visualization is an ongoing core need better owned in-house.
Who this is for: leaders weighing data visualization services against building in-house in 2026.
What you'll learn: definitions of data visualization services, coverage (design / build / strategy / training), industry scenarios, provider selection, and how AI shifts the services brief.
This guide sits under the data visualization hub. Software side: data visualization software. Tools: data visualization tools. Related: best AI data visualization tools.
How We Frame Them
We frame data visualization services as a build-versus-buy decision. Governance and residual risk when AI touches reporting should map to the NIST AI Risk Management Framework [1]. Category buyer signals for analytics platforms and D&A services — not our product claims — include Gartner Peer Insights — Analytics & BI [2], Gartner Peer Insights — Data and Analytics Service Providers [3], G2 Analytics Platforms [4], and BARC research [5]. We also anchor craft versus automation to IBM's augmented analytics overview [6] and production AI guidance in Google Vertex AI documentation [7].
| Offering | What you get |
|---|---|
| Design | Charts and layouts |
| Dashboards | Built, interactive views |
| Consulting | Strategy and standards |
| Training | In-house skill transfer |
Desk log (InfiniSynapse Data Team, July 2026 — labelled internal intake review, not a market survey): across eight anonymized mid-market briefs asking whether to hire data visualization services, five failed the readiness scorecard on “gap not named precisely” before any vendor call. Where the primary gap was design craft (not data engineering), teams chose services-then-maintain in six of eight cases, citing a target of an executive pack in under six weeks. Treat these counts as a desk signal for intake quality, not as industry prevalence.
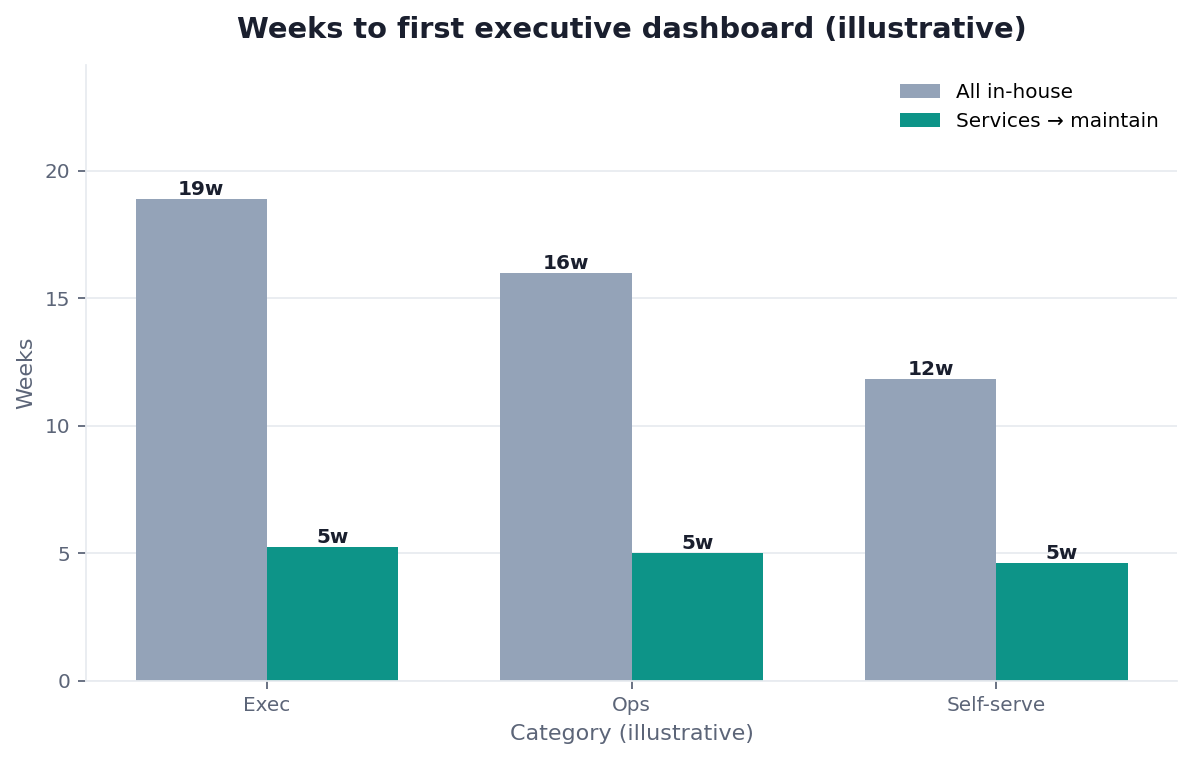
Scope note: Patterns from mid-market and enterprise intakes in 2026 — not legal counsel, not a census of every industry.
What They Are
At their core, data visualization services are rented visualization expertise — design and production of charts, dashboards, and reports to a standard your team may not reach alone. Closely related concepts in the public knowledge graph: data visualization [8] and business intelligence [9].
Key Definition: data visualization services are professional offerings from external providers — agencies, consultancies, or freelancers — that design, build, and sometimes maintain charts, dashboards, and reports on behalf of an organization, sometimes with strategy or training the organization lacks internally.
They exist because good visualization blends design, technical implementation, and domain understanding that many organizations need only occasionally and cannot justify as a full-time hire.
Big Data Visualization Services
Big data visualization services fit when the missing piece is the view. Name volume, refresh, and the audience before you hire.
What big data visualization services are
Big data visualization services are external teams that design charts, dashboards, and reports on data a warehouse can already query. Volume, velocity, and variety use the same vocabulary as the NIST Big Data Interoperability Framework, Volume 1. This page sets no row-count cutoff. The shorter phrase data visualization services still means that outside provider. The big-data qualifier asks whether the provider is drawing a view the platform can already answer.
When the gap is the view
A visualization service belongs after the pipeline, the model, and the permissions can already answer the question. When those are still open, start with the readiness scorecard and when they fit. The stack that feeds the view is covered in big data analytics tools.
Who the chart is for
Executives, operators, and analysts each need a view. The industry scenarios below — financial compliance, supply chain, healthcare, marketing, and manufacturing — stay. The role is a second cut on the same brief: one audience per dashboard.
Advisory, build, and support
Advisory sets the metric and the audience. That work is strategy. Build connects the dashboard to warehouse or semantic-layer refresh and access, and it includes the chart design. Support hands maintenance back through training. A proposal may label the same work advisory, build, and support. The scope still maps to the four sub-offerings in what they cover.
What goes in the brief
Write the order of magnitude, the refresh cycle, who may see the view, and whether the handoff is a dashboard or a maintainable model. Price and vendor rank stay on the buyer’s own shortlist.
What stays in-house
Routine charts can move back in-house. Services stay on high-craft design and on handoffs across layers. See services in the age of AI.
What They Cover
Implementation on modern warehouses often follows Snowflake documentation [10]. When AI-assisted delivery is in scope, ISO/IEC 42001 [11] is a useful procurement frame for AI management expectations.
Data visualization services usually span four sub-offerings. Matching the label to the gap matters more than brochure breadth:
- Design
- Chart types, layout, typography, and visual hierarchy for reports or presentations — craft without necessarily owning your data stack.
- Build
- Technical implementation of interactive dashboards on your warehouse, semantic layer, or BI platform, including refresh, access control, and handoff docs.
- Strategy
- Visualization standards, metric storytelling rules, dashboard portfolio design, and governance for who may publish what.
- Training
- Skill transfer so your analysts can maintain and extend the work — the difference between a deliverable and a capability.
A design agency and a technical implementation consultancy both sell “visualization services” but close different gaps. Name the gap before you shortlist.
Industry scenarios
Typical industry engagements for data visualization services — where the SOW is usually clearer than a generic “dashboard project” (illustrative, not exhaustive):
Financial compliance and risk dashboards
Regulatory and board packs that need clear variance, limit breaches, and audit-friendly annotations — high craft, intermittent refresh cadence, strong case for a specialized design/build engagement with documented maintenance.
Supply-chain operations boards
Kanban-style views for inventory, OTIF, and exception queues across plants or 3PLs — often a build problem (joins + freshness) more than a pure design problem.
Healthcare quality and operations
Census, length-of-stay, and quality-indicator boards for clinical ops — specialty domain language; services fit when in-house BI capacity is thin and the audience is non-technical.
Marketing funnel and campaign performance
Multi-channel attribution visuals for leadership reviews — fit services for a one-time redesign of a messy pack; keep weekly refresh in-house or on an AI-native stack.
Manufacturing OEE and plant-floor views
Line, shift, and downtime visuals — usually owned by ops engineering after an initial standards engagement; avoid perpetual agency dependence for daily boards.
When They Fit
Data visualization services fit best for occasional, high-stakes, or specialized needs — a polished investor dashboard, a one-time report redesign, a visualization strategy — where quality is high and frequency is low.
When visualization is constant and core, building in-house usually wins on cost and responsiveness. Match the solution to the need the way the pandas documentation [12] stresses clarity of intent: frequency and centrality decide the buy, not abstract preferences for agencies.
Choosing a Provider
Production architecture reviews should still respect the AWS Well-Architected Framework [13] when dashboards sit on cloud data platforms.
Choosing among data visualization services starts with naming your gap — design, build, strategy, or training — then matching a provider’s portfolio to that gap. Prefer work samples for similar audiences; decide up front whether you want a one-time deliverable or lasting capability. A beautiful dashboard you cannot maintain solves half the problem; documentation and training close the rest. For adjacent software evaluation, see data visualization software.
Where the Market Came From
The market for data visualization services grew as data outpaced ordinary teams’ design and tool skills. Demand for data visualization services rose with every wave of BI tooling that made charts possible but not automatically clear. Spreadsheets held numbers; professional visuals needed specialized craft, so design shops, implementation consultancies, and trainers fragmented to fill different gaps. AI now lowers the barrier for routine charts, which is why the buy brief is shifting toward high-craft design and strategy rather than everyday bar charts.
Common Pitfalls
When services engagements touch AI-generated visuals or connectors, use an external control reference such as the ENISA multilayer framework for AI cybersecurity practices [14].
The main failure mode for data visualization services is buying a deliverable when you needed a capability — then paying for every revision. The second is mismatching the provider (design agency for integration work, or vice versa). Name the gap, judge by relevant portfolio, and decide deliberately between output and skill transfer.
Services in the Age of AI
AI is reshaping data visualization services by lowering the skill barrier for routine charts from plain-language questions.
We explore this in what AI-native data analysis means. In the InfiniSynapse web app, an agent can analyze across sources and render fitting charts from a question, so services are pushed toward specialized craft and strategy while everyday chart-building moves in-house. Independent ABI platform reviews on Gartner Peer Insights [2] are useful for platform renewal patterns; they are not a substitute for judging a services SOW.
Readiness Scorecard
Secure AI delivery guidance from the UK NCSC secure AI system development guidelines [15] is a useful checklist when providers use generative tools on your data.
Assess a services engagement (1 point each):
| Check | Pass? |
|---|---|
| The gap is named precisely | |
| The provider's strength matches it | |
| The need is occasional or specialized | |
| Portfolio fits your need | |
| You know if you want output or skill | |
| Maintenance is planned | |
| In-house build was compared | |
| AI-native options were considered |
6–8: a sound engagement for data visualization services. 3–5: clarify the gap. Below 3: reconsider build vs buy — the pattern behind five of eight failed intakes in our July 2026 desk log.
Common Misconceptions
- Services are always better than in-house — only for occasional or specialized needs.
- All visualization services are alike — design, build, strategy, and training differ sharply.
- A deliverable equals a capability — a dashboard you cannot maintain is not one.
- AI makes all services obsolete — it shifts them toward specialized craft.
Frequently Asked Questions
What are big data visualization services?
Big data visualization services fit when the missing piece is the view. Name volume, refresh, and the audience before you hire. They are external teams that design charts, dashboards, and reports on data the warehouse can already query.
What are data visualization services?
Data visualization services are outside providers (agencies, consultancies, freelancers) that design, build, and sometimes maintain charts, dashboards, and reports — rented expertise for gaps you cannot justify hiring full-time. See What They Are.
What do they cover?
Four sub-offerings: design, build, strategy, and training. Match the SOW to the gap; see the definition list in What They Cover.
When do they fit?
Occasional, high-stakes, or specialized work. Constant core visualization usually belongs in-house. Use the Readiness Scorecard.
How do I choose a provider?
Name the gap, judge portfolio fit, and decide deliverable vs skill transfer before comparing brochures. Architecture on cloud warehouses should still align with AWS Well-Architected [13].
How is AI changing them?
Routine charts move in-house via AI-native tools; services concentrate on high-craft design and strategy. Background: AI-native data analysis.
Should I hire a service or build in-house?
Decide by frequency and centrality when choosing data visualization services versus an internal hire. A middle path is services that also train or document so the capability stays. For software shortlists, see best AI data visualization tools.
Who wrote this
Named author. William Zhu — InfiniSynapse cofounder. Public engineering profile: GitHub @allwefantasy. Org: github.com/InfiniSynapse.
About / Team. InfiniSynapse Data Team · About page · full standards: https://infinisynapse.com/en/editorial-standards.
Desk experience. The July 2026 eight-brief intake log above was reviewed under William Zhu’s engineering accountability; corrections: zhuhl@infinisynapse.com · corrections policy.
Suggested citation
APA (7th): InfiniSynapse Data Team. (2026, July 29). Big data visualization services: Scope the volume. InfiniSynapse. https://infinisynapse.com/en/blog/data-visualization-services
References
- [Standard] NIST. AI Risk Management Framework (AI RMF 1.0). nist.gov
- [Independent] Gartner Peer Insights. Analytics and Business Intelligence Platforms. gartner.com
- [Independent] Gartner Peer Insights. Data and Analytics (services / related markets). gartner.com
- [Independent] G2. Analytics Platforms. g2.com
- [Independent] BARC. Research overview. barc.com/research
- [Reference] IBM. What is augmented analytics? ibm.com
- [Docs] Google Cloud. Vertex AI documentation. cloud.google.com
- [Reference] Wikipedia. Data visualization. en.wikipedia.org
- [Reference] Wikipedia. Business intelligence. en.wikipedia.org
- [Docs] Snowflake. Documentation. docs.snowflake.com
- [Standard] ISO/IEC. 42001:2023 — AI management systems. iso.org
- [Docs] pandas. Documentation. pandas.pydata.org
- [Docs] Amazon Web Services. AWS Well-Architected Framework. docs.aws.amazon.com
- [Reference] ENISA. Multilayer framework for good cybersecurity practices for AI. enisa.europa.eu
- [Reference] UK NCSC. Guidelines for secure AI system development. ncsc.gov.uk
- [Docs] Amazon Web Services. Amazon Redshift documentation. docs.aws.amazon.com/redshift
- [Policy / About] InfiniSynapse. About the research desk & editorial standards. infinisynapse.com/en/editorial-standards
- [Person] William Zhu. Cofounder, InfiniSynapse — public engineering profile. github.com/allwefantasy
Conflict-of-interest note: InfiniSynapse sells an AI-native analytics platform that can reduce demand for routine chart services; recommendations are framed as a build-versus-buy rubric, not a vendor ranking of agencies.
Conclusion
Data visualization services are rented expertise — design, build, strategy, and training — that fit occasional or specialized needs and fit poorly for constant core work. In 2026, name your gap before you buy data visualization services, match portfolio to that gap, write maintenance into the SOW, and let AI-native tools absorb routine charts so services spend stays on craft that still needs humans.