Data Analytics Software Compared (2026)
By the InfiniSynapse Data Team · Last updated: 2026-09-24 · We build an AI-native data analysis platform and work across analytics stacks daily; this guide compares data analytics software in 2026 by category and decision, not by brand ranking.
Table of Contents
- TL;DR
- Comparison at a Glance
- How We Compare Software
- 10 Software Options
- Best Software by Use Case
- Features, Integrations, and Scale
- Pricing and Total Cost
- Governance, Security, and Deployment
- Real-Data Trial
- Readiness Scorecard
- Frequently Asked Questions
- Conclusion
TL;DR
Direct answer: This data analytics software comparison covers 10 representative options across spreadsheets, BI, open-source analytics, product analytics, and AI-native analysis. There is no universal winner: shortlist by use case, data sources, deployment, governance, operator skill, pricing model, and the evidence produced in a real-data trial.
Who this is for: analysts, data leaders, and buyers comparing analytics software for a real workflow.
What you'll learn: which tools fit each use case, how their operating models differ, what costs to verify, and how to run a defensible trial.
This guide sits under the data visualization hub.
For related categories, see data analytics tools.
Also see business analytics software. The practice those products serve is data analytics.
Data Analytics Software Comparison at a Glance
Use this matrix to create a shortlist, not to declare one universal winner. Product capabilities and commercial terms change; verify current documentation and quotes before purchase.
| Software | Category | Best for | Main strength | Main limitation | Pricing model |
|---|---|---|---|---|---|
| Microsoft Excel | Spreadsheet | Ad-hoc business analysis | Familiar formulas, pivots, and files | Manual governance and scale limits | Per-user subscription |
| Microsoft Power BI | BI platform | Microsoft-centered reporting | Modeling, dashboards, ecosystem fit | DAX and capacity complexity | Per user / capacity |
| Tableau | BI platform | Visual exploration and governed sharing | Mature visualization | Licensing and administration | Role-based subscription |
| Looker | Governed BI | Central metric definitions on cloud data | Semantic modeling | Modeling and platform expertise | Platform / user contract |
| Qlik Sense | BI platform | Associative exploration | Flexible discovery across related data | Administration and learning curve | Subscription / capacity |
| Domo | Cloud analytics | Integrated executive and operational BI | Broad cloud experience | Platform breadth can raise cost | Contract subscription |
| ThoughtSpot | Search analytics | Natural-language exploration | Search-led self-service | Requires governed, prepared data | Platform / consumption |
| Matomo | Product and web analytics | Privacy-focused digital analytics | First-party deployment options | Narrower than general enterprise BI | Cloud / self-hosted |
| Apache Superset | Open-source BI | SQL-capable self-hosted teams | Open source and broad database support | Team owns deployment and support | Open source / infrastructure |
| AI-native analysis platform | Agentic analytics | Repeated multi-source questions | Natural language, workflow reuse, automation | Must prove traceability and controls | User / usage / platform |
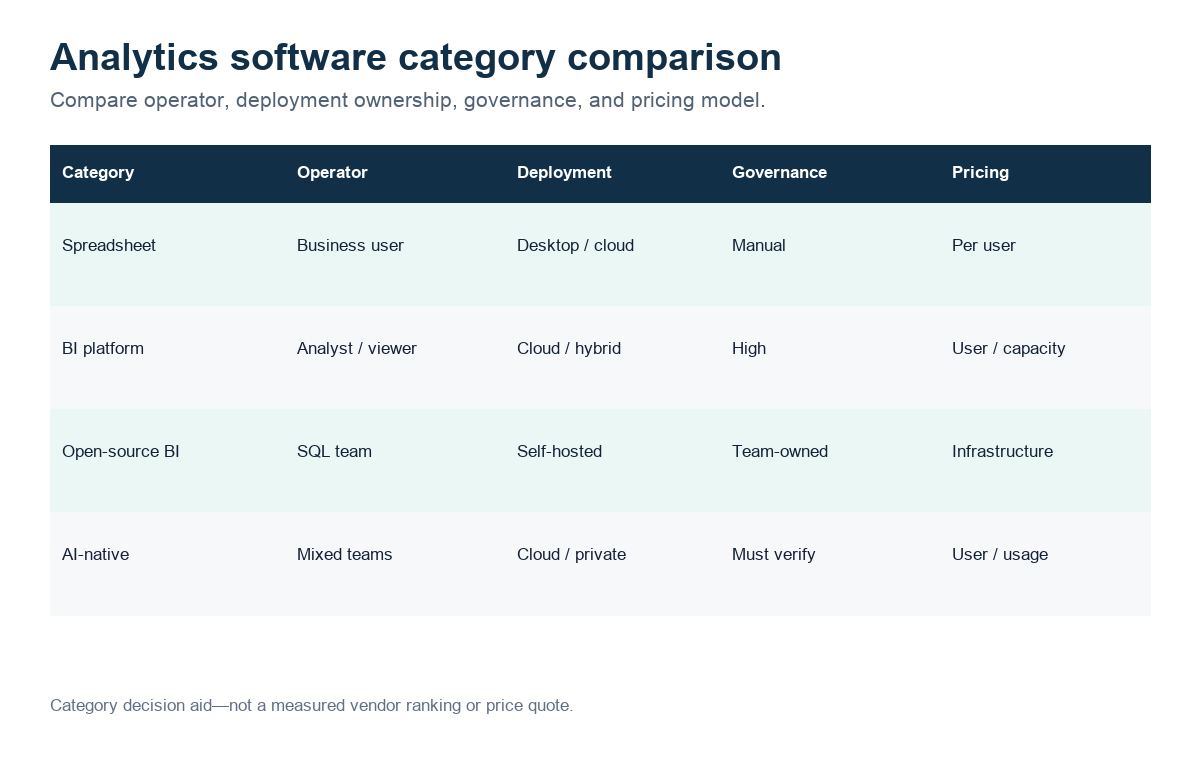
Figure: Category-level decision aid; not a measured product ranking.
How We Compare Software
This comparison uses one rubric for every option: primary job, intended operator, supported sources, deployment ownership, semantic controls, output traceability, collaboration, security, pricing model, and exit cost. It is a documented desk comparison based on public product information and category characteristics—not a claim that all products were benchmarked hands-on.
A credible shortlist records the documentation date and distinguishes observed trial results from vendor claims. For each candidate, write the task, dataset size, sources, completion time, corrections, query or formula visibility, sharing path, and second-run setup.
10 Data Analytics Software Options
Spreadsheets and desktop analysis
Excel remains useful when the dataset is bounded, operators already know the workflow, and the output must travel as a file. It becomes risky when repeated copy-paste, hidden formulas, or uncontrolled versions replace a governed pipeline.
BI and semantic platforms
Power BI, Tableau, Looker, Qlik, and Domo serve shared dashboards and governed consumption with different ecosystem, modeling, deployment, and licensing assumptions. Compare them on the same representative model—not a polished vendor demo. Confirm row-level security, refresh behavior, metric definitions, APIs, embedding, and administration.
Search, product, and open-source analytics
ThoughtSpot emphasizes search-led exploration; Matomo focuses digital analytics and privacy choices; Apache Superset gives SQL-capable teams an open-source BI surface. Their categories overlap, but their intended operators and operating burden differ substantially.
AI-native analysis
AI-native platforms can plan, query, explain, and repeat analysis across sources. They should be scored on inspectable SQL or logic, permission boundaries, citations to source data, correction handling, repeatability, and cost under real usage—not conversational fluency alone.
Best Software by Use Case
| Use case | Start with | Why |
|---|---|---|
| Quick local calculations | Excel | Lowest setup for bounded work |
| Microsoft enterprise BI | Power BI | Strong ecosystem alignment |
| Visualization-led analysis | Tableau | Mature visual exploration |
| Central semantic definitions | Looker | Model-first governed metrics |
| Associative exploration | Qlik Sense | Flexible relationship discovery |
| Cloud executive analytics | Domo | Integrated delivery experience |
| Search-led self-service | ThoughtSpot | Natural-language discovery |
| Privacy-focused web analytics | Matomo | First-party deployment options |
| Self-hosted SQL dashboards | Apache Superset | Open-source control |
| Repeated multi-source questions | AI-native platform | Workflow reuse and automation |
The right answer may be a stack. A warehouse, semantic layer, BI tool, notebook, and AI agent can serve separate jobs. Count integration and handoff costs before calling the stack “best of breed.”
Features, Integrations, and Data Scale
Compare native connectors, APIs, live-query and extract modes, refresh controls, transformation ownership, semantic definitions, embedding, alerts, collaboration, export formats, and observable query logic. Test the largest representative dataset and the highest expected concurrency; a demo-sized dashboard does not establish production fit.
Separate data scale from user scale. A tool may query large warehouse tables well but become difficult to govern across hundreds of creators, or support broad viewing while requiring specialist model authors.
Pricing and Total Cost of Ownership
Do not compare only advertised entry prices. Record viewer, creator, administrator, capacity, query, storage, connector, embedding, support, implementation, training, and infrastructure costs. Open-source software removes a license line but adds hosting, upgrades, monitoring, security, and staffing.
Use pricing models rather than unverified dollar amounts in a durable comparison. Ask vendors for a quote using expected users, concurrency, refresh frequency, embedded viewers, and data volume, then model a base and growth case.
Governance, Security, and Deployment
Evaluate cloud, self-hosted, and hybrid requirements; SSO and identity lifecycle; row- and column-level controls; audit logs; encryption; data residency; private networking; backup; deletion; and administrative separation. Review current vendor security documentation and contracts rather than inferring compliance from a logo.
Governance also includes metric ownership and change review. A dashboard with strong infrastructure controls can still distribute inconsistent definitions if every workbook recreates revenue differently.
Run a Real-Data Trial
Use two or three finalists on the same bounded task:
- Connect a representative source without copying secrets into the trial notes.
- Reproduce one recurring metric with an agreed definition.
- Trace the result to SQL, formulas, model logic, or source rows.
- Correct one deliberate data-quality issue.
- Share the output with the intended consumer.
- Repeat the task after changing a source field or filter.
- Record operator time, unresolved gaps, recurring setup, and estimated operating cost.
Do not publish “tested” unless those records exist and the method is disclosed. A real-data trial is valuable because it tests fit for your workflow; it does not create a universal ranking.
What It Is
At its core, data analytics software is any tool that helps turn raw data into understanding, covering the stages of cleaning, querying, analyzing, modeling, and presenting.
Key Definition: data analytics software is the set of applications, languages, and environments used to prepare, query, analyze, model, and communicate data, ranging from general-purpose spreadsheets and SQL tools to specialized statistical and programming environments, business intelligence platforms, and AI-powered analysis assistants.
The essence of data analytics software is that the category is broad and no single product excels at every stage. Cleaning, precise querying, modeling, and communication are distinct jobs, so the practical aim is a well-matched set rather than one tool asked to do everything.
Readiness Scorecard
The NIST SP 800-53 security controls adds dirty-schema realism that Spider-only leaderboards under-weight in production.
Assess your software choice (1 point each):
| Check | Pass? |
|---|---|
| It fits the jobs you actually do | |
| Intended users can operate it | |
| It connects to your data | |
| The set is lean, not sprawling | |
| The data foundation is sound | |
| Purchases tie to real needs | |
| Outputs are trustworthy | |
| An AI-native option was considered |
6–8: a well-matched choice. 3–5: revisit fit. Below 3: restart from the jobs.
Common Misconceptions
Misconception 1: The most powerful software is best. Fit to team and data wins.
Misconception 2: One product does everything. Different stages need different tools.
Misconception 3: Software fixes bad data. It analyzes whatever it is given.
Misconception 4: You must operate it manually. AI lets you ask in plain language.
Frequently Asked Questions
What is data analytics software?
It is the set of applications, languages, and environments used to prepare, query, analyze, model, and communicate data, ranging from general-purpose spreadsheets and SQL tools to specialized statistical and programming environments, business intelligence platforms, and AI-powered analysis assistants. The category is deliberately broad, and its defining reality is that no single product excels at every stage. Cleaning, precise querying, modeling, and communication are distinct jobs, so the practical aim is a well-matched set of tools rather than one product asked to do everything at once.
What are the main categories?
By the stage they serve, the categories are spreadsheets for quick preparation and small analysis, SQL and query tools for interrogating structured data, statistical and programming environments for modeling, BI platforms for repeatable reporting, and AI assistants that increasingly span stages. Each has a clear sweet spot — spreadsheets for ad-hoc work, SQL for structured data, code for bespoke modeling, BI for dashboards. Trouble arises when a tool is pushed past its sweet spot, such as modeling at scale in a spreadsheet, which reliably produces errors and frustration.
Which criteria actually matter when choosing?
Fit to your data, usability for the people who will operate the software, and connectivity to your sources predict success far better than the length of a feature list. A tool matched to your team's skills gets used, while one demanding scarce expertise sits idle. Connectivity to your real sources matters more than exotic features, and honest, accessible presentation keeps outputs trustworthy. In practice, how well a tool fits your people and your data almost always outweighs how capable it looks in a specification sheet or a polished sales demonstration.
How do I match software to my need?
Buy for the jobs you actually do, not the jobs you imagine. List the recurring analytical tasks, who performs them, and what data they touch, then map categories to those tasks. A team fluent in SQL against a warehouse needs query and BI tools; business users need self-service; a research team needs statistical environments. A lean, well-integrated set your people can operate beats an impressive collection nobody fully uses, and it keeps cost and complexity proportional to the value the analysis actually returns to the organization.
How is AI changing this category?
AI is letting users ask questions in natural language and receive analysis directly, collapsing several previously separate stages into one interface. An AI-native platform can analyze across your data sources and prepare, query, and visualize in response to a plain-language question, so the category is beginning to consolidate around agents that span jobs once split across many programs. Specialized tools remain valuable for deep, custom work, but a growing share of routine analysis is becoming something you can simply request rather than assemble by hand across several applications.
Is it different from a data analytics platform?
They overlap, but a platform usually implies a more integrated, end-to-end environment, while "software" is the broader umbrella term that includes standalone tools. A single spreadsheet or query tool is data analytics software but not a full platform; a platform typically bundles preparation, analysis, and visualization with shared governance and collaboration. In practice, many organizations combine both — standalone tools for specific jobs alongside a central platform for shared reporting. The useful question is not the label but whether a given option delivers the integration and governance your team's workflow actually requires.
Conclusion
A useful data analytics software comparison names the options, applies the same criteria, exposes pricing and operating assumptions, and ends with a real-data trial. Use the matrix to shortlist by use case, then verify integrations, governance, traceability, repeatability, and total cost before committing. For the marketing-specific stack, use the marketing analytics tools comparison, which separates collection, reporting, measurement, and analysis.
Then try asking your data directly in the InfiniSynapse web app, free on registration.