Data Analytics: Definition, Uses, and Examples
By the InfiniSynapse Data Team · Last updated: 2026-09-26 · We build an AI-native data analysis platform and run analytics on live questions; this page defines data analytics for operators who need a decision, with the four types and a worked example.
Table of Contents
- TL;DR
- Data Analytics, Defined
- How Data Analytics Is Used
- Four Types of Data Analytics
- How Data Analytics Works
- Data Analytics vs Related Fields
- Benefits, Skills, and Limits
- Frequently Asked Questions
- Conclusion
TL;DR
Direct answer: Data analytics is the practice of collecting, cleaning, and interpreting data so a team can decide what to do next. It answers four questions in order: what happened, why it happened, what is likely next, and which action to take. A chart that nobody uses is not finished data analytics. The finished unit is a decision with an owner, a metric grain, and a caveat.
Who this is for: operators, analysts, and managers who need a working definition of data analytics before they buy a tool or staff a team.
What you'll learn: the definition, one account carried through all four types, the steps from raw rows to a decision, and how data analytics sits next to data analysis and data science.
This page sits under the data visualization hub. The word itself is unpacked on define analytics. Software categories stay on data analytics tools.
Data Analytics, Defined
A plain definition
Data analytics is the systematic work of collecting, cleaning, transforming, and interpreting data to find a pattern and support a decision. The pattern can be a rate, a break in a trend, or a forecast. The decision is what changes on Monday: a price, a route, a cohort to contact, a machine to inspect.
Key definition: Data analytics examines data — past and current — to describe what happened, diagnose a cause, estimate what is likely next, and recommend an action. Its test is whether someone acts on a named metric, not whether a dashboard was published.
The heart of data analytics is the handoff from a number to a choice. Statistics without a decision, and dashboards without a reader, are inputs. They become data analytics when the grain is fixed (who is counted, over which period, against which baseline) and a person is accountable for the next step.
What the term includes
Data analytics is a practice, not a single technique. It includes the question, the dataset, the method, the picture, and the action. Teams often enter through reporting and grow into diagnosis and prediction as the data and the skill allow. Higher steps are easier to get wrong, so describing a metric cleanly comes before forecasting it.
| Level | Question | Finished when |
|---|---|---|
| Descriptive | What happened? | The rate, the period, and the baseline are named |
| Diagnostic | Why did it happen? | A cause is tested against at least one alternative |
| Predictive | What is likely next? | A holdout period, not the fitted months, scores the forecast |
| Prescriptive | What should we do? | The action, the cohort, and the cost are named |
| Outcome | Who decides? | Someone acts, then the metric is read again |
Scope note: The patterns below match mid-market and enterprise teams using data analytics in 2026. They are not legal advice, a vendor runbook, or a census of every industry. A smaller question often needs a spreadsheet, not a program.
How Data Analytics Is Used
One account, four questions
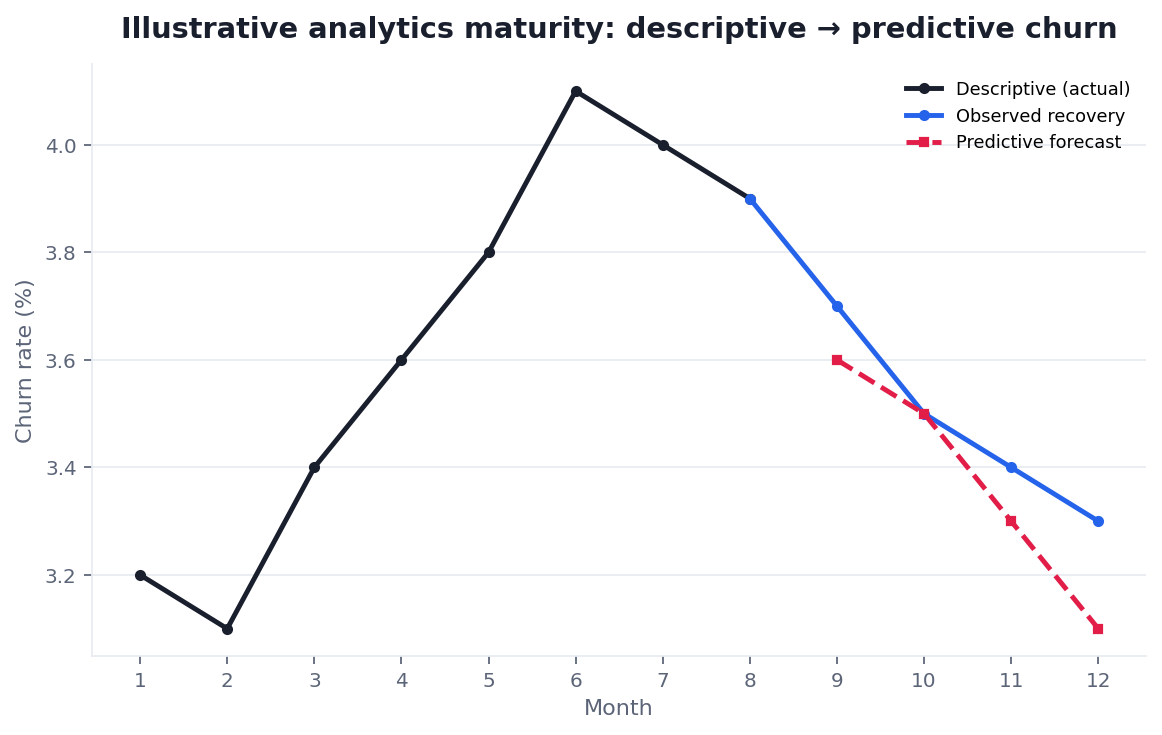
Uses of data analytics are easier to see on one metric than on a list of industries. The figures in this section are illustrative: a teaching account, not a customer extract. Grain: paid subscriptions, counted at month end. Baseline: the prior three months. Definition of logo churn: paid accounts that do not renew, divided by paid accounts at the start of the month.
In months 1–3 the rate sits at 3.2%. In month 6 it prints 4.1%. Data analytics starts by refusing to treat 4.1% as a story until the definition is unchanged. The same four questions then produce four different pieces of work.
| Question | Type | What to check | Decision if it holds |
|---|---|---|---|
| Did logo churn move from 3.2% to 4.1%? | Descriptive | Same grain, same plan mix, no definition edit | Record the move; do not explain it yet |
| Why this month? | Diagnostic | Cohort, plan, channel, renewal email | One annual cohort missed the renewal email |
| What if we fix only that email? | Predictive | Hold out the latest 8 weeks; score two scenarios | About 3.4% next quarter if fixed; about 4.6% if not |
| What do we do Monday? | Prescriptive | Cost of a sequence vs a discount for the whole base | Email the missed cohort only; leave other prices alone |
That card is the reusable part. Copy the columns onto the next metric: question, type, check, decision. Fill them before opening a new chart. The illustrative path below shows the same shape: observed churn, then a forecast band once the email fix is assumed. It is a drawing of the method, not a measured result from a live book of business.
Two other settings use the same card. A maintenance lead asks which press line fails, why last Tuesday spiked, which line is likely to fail in 30 days, and which inspection to schedule. A retailer asks which segment bought, why one region dropped, which segment is likely to return, and which offer to send to that segment only. Industry nouns change. The four questions do not.
Four Types of Data Analytics
Descriptive analytics
Descriptive analytics totals what already happened. On the subscription account it is the 4.1% print, the cohort size, and the three-month baseline of 3.2%. Typical moves are aggregation, a period comparison, and a split by plan or channel. It is the right type when the meeting still disagrees about the number itself. It cannot say why the number moved.
Diagnostic analytics
Diagnostic analytics tests causes. The subscription check is a drill from the company rate to plan, then to the renewal-email flag. The missed email on one annual cohort explains the month; a site-wide outage would have shown up in every plan. Techniques people actually use here are drill-down, a simple correlation check, and a comparison against the alternative story. Stop when one cause survives and the others do not. Do not stop at the first chart that looks dramatic.
Predictive analytics
Predictive analytics estimates a future rate from history, then scores that estimate on time the model did not fit. On the account, the two scenarios — email fixed, email left broken — are forecasts, and the latest eight weeks are the holdout. Methods and validation live on predictive data analysis. Data analytics at this step owes the reader a range or a second scenario, not a single bold percentage with no window.
Prescriptive analytics
Prescriptive analytics names the action. Here the action is a renewal sequence to the missed cohort, because a base-wide discount spends margin on accounts that were never in the broken email. Optimization and a small experiment both belong to this type. The recommendation is only as good as the descriptive grain and the diagnostic cause underneath it. Skipping those two steps is how a confident action lands on the wrong customers.
How Data Analytics Works
Collect the data
Data analytics in practice starts one decision earlier than the chart. Write the decision, the grain, and the baseline before pulling rows. Collection then means the tables that can support that grain: billing events, the email log, the plan dimension. Multi-system collection is an architecture problem as much as an analyst problem; the Microsoft Azure data guide is a useful map of how those systems are supposed to meet. If the email log is missing, the diagnostic question cannot be answered, and more dashboard tiles will not fix that.
Clean and transform it
Cleaning is where most of the hours go, and where most bad decisions are born. Duplicated accounts, a plan rename in month 5, and a churn flag that changed meaning are all definition edits. Data analytics treats a definition change as a break in the series, not as a real movement in customer behavior. Transform the rows to one grain — one row per paid account per month — before any rate is computed. Aggregating a mixed grain produces a number that is arithmetically tidy and operationally false.
Analyze, then decide
Analysis picks the method that matches the question on the card: a comparison for descriptive, a split for diagnostic, a holdout forecast for predictive, a constrained choice for prescriptive. Interpretation says what the number cannot support. Communication is one sentence a manager can repeat, plus the caveat. Tools that prepare, query, and chart sit on this step; the category map is data analytics tools. Data analytics is finished when the sentence names an action and a person, and the metric is scheduled to be read again after that action.
Data Analytics vs Related Fields
Versus data analysis
Data analysis is the inspect, clean, transform, and model step. The Wikipedia overview of data analysis defines it that way: useful information from data, in service of a conclusion. Data analytics is the wider practice that wraps that step in a standing question, a metric grain, and a decision loop. A single investigation can be data analysis. A monthly operating rhythm that describes, diagnoses, forecasts, and assigns an action is data analytics. The process hub for the narrower term is data analysis.
Versus data science
Data science builds models and, often, new data products. It will run open-ended exploration, unstructured inputs, and custom training. Data analytics usually starts from a question the business already knows how to ask, and it stops when that question has an answer someone can ship. The same person may do both in a small company. Hiring and scoping get clearer when the brief says which one this quarter needs. Role boundaries for the analyst seat are on what is a data analyst.
Versus big data
Big data is the volume, variety, and speed of the raw material. Data analytics is what a team does with a dataset once a decision is in view. A warehouse can be large and still produce no decision. A single well-grained table can support all four types. Scale changes the tools. It does not change the card: question, type, check, decision.
Benefits, Skills, and Limits
Where the benefit shows up
Data analytics pays when the finding changes a behavior the metric can see on the next read. Five places that show up repeatedly:
- A decision with a baseline. The 4.1% is compared with 3.2%, not with a feeling that "churn seems high."
- Less wasted action. The email goes to the missed cohort, not to every account.
- A forecast with a window. Planning uses the holdout scenarios instead of last month copied forward.
- A shorter argument about the number. Shared grain ends the meeting that was really about definitions.
- A second look. The loop schedules the metric again after the action, so the team learns whether the cause was real.
An insight nobody acts on has the same operating value as no insight. Teams that get the benefit run data analytics as a loop — question, check, decision, result — rather than as a factory that ships charts.
Skills, challenges, and AI
The skills that carry data analytics are narrower than a course catalog. People need a way to query structured data (SQL or an equivalent), a chart a non-specialist can read, and enough statistics to separate a move from noise and a correlation from a cause. The Bureau of Labor Statistics outlook for operations research analysts, a neighboring occupation that collects data and recommends actions, reported a median wage of $88,940 in May 2025 and projected 12% employment growth from 2025 to 2035. That handbook also points to analytics demand inside the occupation. It is not a headcount forecast for every "data analytics" job title.
Four limits stall the work more often than a missing algorithm:
- Quality. A renamed flag or a duplicate account moves the rate.
- Access. The cause lives in a system the analyst cannot join.
- Privacy and control. Rows that include customers need an access model; ISO/IEC 27001 is the control vocabulary many security teams already use.
- A missing decision. Activity without an owner produces reports.
AI changes the mechanical middle. Drafting a query, proposing a split, and flagging a broken row are faster than they were. The European approach to artificial intelligence and the NIST AI Risk Management Framework both treat that assistance as a system someone must govern: purpose, data, and human review stay visible. We describe the agent-side workflow on AI-native data analysis. Data analytics still depends on a person to name the grain and to refuse a neat answer that the rows do not support.
Use this checklist on the next metric. One point each.
| Check | Pass? |
|---|---|
| The decision and the owner are named before the pull | |
| Grain, period, and baseline are written down | |
| Definition changes are marked, not graphed as behavior | |
| The method matches the question on the card | |
| A cause is tested against an alternative | |
| A forecast, if any, is scored on a holdout | |
| The action names a cohort and a cost | |
| The metric is scheduled to be read again |
6–8: the loop is intact. 3–5: fix grain and the decision before adding a model. Below 3: stop forecasting and rebuild the question.
Frequently Asked Questions
What is data analytics, in plain terms?
Data analytics is the practice of collecting, cleaning, and interpreting data so a team can decide what to do next. It covers four questions: what happened, why it happened, what is likely next, and which action to take. The finished result is a decision with an owner and a metric grain, not a chart filed for later.
What are the four types of data analytics?
Descriptive analytics summarizes what already happened. Diagnostic analytics tests a cause against an alternative. Predictive analytics estimates what is likely next and scores that estimate on a holdout period. Prescriptive analytics recommends an action, including who it applies to and what it costs. Describe and diagnose a metric before leaning on a forecast.
How does data analytics work in practice?
Write the decision, the grain, and the baseline first. Collect the rows that can support that grain, clean definition changes and duplicates, then compute. Most of the time goes to collection and cleaning. Close with one sentence a manager can act on, plus the caveat the number cannot support, and read the metric again after the action.
What is the difference between data analytics and data science?
Data analytics answers a stated business question from data the organization already has: a report, a cause, a forecast, or a recommended action. Data science also builds new models and data products, often from a looser question. Data analysis is the inspect-and-model step inside either one. Judge a role by the decision it owns this quarter.
How is AI changing data analytics?
AI drafts queries, suggests splits, and flags broken rows, so the mechanical middle moves faster. People still name the decision, the grain, and whether the pattern is strong enough to act on. A natural-language answer helps when the metric definition and the source tables are visible. It misleads when those are hidden.
Conclusion
Data analytics is collecting, cleaning, and interpreting data until someone can act: describe the rate, test a cause, estimate the next period on a holdout, and name the action with its cost. Start from the decision and the grain. Keep the four questions on one card. Use AI to speed the mechanical steps, and keep the judgment on the person who owns the metric.
When you want to ask a dataset in plain language and see the query behind the answer, try the InfiniSynapse web app.