Data Analytics Tools: A 2026 Map
By the InfiniSynapse Data Team · Last updated: 2026-07-15 · We build an AI-native data analysis platform and work across analytics stacks daily; this map of data analytics tools in 2026 is organized by the job each does, not by brand ranking.
Table of Contents
- TL;DR
- How We Approach It
- What They Are
- The Main Categories
- How They Fit Together
- Choosing Among Them
- Where the Category Came From
- Common Pitfalls
- The Category in the Age of AI
- Readiness Scorecard
- Common Misconceptions
- Frequently Asked Questions
- Conclusion
TL;DR
Direct answer: data analytics tools are the software that helps people prepare, analyze, model, and communicate data — spanning spreadsheets, SQL and query tools, statistical and programming environments, BI and visualization, and increasingly AI assistants. In 2026, choosing among data analytics tools is about assembling the few that fit your data, your questions, and your team's skills, not chasing a single do-everything product.
Who this is for: analysts, engineers, and leaders mapping data analytics tools in 2026.
What you'll learn: what they are, the main categories, how they fit, how to choose, and how AI relates.
This guide sits under the data visualization hub. The practice those tools serve is data analytics.
For adjacent categories, see big data analytics tools.
Also see data analytics platform.
How We Approach It
Implementation details are commonly grounded in Azure architecture center when teams translate concepts into production practice.
We map data analytics tools by the job each does, because the category is too broad to rank as a single list. Every point reflects real practice. We anchor concepts to the OpenTelemetry documentation and weigh evaluation against W3C WCAG accessibility standard.
The table below frames data analytics tools.
| Job | Tool type |
|---|---|
| Prepare | Spreadsheets, data prep |
| Query | SQL and query tools |
| Model | Statistical and code environments |
| Communicate | BI and visualization |
| Assist | AI analysis agents |
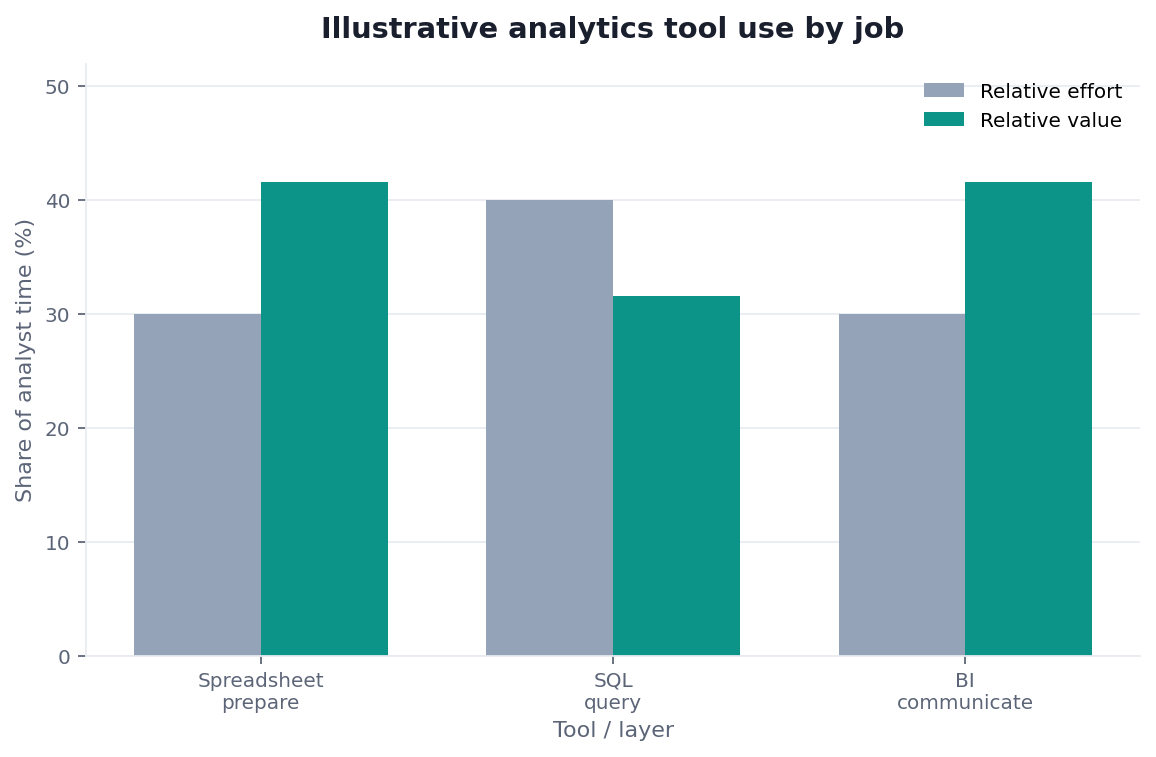
Practical example: an analyst mapped their data analytics tools by job — a spreadsheet to prepare, SQL to query, a BI tool to communicate — rather than forcing everything into one, an approach the guidance at NIST Computer Security Resource Center reflects.
Scope note: This guide reflects patterns we see when mid-market and enterprise teams work with data analytics tools in 2026. It is not a substitute for legal counsel, vendor runbooks, or a formal survey of every industry — and when a smaller toolset or lighter process would serve, a full program is overkill.
What They Are
At their core, data analytics tools are the software people use at each stage of turning raw data into insight — preparing it, querying it, modeling it, and communicating the results.
Key Definition: data analytics tools are the software applications, languages, and environments used to collect, clean, query, analyze, model, and visualize data, spanning everything from spreadsheets and SQL to statistical and programming environments to business intelligence and, increasingly, AI-powered analysis assistants.
The essence of data analytics tools is that no single one covers the whole journey well. Preparing data, asking precise questions, building models, and communicating findings are different jobs, and the sensible approach is a small, well-chosen set rather than one tool stretched beyond its strengths.
The Main Categories
Governance and risk expectations are framed by UK NCSC AI development guidelines when programs need an external control reference.
Data analytics tools fall into recognizable categories by job: spreadsheets and data-prep tools for cleaning and shaping; SQL and query tools for interrogating databases; statistical and programming environments for modeling; BI and visualization tools for communicating; and AI assistants that increasingly span several jobs at once.
Each category of data analytics tools has a sweet spot, as the analytics guidance at OWASP API Security Top 10 reflects. Spreadsheets excel at quick, small-scale work; SQL is unmatched for structured querying; programming environments handle custom modeling; BI tools shine at repeatable dashboards. Using a tool outside its sweet spot — heavy modeling in a spreadsheet, say — is a common source of pain and error.
How They Fit Together
Understanding data analytics tools means seeing them as a chain, not rivals. Data is typically prepared in one tool, queried in another, modeled in a third, and communicated in a fourth, with results flowing from stage to stage.
The way data analytics tools connect matters as much as the tools themselves, and honest communication of results, aligned with guidance like the Snowflake Cortex Analyst, is the final link. A stack where tools integrate cleanly lets an analyst move from raw data to a shared chart without friction; a stack of disconnected tools forces manual export-import steps that waste time and introduce errors. Integration, not any single tool's power, often determines a team's real productivity.
Choosing Among Them
Teams evaluating this topic often cross-check Shopify ecommerce analytics for a durable, vendor-neutral reference point.
Choosing data analytics tools starts from your data, questions, and team skills. A team fluent in SQL against a warehouse needs different tools than one working from spreadsheets, and the right set follows those realities rather than a trend.
The discipline in selecting data analytics tools is to favor a lean, well-integrated set over a sprawling collection. Every tool adds a learning curve, a license, and an integration point, so the goal is the smallest set that covers preparing, querying, modeling, and communicating for your actual work. Adding tools because they are popular, rather than because a job demands them, quietly raises cost and complexity without improving the analysis.
Where the Category Came From
The category of data analytics tools accumulated over decades as each stage of analysis got its own specialized software. Spreadsheets democratized basic analysis; databases and SQL made structured querying rigorous; statistical languages enabled serious modeling; and BI tools industrialized reporting and dashboards.
Understanding this history clarifies why the landscape is a patchwork of specialized tools rather than one integrated whole: each emerged to solve a specific stage better than the general-purpose tools of its day. It also explains the recurring integration challenge, since tools built by different vendors for different jobs rarely connect seamlessly. The newest wave — AI assistants — is notable precisely because it aims to span several of these historically separate stages through a single conversational interface.
Common Pitfalls
Teams evaluating this topic often cross-check OWASP Top 10 for LLM Applications for a durable, vendor-neutral reference point.
The pitfalls of data analytics tools begin with using the wrong tool for the job. Forcing large-scale analysis into a spreadsheet, or building a one-off exploration in a heavyweight BI platform, wastes effort and invites errors that the right tool would prevent.
A subtler pitfall with data analytics tools is tool sprawl — accumulating overlapping software until nobody knows the canonical way to do anything. Sprawl fragments skills, multiplies licenses, and creates conflicting versions of the truth as different people use different tools on the same data. A lean, integrated, well-understood set beats a large collection, because clarity about which tool does which job is itself a form of productivity that sprawl steadily erodes.
A related pitfall is letting personal preference override team consistency. Individual analysts naturally gravitate to the tools they know best, and in a small group that flexibility is harmless. But as a team grows, a patchwork where one person models in R, another in Python, and a third in a BI tool's scripting language makes work hard to review, hand off, or reproduce. Someone who leaves takes the only knowledge of their pipeline with them. The healthier pattern is a shared default for each job — an agreed query tool, an agreed modeling environment, an agreed place to publish — with room for exceptions when a task genuinely warrants them. Consistency is not bureaucracy; it is what lets analysis outlive the individual who first produced it.
The Category in the Age of AI
AI is reshaping data analytics tools by collapsing several stages into one conversational interface. Instead of moving data between a query tool, a modeling environment, and a chart builder, users increasingly ask an agent that handles the chain.
We explore this in what AI-native data analysis means. In the InfiniSynapse web app, an agent analyzes across your data sources and prepares, queries, and visualizes in response to a question, so data analytics tools are beginning to consolidate around agents that span jobs once split across many separate programs — though specialized tools remain valuable for deep work.
Readiness Scorecard
Implementation details are commonly grounded in AWS Well-Architected Framework when teams translate concepts into production practice.
Assess your analytics toolset (1 point each):
| Check | Pass? |
|---|---|
| Each job has a fitting tool | |
| Tools are used in their sweet spot | |
| The tools integrate cleanly | |
| The set is lean, not sprawling | |
| Team skills match the tools | |
| Data feeds them reliably | |
| A canonical way to work is clear | |
| An AI-native option was considered |
6–8: a healthy toolset. 3–5: prune and integrate. Below 3: rebuild around the jobs.
Common Misconceptions
Misconception 1: One tool can do everything well. Different jobs need different tools.
Misconception 2: More tools mean more capability. Sprawl erodes clarity and trust.
Misconception 3: The most powerful tool is always best. Fit to the job matters more.
Misconception 4: Tools work in isolation. Integration decides real productivity.
Frequently Asked Questions
What are data analytics tools?
They are the software applications, languages, and environments used to collect, clean, query, analyze, model, and visualize data. They span everything from spreadsheets and SQL to statistical and programming environments to business intelligence and, increasingly, AI-powered analysis assistants. The key point is that no single one covers the whole journey well — preparing data, asking precise questions, building models, and communicating findings are genuinely different jobs, so the sensible approach is a small, well-chosen set rather than one tool stretched far beyond its natural strengths.
What are the main categories?
By job, the categories are spreadsheets and data-prep tools for cleaning and shaping, SQL and query tools for interrogating databases, statistical and programming environments for modeling, BI and visualization tools for communicating, and AI assistants that increasingly span several jobs at once. Each has a sweet spot: spreadsheets excel at quick small-scale work, SQL at structured querying, programming environments at custom modeling, and BI tools at repeatable dashboards. Using a tool outside its sweet spot, such as heavy modeling in a spreadsheet, is a frequent source of pain and error.
How do the tools fit together?
They form a chain rather than a set of rivals. In a typical flow, one tool cleans and shapes the data, another interrogates it, a third builds the model, and a fourth presents the findings, with output handed from each stage to the next. How cleanly they connect matters as much as the tools themselves — an integrated stack lets an analyst move from raw data to a shared chart without friction, while disconnected tools force manual export-import steps that waste time and introduce errors. Integration, not any single tool's power, often decides a team's real productivity.
How should I choose among them?
Start from your data, your questions, and your team's skills. A team fluent in SQL against a warehouse needs a different set than one working from spreadsheets, and the right tools follow those realities rather than a trend. Favor a lean, well-integrated set over a sprawling collection, because every tool adds a learning curve, a license, and an integration point. The goal is the smallest set that covers preparing, querying, modeling, and communicating for your actual work — adding tools because they are popular only raises cost and complexity.
How is AI changing data analytics tools?
AI is collapsing several stages into one conversational interface. Instead of moving data between a query tool, a modeling environment, and a chart builder, users increasingly ask an agent that handles the chain end to end. An AI-native platform can analyze across your data sources and prepare, query, and visualize in response to a plain-language question, so the landscape is beginning to consolidate around agents that span jobs once split across many programs. Specialized tools remain valuable for deep, custom work, but the routine chain is increasingly something you can simply ask for.
Do I still need to learn SQL if AI can write queries?
It remains worth understanding, even as AI writes more queries for you. AI-generated SQL is fast and often correct, but you still need enough fluency to check that a query matches your intent, to catch subtle errors in joins or grains, and to trust the numbers before acting on them. Think of SQL literacy less as a manual typing skill and more as the ability to read and verify what an agent produces. The people who benefit most from AI assistance are those who understand the underlying query well enough to know when the machine has quietly got it wrong.
Conclusion
Data analytics tools are a chain of specialized software — prepare, query, model, communicate — and the smart approach is a lean, well-integrated set matched to your data, questions, and skills. In 2026, use each tool in its sweet spot, avoid sprawl, and remember AI-native agents are beginning to span several of these jobs through a single conversation.
Then try an agent that spans the chain in the InfiniSynapse web app, free on registration.