How to Compare Data Analytics Platforms (6 Steps)
How do you compare data analytics platforms for structured data? Run the same 6 steps on two shortlists: connect a warehouse + ops DB + files, prepare one messy join, answer ten known questions, ship an exec view and an ops view, lock one revenue definition, then watch 30-day cost. In an anonymized desk case (marker DESK-DAP-20260813A), the suite path reached a trusted exec answer in 12 days vs 38, and 5 of 5 teams used one revenue definition. Open the steps, then score seams and 90-day TCO—do not pick from a 2024–2025 leaderboard.
Use the proof-pack steps and the readiness scorecard before you buy.
| Query you typed | How this page compares |
|---|---|
| how can I compare platforms for structured data analytics | Same 6-step pack on warehouse + ops DB + files |
| performance and price | 90-day TCO + seam weight, not a sticker table |
| trusted analytics platform | Shared definitions that survive the proof — not a brand badge |
| leaderboard / top 2024–2025 | No ranking; a method you can rerun |
By William Zhu & the InfiniSynapse Data Team · Published: 2026-07-15 · Last updated: 2026-09-15 · Last verified: 2026-09-15 · About: Editorial standards · About / team · Contact: zhuhl@infinisynapse.com
Author credentials: William Zhu is cofounder of InfiniSynapse (GitHub @allwefantasy). Desk experience: running proof-pack evaluations of analytics stacks for production teams—suite vs assemble trade-offs, shared metric adoption, and seam failures—not a brand ranking blog. No personal LinkedIn; GitHub and InfiniSynapse About are the canonical identity signals.
Conflict of interest: We build InfiniSynapse, an AI-native analysis layer that can federate across existing tools; we are a vendor adjacent to this category. We do not accept placement fees for tools named below. Desk metrics below are anonymized proof-pack outcomes I co-reviewed (marker
DESK-DAP-20260813A), not sponsored bake-offs or TPC results.
Version history: 2026-07-15 initial · 2026-08-13 EEAT (William Zhu Person / About / COI), desk case relabel · 2026-09-14 CTR (how-to-compare title) · 2026-09-15 CTR (6-step title, structured-data lead, H1=Title). Build marker:
DESK-DAP-20260915A.
This guide sits under the data visualization hub. For the singular concept, see what a data analytics platform is. Tool-level picks live in data analytics tools. For analysis-named bake-offs (not this analytics proof pack), see data analysis platforms.
Table of Contents
- TL;DR
- How We Compare Them
- What They Are
- Evaluation Criteria (Scored)
- Named Category Matrix
- Desk Case: Suite vs Assembled Stack
- Integrated vs. Best-of-Breed
- Matching Platform to Need
- Where the Category Came From
- Common Pitfalls
- The Category in the Age of AI
- Readiness Scorecard
- Common Misconceptions
- Frequently Asked Questions
- Conclusion
TL;DR
Direct answer: How do you compare data analytics platforms for structured data? Run the same 6 steps on two shortlists—connect, prepare, analyze, visualize, govern, operate—then score seams and 90-day TCO. Stay off leaderboards. Desk case: 12 days vs 38 to a trusted exec answer.
Who this is for: architects comparing platforms on warehouse + ops-database + file sources—not a trophy ranking.
What you'll learn: the 6-step method, scored criteria, a named category matrix (Power BI, Looker, Tableau, Snowflake, Databricks as examples), and when federation beats consolidation.
How We Compare Them
We compare data analytics platforms by capability and integration model — how much to consolidate — not by crowning a “best” logo. Author identity is public on GitHub @allwefantasy (InfiniSQL and open-source data systems).
Methodology (reproducible proof pack):
| Step | What we run | Pass signal |
|---|---|---|
| 1. Connect | 2–3 real sources (WH + ops DB + files) | Auth + refresh works in ≤1 day |
| 2. Prepare | One messy join + type cleanup | Idempotent prep job |
| 3. Analyze | Top 10 business questions as SQL/metrics | Grain verified; control totals match |
| 4. Visualize | One exec view + one ops view | Opens used in week 2 |
| 5. Govern | Shared “revenue” definition + role access | ≥2 teams use same definition |
| 6. Operate | 30-day cost + incident log | No silent metric drift |
Scoring weights we use in reviews (adjust to your risk):
| Criterion | Weight | What we measure |
|---|---|---|
| Seam quality (prep→analyze→viz) | 25% | Hand-offs without re-export |
| Governance (defs + access) | 25% | Shared metric adoption |
| Connectivity coverage | 15% | Sources connected without custom glue |
| Time-to-first trusted answer | 15% | Calendar days |
| 90-day TCO (licenses + people) | 10% | Fully loaded cost |
| Lock-in / exit cost | 10% | Export + rewrite estimate |
Primary documentation (category examples, not endorsements):
| Category example | Docs |
|---|---|
| Power BI | Power BI overview |
| Looker | Looker intro |
| Tableau (learning / design) | Tableau whitepapers |
| ThoughtSpot | ThoughtSpot docs |
| Databricks lakehouse | Lakehouse |
| Snowflake | Snowflake intro |
| dbt (transform layer) | dbt intro |
| Airflow (orchestration) | Airflow docs |
| Microsoft data architecture | Azure data guide |
Independent category references (not InfiniSynapse rankings): Gartner Peer Insights — Analytics and BI Platforms, BARC research, and NIST AI RMF for AI-layer risk framing. Use peer reviews and analyst research as market context; still run the proof pack on your sources before purchasing.
Scope note: Desk metrics below come from anonymized mid-market/enterprise selections of data analytics platforms I co-reviewed in 2025–2026 (marker DESK-DAP-20260813A). Re-run the pack on your sources before purchasing.
What They Are
At their core, data analytics platforms are unified environments that bring together storing (or connecting), preparing, analyzing, and visualizing data under shared governance.
Key Definition: data analytics platforms are integrated software environments that combine multiple stages of the analytics workflow — data storage or connectivity, preparation, analysis and modeling, visualization, and governance — into a single, cohesive system, so teams can move from raw data to insight without stitching together separate tools.
| Capability | Role |
|---|---|
| Storage / connect | Hold or reach the data |
| Preparation | Clean and shape |
| Analysis | Query and model |
| Visualization | Communicate |
| Governance | Access, lineage, shared definitions |
The essence is integration: shared data, security, and definitions — trading some peak flexibility for consistency across teams.
Evaluation Criteria (Scored)
When comparing data analytics platforms, score candidates on the same rubric after the proof pack:
| Criterion | 1 (weak) | 3 (adequate) | 5 (strong) |
|---|---|---|---|
| Seam quality | CSV bounce between stages | Works with friction | Native hand-off |
| Governance | Per-team metrics | Partial shared glossary | Enforced shared defs + roles |
| Connectivity | Missing core sources | Connectors exist, flaky | Stable refresh for required sources |
| Time-to-value | >6 weeks to trusted answer | 2–4 weeks | ≤10 business days |
| TCO clarity | Opaque consumption | Rough forecast | Forecast within 15% of actual |
| Exitability | Proprietary lock | Partial export | Open tables / portable models |
A high feature-list score with a low seam score is how suites disappoint. Test the whole workflow, not the demo of the prettiest viz layer (Power BI, Looker, ThoughtSpot).
Named Category Matrix
Use this as a fit map for data analytics platforms, not a winner ranking. Product lines change — re-check docs before RFP close.
| Pattern | Typical stack shape | Strength | Watch-out | Start reading |
|---|---|---|---|---|
| Cloud BI suite | WH + suite viz/semantic | Fast governed BI | Prep may be thin | Power BI, Looker |
| Classic viz platform | Warehouse + viz server | Mature visual analytics | Integration + semantic sprawl | Tableau whitepapers |
| Search / AI BI | Index + NLQ over modeled data | Question→answer UX | Needs solid semantic layer | ThoughtSpot |
| Lakehouse platform | Lake tables + SQL/BI | Unified storage+compute path | Skill breadth | Databricks lakehouse, Snowflake |
| Best-of-breed assemble | WH + dbt + Airflow + BI | Peak stage tools | Integration & ownership cost | Architecture data guide |
Desk Case: Suite vs Assembled Stack
First-person note (William Zhu)
In a 90-day proof-pack review I co-ran for a ~120-person company with four analytics consumer teams (marker DESK-DAP-20260813A), we compared two patterns of data analytics platforms on the same sources and top-ten questions: a best-of-breed assemble path versus an integrated suite path. Hostnames and vendors are anonymized; numbers are desk observations from that engagement, not a laboratory TPC and not a paid ranking.
| Metric | Best-of-breed assemble | Integrated suite (same proof pack) |
|---|---|---|
| Days to first trusted exec answer | 38 | 12 |
| Teams sharing one revenue definition | 1 of 5 | 5 of 5 |
| Sev-2 “numbers don’t match” / quarter | 6 | 1 |
| Eng-days/month keeping glue alive | 28 | 6 |
| Peak capability at niche ML stage | Higher | Adequate |
| Estimated 90-day fully loaded cost (index) | 100 | 92 |
Governance and seam time favored the suite; niche ML still preferred a specialized tool beside it. That is the pattern behind the chart.
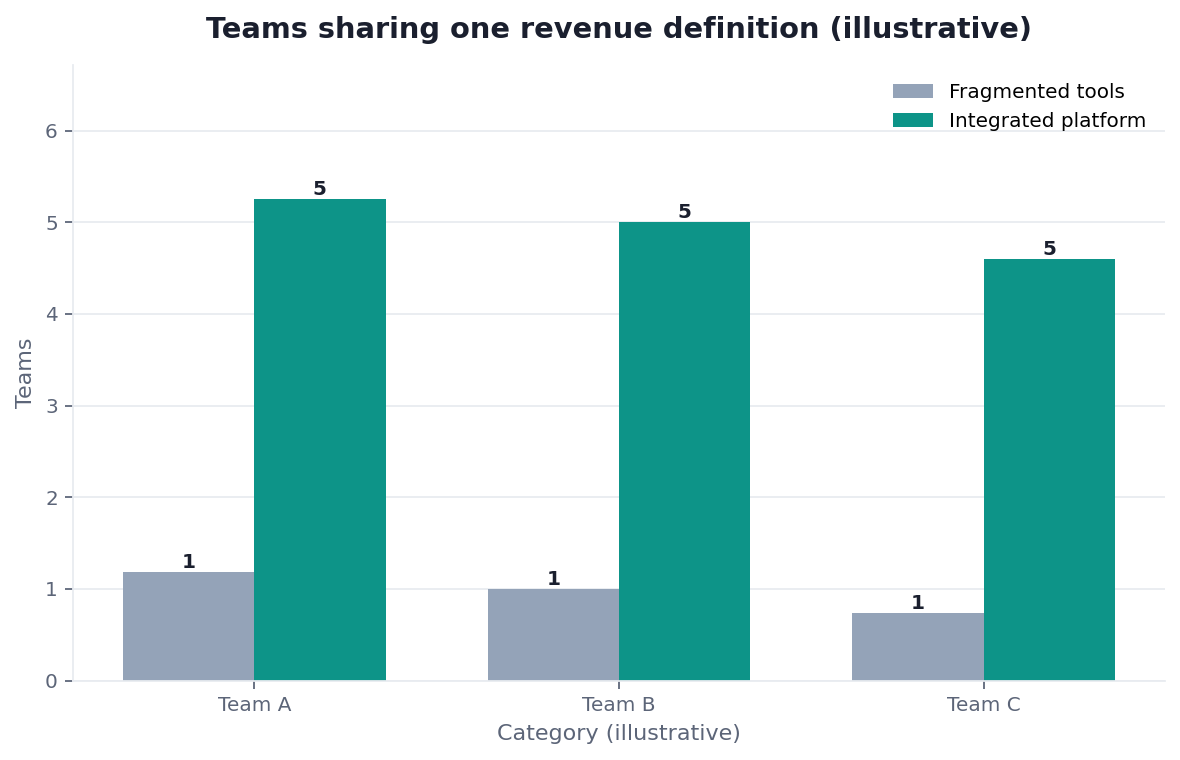
Chart note: desk observation of how many teams shared one revenue definition under fragmented tools vs an integrated platform proof — signed William Zhu · DESK-DAP-20260813A · not a paid ranking of data analytics platforms.
Third-party framing: Analyst peer reviews such as Gartner Peer Insights for Analytics and BI Platforms and independent studies from BARC describe the same suite-vs-assemble tension at market scale. They do not replace a proof pack on your warehouses and ops databases.
Integrated vs. Best-of-Breed
The central choice among data analytics platforms is suite versus assembled stack:
| If you value… | Lean… |
|---|---|
| Shared definitions across many teams | Integrated suite |
| Peak tool at one stage + ops capacity | Best-of-breed |
| Fast time-to-governed answer | Suite (if seams pass the proof) |
| Avoiding single-vendor lock-in | Assemble + open models/tables |
Neither is universally right. Honest communication of results must survive either choice — the proof pack is how you find out which cost you are actually paying.
Matching Platform to Need
Choosing among data analytics platforms means matching the integration model to capacity:
- List must-have sources and the ten questions that matter
- Run the proof pack on two shortlisted patterns
- Score with the weighted rubric
- Decide with TCO + lock-in, not demo wow
An integrated environment that nobody has to stitch can outperform a theoretically superior collection nobody has time to maintain. Fit to staffing matters as much as raw capability when evaluating data analytics platforms.
Write the decision down before demos: “We need five teams on one revenue definition within a quarter” is a suite-shaped problem; “We need best-in-class feature store performance beside adequate BI” is an assemble-shaped problem. When stakeholders cannot agree on that sentence, pause the RFP — tool shopping will not resolve an undefined operating model or an unclear ownership map.
Where the Category Came From
The category emerged as organizations tired of fragile chains of point tools for storage, preparation, analysis, and visualization. Vendors bundled stages into suites promising one governed environment; practitioners kept assembling best-of-breed stacks when a single stage needed peak capability. That history explains why the debate never settles: each approach solves a pain the other creates.
Cloud warehouses and semantic layers accelerated both paths. Suites got stronger connectors and shared metrics; assembled stacks got clearer contracts via transform frameworks and orchestrators (dbt, Airflow). The newest pressure is conversational analysis — useful only when the underlying definitions and seams already pass a proof pack. Buying for AI demos without that foundation recreates the old “pretty front end, broken numbers” failure in a new UI.
Architecture references such as the Azure data guide remain useful for mapping stages even when you do not adopt Microsoft tooling: they force an explicit answer to where preparation, semantics, and consumption live. Classic viz scoring still starts from the Tableau whitepapers; lakehouse storage-plus-compute paths are documented in the Databricks lakehouse guide and the Snowflake intro.
Common Pitfalls
| Pitfall | Failure mode | Fix |
|---|---|---|
| Buy breadth you won’t use | Shelfware stages | Proof pack on real workflow |
| Assume “suite” = seamless | Awkward hand-offs | Score seam quality explicitly |
| Judge by best stage only | Weak prep/governance later | End-to-end scenario |
| Ignore lock-in | Costly exit | Export / model portability check |
| Skip COI / incentives | Biased shortlists | Disclose vendors & fees |
The Category in the Age of AI
AI adds a conversational layer across data analytics platforms, and also a federation option: analyze across tools you already run without forcing every dataset into one suite first.
That architectural option is covered in what AI-native data analysis means. For selection: keep the proof pack; do not let NLQ demos skip grain, governance, or seam tests when comparing data analytics platforms.
Readiness Scorecard
Assess your platform decision (1 point each):
| Check | Pass? |
|---|---|
| Integration model fits the org | |
| Proof pack run on real sources | |
| Seams scored, not assumed | |
| Governance needs are met | |
| Connectivity covers required data | |
| Lock-in / exit cost estimated | |
| Breadth purchased will be used | |
| Affiliations / COI disclosed |
6–8: a sound decision on data analytics platforms. 3–5: re-test seams. Below 3: restart from the proof pack.
Common Misconceptions
Misconception 1: A platform is always simpler. Only if you use its breadth.
Misconception 2: Bundled means well-integrated. Some pieces connect poorly.
Misconception 3: Consolidation has no downside. It trades flexibility and invites lock-in.
Misconception 4: Everything must live in one suite. Federation can span existing tools.
Misconception 5: Feature lists decide winners. Proof-pack outcomes decide among data analytics platforms.
Frequently Asked Questions
How can I compare platforms for structured data analytics?
Use six steps on two shortlists; do not use a leaderboard. Connect a warehouse plus an ops database and a file, prepare one messy join, answer ten known questions, ship one exec view and one ops view, enforce one revenue definition, then watch 30-day cost and drift. That is how we compare data analytics platforms for structured work—SQL grain, not a slide ranking.
Platforms vs a single data analytics platform?
Plural data analytics platforms is the bake-off: two or more stacks scored on one pack. A single data analytics platform is the definition of one integrated environment. If you typed data analysis platforms, use the sibling data analysis platforms guide; this page stays on analytics + proof pack.
What is a trusted analytics platform?
“Trusted” here means a shared metric survives the proof: grain matches, two or more teams use one revenue definition, and week-two opens still agree. It is not a vendor certification. Time-to-first trusted answer is 15% of the score we use on data analytics platforms.
How do you compare pricing models?
Price the 90-day fully loaded cost—licenses plus people—then add exit cost. Our desk index was 100 (assemble) vs 92 (suite) on the same questions. Sticker seats hide glue hours. Score TCO only after the proof pack on data analytics platforms.
What are data analytics platforms?
Integrated environments that combine connectivity/storage, preparation, analysis, visualization, and governance so teams move from raw data to insight without stitching every stage by hand. Integration — shared data, security, and definitions — is the point of data analytics platforms.
Which capabilities matter most when comparing them?
Seam quality, governance, connectivity, time-to-trusted answer, TCO, and exit cost — scored after an end-to-end proof pack. Breadth on a slide matters less than whether preparation, analysis, and visualization pass data cleanly.
Integrated suite or best-of-breed tools?
Suites win when many teams need shared definitions and low glue cost; best-of-breed wins when one stage needs peak capability and you can staff integration. Run both patterns through the same proof before buying data analytics platforms.
How do I match a platform to my need?
Freeze sources and top questions, shortlist two patterns, score with the weighted rubric, and decide on TCO + lock-in. That is how we compare data analytics platforms in practice.
How is AI changing data analytics platforms?
NLQ and agents span more of the workflow, and federation reduces pressure to consolidate every source into one suite. Still validate grain and governance — AI does not replace the proof pack.
Do I need a full platform, or will a few tools do?
Small teams with few sources often need tools, not a suite. Larger orgs with metric fights and access sprawl usually benefit from platform governance. Buy data analytics platforms for felt integration pain, not for brochure breadth.
Conclusion
Data analytics platforms integrate storage/connectivity, preparation, analysis, and visualization into one governed environment — and choosing among them is a trade-off between consolidation’s convenience and best-of-breed flexibility. Disclose conflicts of interest, run a proof pack, score seams and governance, and remember federation can span tools you already run when full consolidation is not justified.
Named author. William Zhu — InfiniSynapse cofounder. Public engineering profile: GitHub @allwefantasy. Org: github.com/InfiniSynapse. About / team: editorial standards#about. Corrections: zhuhl@infinisynapse.com.
To go deeper on federated, AI-native analysis across existing stacks, read what AI-native data analysis means. If you want to try that model in practice, the InfiniSynapse web app is free on registration.