Analytical Software: Stats, Not Just Charts
By William Zhu & the InfiniSynapse Data Team · Published: 2026-07-09 · Last updated: 2026-09-27 · Last verified: 2026-09-27 · About: Editorial standards · About / team
Author credentials: William Zhu is cofounder of InfiniSynapse (GitHub @allwefantasy). Desk experience: evaluating statistical packages and AI-assisted analytics workflows on customer-style workloads—not a sponsored SPSS/SAS/Stata brief. No personal LinkedIn is published; GitHub and InfiniSynapse About are the canonical identity signals.
COI / interest disclosure: InfiniSynapse sells an AI-native Data Agent platform that can sit alongside code notebooks and statistical packages for recurring standard analytics. Product mentions appear only in the labeled Product recommendation (commercial) module. Scorecards and vendor comparisons stand independently of any trial.
Fact-check / verification: Desk n=14 selection-failure composite below is an InfiniSynapse first-party desk review—not a vendor lab study. Primaries: Python docs · CRAN · SPSS Statistics docs · SAS documentation · Stata manuals · Stanford HAI AI Index · IBM augmented analytics. Peer markets (not endorsements): Gartner Peer Insights — Analytics & BI · G2 Analytics Platforms. Corrections: zhuhl@infinisynapse.com · editorial corrections.
Version history: 2026-07-09 initial · 2026-08-07 EEAT / Breadcrumb+Person+HowTo / desk n=14 / decision-tree SVG / dens destuff. Marker:
DESK-ATD-20260807A. Media note: No VideoObject; use decision-tree SVG plus existing hero/table figures.
 Analytical software moves past charts into inference and modeling—choose by method and team skill.
Table of Contents
- TL;DR
- How We Evaluated Analytical Tools
- InfiniSynapse First-party Data (desk n=14)
- What Analytical Software Is
- What Analytical Software Has to Do
- Analytical Software vs BI Software
- The Main Options Worth Knowing
- Descriptive vs Inferential Methods
- Statistical Analytical Software
- When to Use Code vs a Package vs an Agent
- HowTo: Pick Analytical Tools in Four Steps
- Where AI-Native Agents Fit
- Analytical Tool Selection Scorecard
- Reproducibility and Documentation
- Matching Tools to Team Skill
- When Analytical Software Is the Wrong Purchase
- Common Failure Modes
- Frequently Asked Questions
- Conclusion
TL;DR
Direct answer: Analytical software is the statistical and modeling layer—Python, R, SPSS, SAS, Stata, and AI-native agents—that tests hypotheses, quantifies relationships, and forecasts outcomes. Analytical tools for data analysis are that software. The right one depends on the method you need and the skills on your team.
Who this is for: analysts and researchers choosing analytical software that handles real statistics, not just visualization.
What you'll learn: evaluation method, desk n=14 first-party findings, what distinguishes analytical tools from presentation tools, the main picks, descriptive versus inferential methods, a four-step HowTo, and a selection scorecard.
This is the statistical companion within the data analysis tools hub. For the broader software roundup, see best data analysis software. Related depth: Tools for Data Analysis: Picks by Use Case in 2026 and Programs for Data Analysis.
How We Evaluated Analytical Tools
We selected every product in this guide using criteria that mirror what researchers and analysts actually need in production, not brand prestige alone. Each tool was checked against four dimensions: whether it supports the methods the team genuinely uses, whether results are reproducible and documented, whether it connects to real data sources at the team's scale, and whether recurring analyses get faster on the second run. We cross-referenced method requirements with the Wikipedia overview of statistics and the Wikipedia data analysis overview, which distinguish descriptive summarization from inferential testing and modeling.
Defensibility and auditability matter too. In regulated and academic settings, a result must be reproducible and the procedure documented. We favor tools with transparent vendor documentation, public method catalogs, and outputs that reviewers and auditors recognize. The convergence of statistical packages and AI-assisted analytics is tracked in IBM's augmented analytics overview, which frames how established categories are absorbing automation features.
We validated claims against official vendor and project documentation: Python documentation and scikit-learn documentation for scripted analytics, SPSS Statistics documentation for menu-driven inferential tests, SAS Viya documentation for regulated procedures, Stata documentation for reproducible econometric scripts, and CRAN documentation for R-based research workflows. Adoption velocity for agent-assisted analysis appears in the Stanford HAI AI Index. Full principles: editorial standards.
InfiniSynapse First-party Data (desk n=14)
Label: InfiniSynapse first-party data — Source: InfiniSynapse 2025–2026 Analytical Tool Selection Desk Composite (n=14) from customer-style pilots and internal bake-offs. Not a vendor census and not a paid survey. Methodology tags: skill mismatch, descriptive/inferential confusion, demo-only trials, black-box outputs, over-tooling. Peer sentiment markets (independent, not endorsements): Gartner Peer Insights — Analytics & BI · G2 Analytics Platforms.
| Desk finding | Share of n=14 | What it looked like in pilots |
|---|---|---|
| Skill mismatch (tool ≠ operator) | 5 / 14 (36%) | Code-first buy for non-coding team (or inverse) |
| Descriptive treated as inferential | 4 / 14 (29%) | Averages presented as “proof” without a test |
| Demo-only trial (failed on real exports) | 3 / 14 (21%) | Sample data passed; production joins broke |
| Black-box / non-reproducible output | 1 / 14 (7%) | No script, log, or procedure auditors could rerun |
| Over-tooling (SAS-class buy for standard runs) | 1 / 14 (7%) | Recurring cohort work did not need the full suite |
Quotable desk assertion: in this n=14 set, 36% of selection failures were skill mismatches—method fit without operator fit. Re-score the scorecard below on your real exports before licensing.
What Analytical Software Is
Not every tool that touches data is analytical software. A dashboard displays numbers. Analytical software interrogates them. The difference is whether it can move past description into inference and modeling—testing whether a difference is real, quantifying how strongly variables relate, or forecasting what happens next.
Key Definition: Analytical software performs statistical and modeling operations—hypothesis tests, regressions, clustering, forecasting—rather than only cleaning or visualizing data. Analytical tools for data analysis are this software. They turn raw observations into quantified, defensible conclusions.
The methods these tools implement are grounded in classical statistics, well summarized in the Wikipedia overview of statistics. What varies is how much statistical knowledge the operator needs and how reproducible the results are.
What Analytical Software Has to Do
Market pages describe four jobs: prepare, model, analyze, and visualize. Visualization is the output. The license is justified when the software can also cluster, segment, and score, then test whether the pattern is real.
| Job | What “done” looks like | Typical home |
|---|---|---|
| Prepare | A documented export | Warehouse or notebook |
| Model | A test, regression, or forecast you can rerun | Analytical software |
| Analyze | A stated question with a method | Analytical software |
| Visualize | A chart someone else can read | BI tool, or the package’s plot |
Cluster, segment, and score sit in the model row. A bar chart of those scores is the visualize row. A brochure that says analytics, and only ships the chart, is a BI tool.
Analytical Software vs BI Software
Tableau and Power BI answer what happened and what is trending, then share the view. Analytical software answers whether the difference is real, and what happens next.
| Question | BI software | Analytical software |
|---|---|---|
| What happened? | Shared dashboards | Descriptive stats |
| What is trending? | Tableau, Power BI | A time plot plus a test |
| Is the difference real? | Not the job | SPSS, R, Python, SAS, Stata |
| What happens next? | A forecast tile | A model you can rerun |
Excel, Power BI, and Fabric as one Microsoft stack are mapped on Power BI. Use that page when the buy is the Microsoft family. Stay here when the buy is a test, a model, or a forecast.
The Main Options Worth Knowing
The landscape spans free code and paid packages, and each occupies a distinct niche. The table below compares the options we most often recommend when teams need genuine statistics rather than presentation alone.
| Tool | Provider | Core methods | Skill required | Best for |
|---|---|---|---|---|
| Python (pandas, statsmodels, scikit-learn) | Python Software Foundation | Custom analysis, ML, forecasting | Programming | Industry teams needing flexible, reproducible analytics |
| R | R Foundation | Advanced statistics, research methods | Programming | Academic and research workflows |
| SPSS Statistics | IBM | t-tests, ANOVA, regression, factor analysis | Menu-driven | Social-science and survey analysis |
| SAS Viya | SAS Institute | Regulated, auditable procedures | Mixed | Banks, pharma, audited environments |
| Stata | StataCorp | Econometrics, panel data, survival analysis | Scripting | Economics, epidemiology, academic research |
Python dominates industry analytics because it is free, endlessly flexible, and reproducible, but it demands programming skill per Python documentation. R remains the common language of academic research with an unmatched catalog of methods. SPSS, SAS, and Stata persist where defensibility and standardized procedures matter more than customization.
Practical example: a healthcare analytics team needed monthly cohort survival comparisons across three hospital systems. They started in SPSS for documented, citable procedures auditors recognized, then migrated recurring cohort pulls to Python scripts once the method stabilized—cutting runtime from six hours to forty minutes while preserving reproducible logs. The hybrid approach matched the pattern Harvard Business Review's skills-based hiring research describes: teams justify analytical tooling by recovered analyst time while keeping results defensible under review.
Descriptive vs Inferential Methods
Analytical work divides into two families, and knowing which you need narrows the tool choice.
| Method family | Question it answers | Typical tools |
|---|---|---|
| Descriptive | What happened? | Spreadsheets, any analytical tool |
| Inferential | Is this real or chance? | R, SPSS, SAS, Python |
| Predictive | What happens next? | Python, R, AI-native agents |
Descriptive statistics—means, distributions, trends—are handled by almost any tool. Inferential methods, which test whether patterns generalize beyond the sample, demand genuine statistical procedures. Confusing the two—treating a descriptive average as if it proved a claim—is the most common analytical error; method literacy matters more than which license you buy. Desk n=14 tagged this confusion in 29% of failures.
Statistical Analytical Software
SPSS, SAS, and Stata are the menu-and-script end of analytical software. The dedicated packages persist for a reason: defensibility. SPSS, SAS, and Stata provide standardized, citable methods that reviewers and auditors recognize per SPSS Statistics documentation and SAS Viya documentation. That is why they remain fixtures in regulated and academic workflows despite the rise of free alternatives.
The cost is flexibility and price. These packages implement a fixed catalog of procedures; anything outside it requires escaping to code. For teams whose needs fit the catalog and who value documentation over customization, the packages are ideal; for teams needing novel methods, a notebook is better.
When to Use Code vs a Package vs an Agent
For analytical software, the decision comes down to three questions: how custom is the method, how much statistical skill is on the team, and how often the analysis repeats.
Use code (Python or R) when the method is custom, the team can program, and reproducibility matters. Use a statistical package when the method is standard, documentation is required, and a menu-driven interface suits the operator. Use an AI-native agent when the analysis is a standard analytic run—cohort comparisons, regressions, forecasts—that repeats and would otherwise consume analyst hours. The three are not mutually exclusive; many teams use all three, each for the situation it fits best.
When the method is novel, prioritize tools that script every step; when the method is standard and recurring, prioritize speed and reproducibility on the second run.
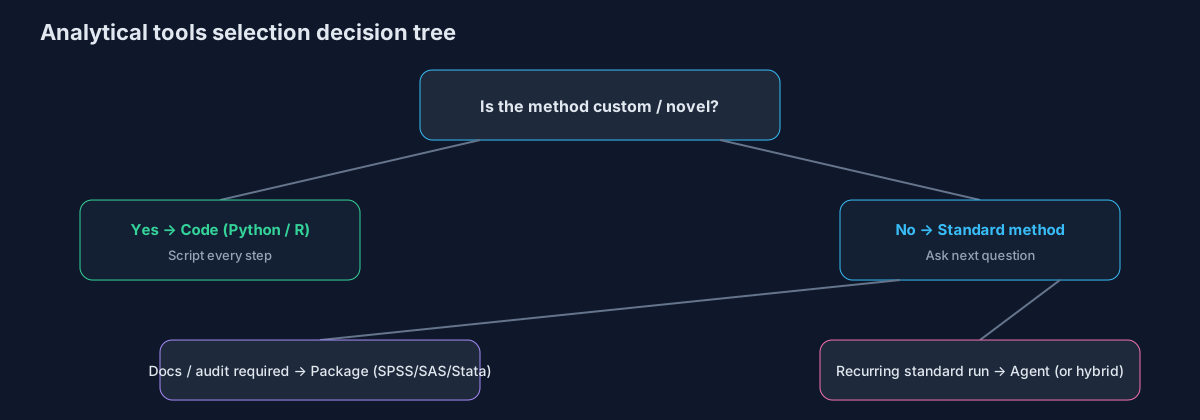 Decision tree: custom method → code; standard + documentation → package; standard + recurring → agent (or hybrid).
HowTo: Pick Analytical Tools in Four Steps
- Name the method family. Descriptive, inferential, or predictive—write the question in one sentence before shopping.
- Map operator skill. Programming, menu-driven, or mixed; desk n=14’s largest failure mode was skill mismatch (36%).
- Score the eight-check scorecard on a real export (not vendor sample data).
- Trial the second run. Measure time-to-repeat and whether a reviewer can reproduce the procedure from logs or scripts.
Where AI-Native Agents Fit
AI-native agents are the newest entry in this category, and their niche is standard analytics at scale without coding. They run cohort comparisons, regressions, and forecasts from a plain-language goal, plan the steps, execute them, and expose the queries for inspection. We explain the model in what AI-native data analysis means, and the Stanford HAI AI Index documents how quickly autonomy matured. For bespoke research modeling, a notebook still wins.
Analytical Tool Selection Scorecard
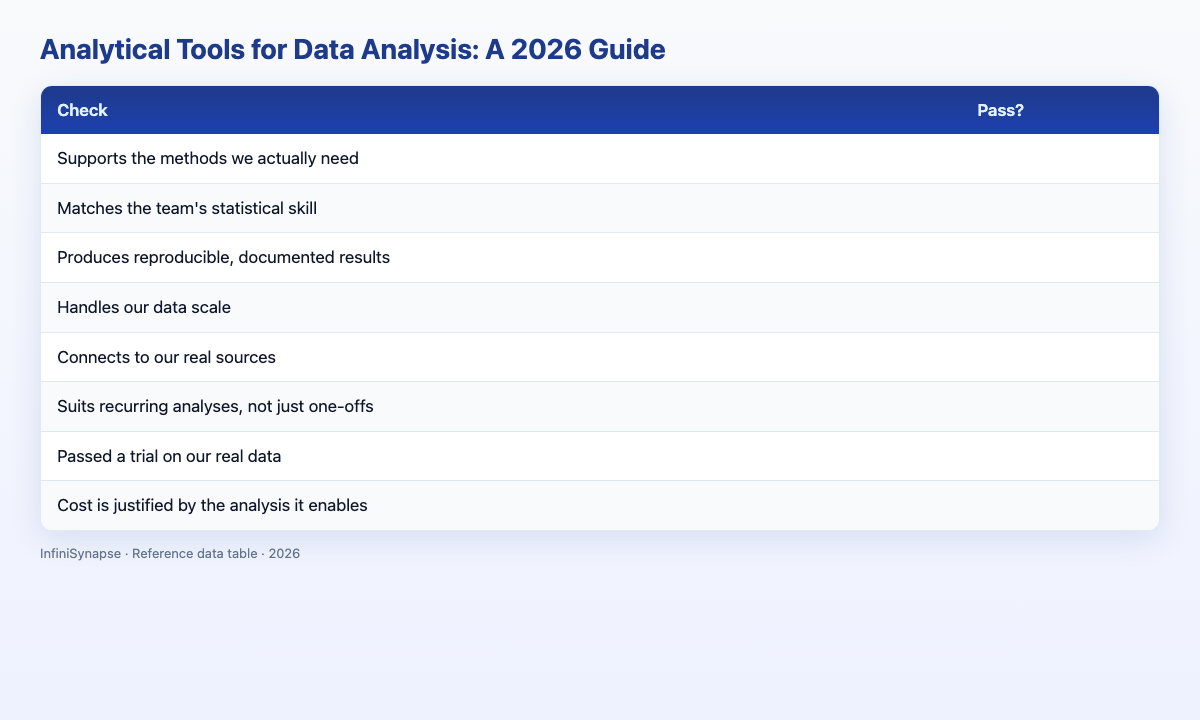
Score any option (1 point each):
| Check | Pass? |
|---|---|
| Supports the methods we actually need | |
| Matches the team's statistical skill | |
| Produces reproducible, documented results | |
| Handles our data scale | |
| Connects to our real sources | |
| Suits recurring analyses, not just one-offs | |
| Passed a trial on our real data | |
| Cost is justified by the analysis it enables |
6–8: strong fit. 3–5: scope it. Below 3: reconsider.
Reproducibility and Documentation
The quality that separates professional analytical work from casual number-crunching is reproducibility. A result you cannot reproduce is a result you cannot defend, and when a stakeholder or auditor asks how a figure was derived, “the tool said so” is not an acceptable answer. The strongest options either script every step—as Python, R, and Stata do—or log every procedure in a form others can rerun.
Menu-driven packages handle this through documented, standardized procedures that reviewers recognize. Code handles it through the script itself. AI-native agents handle it by exposing the actual queries and intermediate datasets behind each result. Insist on traceability—analysis that cannot be reproduced is closer to opinion than evidence.
Matching Tools to Team Skill
The most common selection mistake is buying for the method while ignoring the operator. A code-first tool in the hands of a team that cannot program strands the analysis; a menu-driven package can frustrate a skilled statistician who needs a method outside its catalog. Align three things: the methods the work requires, the skills the team already has, and the frequency with which the analysis repeats.
For a team of programmers running custom research, code is the natural fit. For domain experts who need standard inferential tests without writing loops, a menu-driven package fits better. For mixed teams where analysts, product managers, and founders all need answers, an AI-native agent that runs standard analytics from plain language broadens who can participate without lowering rigor.
In regulated settings, a result must be reproducible and the procedure documented before it reaches a decision-maker. That requirement shapes which options survive audit review and which look impressive in a demo but fail under scrutiny.
When Analytical Software Is the Wrong Purchase
If the audience only needs a shared report, buy BI software. A dashboard is not a failed hypothesis test, and it does not become analytical software because the menu says analytics.
If the question is about source code, builds, or runtime behavior, that field is software analytics. It is a different purchase from the statistical software on this page.
Common Failure Modes
Failure 1: Confusing descriptive with inferential. No tool prevents mistaking an average for proof; method literacy does.
Failure 2: Over-tooling. Not every team needs SAS; many needs are standard runs an agent handles.
Failure 3: Black-box results. Outputs that cannot be traced to a procedure are indefensible.
Failure 4: Skill mismatch. Buying a code-first tool for a team that cannot code strands the analysis.
Failure 5: Demo-only trials. Options that look strong on sample data but fail on your exports waste budget and morale—desk n=14 saw this in 21% of cases.
Frequently Asked Questions
What is analytical software?
Analytical software tests, models, and forecasts. Python, R, SPSS, SAS, Stata, and AI-native agents are the usual set. A chart tool that cannot run those methods is a different category.
What are analytical tools for data analysis?
analytical tools for data analysis are statistical and modeling software—Python, R, SPSS, SAS, Stata, and AI-native agents—that go beyond charts to test hypotheses, quantify relationships, and predict outcomes.
What is the best analytical tool for statistics?
The best pick depends on your needs: R and Python for flexible, reproducible statistics; SPSS for accessible menu-driven tests; SAS for regulated, documented procedures; and Stata for econometric research. Match method and team skills.
Do these tools require coding?
Some do and some do not. Python and R require coding; SPSS and SAS are largely menu-driven; and AI-native agents let you run standard analyses by describing the goal in plain language.
What is the difference between descriptive and inferential tools?
Descriptive analysis summarizes what happened—means, trends, distributions. Inferential analysis tests whether patterns generalize beyond the sample and requires proper statistical procedures such as R, SPSS, SAS, or Python.
Can AI-native agents replace statistical software?
For standard analytics—cohort comparisons, regressions, forecasts—agents can replace much manual work and expose queries for reproducibility. For bespoke research modeling and novel methods, R, Python notebooks, or SAS still win.
Are the desk percentages a vendor survey?
No. They are InfiniSynapse first-party desk composites (n=14). See First-party Data and editorial standards.
Conclusion
Analytical software earns the name by moving past description into inference and modeling. Analytical tools for data analysis are that set. Choose by the method you need and the skills you have—code for custom work, a package for documented procedures, an agent for standard analytics that repeats.
Product recommendation (commercial)
Label: The following is a commercial product recommendation, separate from the editorial guidance above.
If your analytical work is standard and recurring, an AI-native agent can remove drudgery while keeping results inspectable. See how AI-native data analysis works and optionally try the InfiniSynapse web app (free on registration). Desk n=14 findings and vendor documentation citations above are not product endorsements.