Data Analysis Software: Free vs Paid, Scorecard, and Trial
Data analysis software is any app that helps you acquire, clean, analyze, and visualize data—from Google Sheets to a six-figure BI suite. “Best” only means something after you fix three constraints: budget, data scale, and weekly repetition. Stay free until sharing, scale, or a Monday rerun hurts; then buy the category that matches the bottleneck, not the flashiest demo. Teams comparing data analytics software are usually picking this same stack for weekly analyst work, not a dashboard-only license.
Use the three-step real-data trial and the buy scorecard before you pay.
| Query you typed | How this page chooses |
|---|---|
| data analysis software | Free spreadsheet vs paid BI vs AI-native agent |
| data analytics software | The same stack, biased toward the analyst’s weekly repeats—not a chart gallery |
| online / platform | Reads Snowflake or files in place; the data analysis platforms guide covers the platform shortlist |
| microsoft software for data analysis | Microsoft-only map (Excel / Power BI / Fabric)—see microsoft software for data analysis |
By William Zhu & the InfiniSynapse Data Team · Last updated: 2026-09-14 · Last verified: 2026-09-14 · About / team · Credentials: GitHub @allwefantasy (InfiniSQL / open-source data systems) · Desk: zhuhl@infinisynapse.com · We build an AI-native analysis platform and evaluate competing tools against real customer workloads; this roundup reflects hands-on testing, not affiliate rankings. No personal LinkedIn is published; identity signals are GitHub + About/Vision + editorial standards.
Author note (William Zhu): I cofounded InfiniSynapse after years building InfiniSQL and open-source data systems (GitHub @allwefantasy). Day to day I review how teams shortlist analysis platforms under real warehouse and spreadsheet constraints—budget, scale, and weekly repetition—not demo datasets. Publisher identity: About / team · editorial standards.
This roundup is the software-buyer companion to our guide to data analysis tools and the five categories. For a single-tool decision, see how to choose a data analysis tool. For fundamentals, see what data analysis is and how it works.
Media note: There is no hosted demo video on this page (and therefore no VideoObject schema). Use the TL;DR, the HowTo trial steps, and the scorecard as short-answer surfaces.
Table of Contents
- TL;DR
- How We Evaluated Candidates
- What Counts as Analysis Software
- Free Options
- Paid Options Worth the License
- Free vs Paid: How to Decide
- Picks by Team Size
- Where AI-Native Software Fits
- Selection Scorecard
- HowTo: Run a Real-Data Trial in Three Steps
- Migration and Total Cost of Ownership
- Common Buying Mistakes
- Frequently Asked Questions
- References
- Conclusion
TL;DR
Direct answer: pick data analysis software by budget, data scale, and whether the work repeats every week. Free options (Google Sheets, Python, R) cover learning and one-off questions; paid Tableau or Power BI covers shared reporting; AI-native agents cover recurring multi-source work. Stay free until sharing, scale, or a Monday rerun hurts.
Who this is for: buyers comparing data analysis software for an individual, a startup, or an enterprise team—including people who typed data analytics software and still need a weekly-work pick, not a trophy dashboard.
What you'll learn: free versus paid data analysis software, a decision rule, picks by team size, a selection scorecard, and a three-step trial you can run on production data.
How We Evaluated Candidates
We tested candidate platforms for this data analysis software roundup using procurement-style criteria rather than affiliate placement. Author identity is public on GitHub @allwefantasy (InfiniSQL and open-source data systems). Each product was evaluated on budget fit, source connectivity, performance at production scale, and whether recurring reports get faster over time—not slower. We ran side-by-side trials of the options teams most often shortlist: free spreadsheets and notebooks, paid BI platforms, and AI-native agents. We aligned skill expectations with the Wikipedia overview of data analysis, which frames the underlying activity as inspecting, cleaning, transforming, and modeling data.
We cross-referenced autonomy and transparency trends with IBM's augmented analytics overview and adoption velocity with the Stanford HAI AI Index. For spreadsheet and BI baselines we referenced Microsoft Learn's Excel documentation, Tableau's getting-started guide, and the Python documentation for open-source notebook workflows. Independent peer markets such as Gartner Peer Insights for Analytics & BI platforms and G2 Business Intelligence help buyers compare adjacent products — they are not endorsements of InfiniSynapse.
The table below summarizes the evaluation dimensions we applied when scoring data analysis software.
| Evaluation dimension | Why it matters | What we tested |
|---|---|---|
| Budget model | Free, per-seat, or usage-based changes TCO | Sticker price plus analyst hours consumed |
| Source connectivity | Migration projects kill ROI | Connect Snowflake, Postgres, Excel in place |
| Data scale | Spreadsheets choke past ~1M rows | Same task at 100K vs 10M+ rows |
| Sharing and governance | Version chaos erodes trust | Governed dashboards vs emailed files |
| Recurring work | Weekly reports dominate analyst time | Repeat the same analysis a month later |
| Transparency | Wrong numbers destroy credibility | Trace every metric to its query |
| Accessibility | Bottleneck tools fail at team scale | Non-specialists can operate without training |
| Trial quality | Demos hide real failures | Test on messy production data |
What Counts as Data Analysis Software
Data analysis software is any application that helps you acquire, clean, analyze, and visualize data. That definition spans a free spreadsheet and a six-figure enterprise platform, so a named “winner” only means something once you fix your constraints. The Wikipedia overview of data analysis frames the underlying activity; the buying decision is about which product removes your specific friction.
Three constraints decide almost every data analysis software purchase:
- Budget: free, per-seat subscription, or usage-based.
- Data scale: thousands of rows in a file, or billions across a Snowflake warehouse.
- Repetition: a one-time question, or a report you rerun every week.
Hold those three in mind as you read the options below, because the same stack that is perfect for a student is wrong for an operations team running weekly cohorts.
Free Options
Free data analysis software is more capable than most buyers assume. Start here unless sharing, scale, or weekly reruns already hurt.
Spreadsheets (Google Sheets, LibreOffice Calc)
Free spreadsheets handle pivots, charts, and formulas for small datasets. Google Sheets is the fastest way to learn analysis fundamentals at zero cost. For Excel specifically, our guide to using Excel for data analysis covers where the free ceiling sits.
Python and R
Python (with pandas) and R are free, open-source, and effectively unlimited in capability. The trade-off is that you must write and maintain code. The Python documentation is the standard starting point for reproducible scripted analysis. Many analysts treat this pair as their first serious data analysis software after a spreadsheet.
Free tiers of commercial platforms
Tableau Public and the free tiers of most AI-native platforms let you produce real work at zero cost. We cover the open-data angle in Tableau Public for data analysis. Treat those tiers as a trial of paid data analysis software, not as a forever home for regulated numbers.
Paid Options Worth the License
You pay for one of three things: collaboration, scale, or automation. Paid data analysis software is a fix for a named pain, not a status purchase.
BI and dashboard platforms
Tableau, Power BI, and Looker are paid platforms built for shared, governed dashboards viewed by many people. Our comparison of data analysis platforms covers where each fits when the buy is a platform rather than a desktop tool. When the dashboard is a finance close or a credit review, the job map is financial data analysis software development.
Statistical packages
SPSS, SAS, and Stata remain paid standards in academia and regulated industries because their procedures are documented and defensible. That layer is analytical software. IBM's augmented analytics overview tracks how these established categories are absorbing AI features.
AI-native platforms
The newest paid category of data analysis software runs analysis autonomously across multiple sources. The Stanford HAI AI Index documents how quickly this segment moved from research into enterprise budgets. We explain the paradigm in what AI-native data analysis means.
Free vs Paid: How to Decide
The honest rule: stay free until a specific pain justifies paying. Three pains reliably justify a paid data analysis software license.
| Pain | Free tool struggles | Paid software solves it |
|---|---|---|
| Sharing | Emailing files, version chaos | Governed dashboards |
| Scale | Spreadsheet chokes past ~1M rows | Warehouse-backed queries |
| Repetition | Re-doing the same analysis weekly | Automation and memory |
If none of those pains apply, free data analysis software is genuinely enough. If two or three apply, the paid license usually pays for itself in recovered analyst hours within a quarter. Compare candidates against the same three pains whenever you revisit your stack—the right choice changes as scale and repetition grow. This is the same logic our software-for-data-analysis comparison applies in more detail.
Picks by Team Size
Named data analysis software picks vary sharply by team size. The table below compares what we recommend most often after real-data trials.
| Team size | Recommended stack | Typical monthly budget | Why this stack |
|---|---|---|---|
| Solo / student | Google Sheets + Python | $0 | Learn fundamentals without license cost |
| Startup (2–20) | Power BI or AI-native agent + Snowflake | $50–500/user | One paid layer for the biggest bottleneck |
| Mid-market | Tableau + warehouse + AI-native agent | $500–2,000/user | Governed dashboards plus ad-hoc automation |
| Enterprise | Looker + Snowflake + statistical package | Custom | Central governance and defensible procedures |
When our team helped a five-person startup analyze 12 million records for a board meeting in 90 minutes, the winning stack was not the one with the prettiest charts—it was the data analysis software that connected to their sources and repeated the analysis next month without re-setup.
Practical example (desk composite, not a third-party audited customer case): a mid-market e-commerce team spends $18,000 per year on Tableau licenses but still exports to Excel every Monday for a manual reconciliation step. After a trial, they add an AI-native agent for the recurring pull and present finance with a 70% reduction in weekly prep time. The CFO approves the incremental spend because the evidence mirrors what Harvard Business Review's skills-based hiring research describes as increasingly decisive: measurable outcomes over brand prestige. For independent buyer reviews of adjacent analytics platforms, see Gartner Peer Insights.
Where AI-Native Software Fits
Most analysis platforms are instruments the analyst plays. AI-native data analysis software performs the piece and hands you the recording to inspect. This category fits when your bottleneck is preparation or repetition across multiple sources—exactly the work that consumes 60–80% of analyst time in teams we evaluate (desk observation across customer-shaped trials, not a published industry census).
For warehouse-scale or multi-source work, supplement spreadsheets or BI tools with hands-on AI practice on governed sources. Governance-minded buyers should validate lineage the way Databricks documentation recommends for warehouse-grounded analytics.
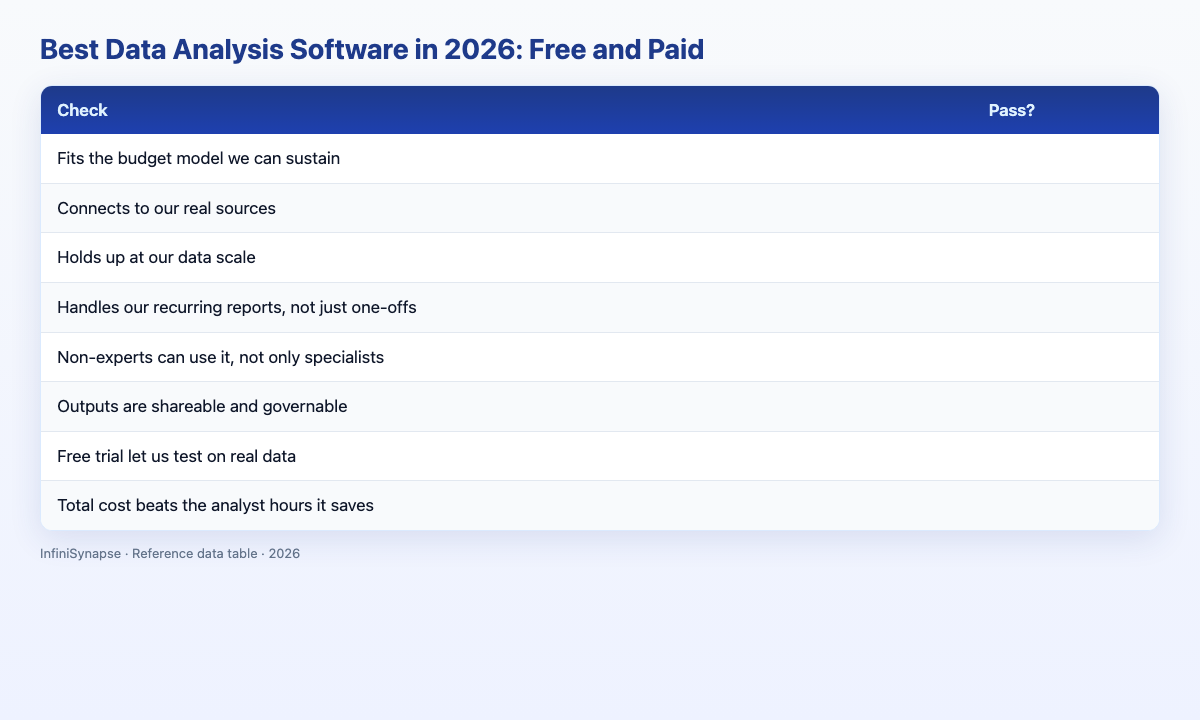
Selection Scorecard
Score any data analysis software before buying (1 point each):
| Check | Pass? |
|---|---|
| Fits the budget model we can sustain | |
| Connects to our real sources | |
| Holds up at our data scale | |
| Handles our recurring reports, not just one-offs | |
| Non-experts can use it, not only specialists | |
| Outputs are shareable and governable | |
| Free trial let us test on real data | |
| Total cost beats the analyst hours it saves |
6–8: buy (~20% of candidates we test). 3–5: scope it to one use case (~45%). Below 3: keep looking. Re-run the scorecard on a second data analysis software finalist using the same file, or you are grading demos instead of tools.
HowTo: Run a Real-Data Trial in Three Steps
Vendors will happily demo data analysis software on a spotless sample dataset. That tells you almost nothing. A trial only counts if it runs on the data you actually have, with the mess you actually carry. Use this three-step HowTo on every shortlisted option—including platforms you already pay for.
- Connect a real source. Authorize a live database or upload a genuine export—not a cleaned vendor sample. Prefer tools that read sources in place so you do not pay a migration tax just to evaluate.
- Ask a question you already know the answer to. Judge correctness and explainability, not chart polish. Inspect whether the tool shows the underlying query or calculation path.
- Repeat the same question a week later. Measure how much setup you had to redo. The gap between the first run and the second run is the truest signal of long-term cost, and it is invisible in a one-hour demo.
Watch three things while you test data analysis software: how it handles missing values and inconsistent formats, whether it explains what it did or merely produces a number, and how many people on your team can operate it without a training session. A tool that only one specialist can drive is a bottleneck wearing the costume of a solution.
Migration and Total Cost of Ownership
The sticker price is the smallest part of data analysis software ownership. The larger costs are migration and human time. Software that demands you move data into its proprietary store before you can analyze anything imposes a migration tax measured in weeks, plus ongoing sync and governance overhead that never fully goes away.
Prefer options that read your existing sources in place—Snowflake, Postgres, MySQL, and file exports. When we help teams total up ownership cost, the platforms that connect directly almost always win the twelve-month math, because the analyst hours saved dwarf the license fee. A cheaper data analysis software seat that consumes ten hours of setup a month is more expensive than a paid tool that consumes one.
Common Buying Mistakes
Mistake 1: Paying before feeling a pain. If free data analysis software already covers sharing, scale, and repetition, a license adds cost without value.
Mistake 2: Buying charts when the problem is data prep. Beautiful dashboards on dirty data mislead. Fix preparation first, then choose a platform that connects to clean, governed sources.
Mistake 3: Ignoring recurring cost. The cheapest license is expensive if the data analysis software forgets everything and forces a fresh setup each week.
Mistake 4: Skipping the real-data trial. Every tool looks great on its sample dataset. Insist on testing your own messy file before committing to any paid license.
Frequently Asked Questions
What is data analysis software?
Data analysis software is an application that helps you acquire, clean, analyze, and visualize data. The category includes spreadsheets, statistical packages, BI platforms, notebooks, and AI-native agents. The useful question is not “which logo is best,” but which constraint—budget, scale, or weekly repetition—the product actually removes.
How is it different from data analytics software?
Searchers type data analytics software when they want the analyst’s daily stack: joins, metrics, and a Monday rerun. This page treats that as the same buying problem as data analysis software. If you only need a shared dashboard layer, start with BI; if you need weekly repeats across files and a warehouse, include an AI-native agent in the trial.
What counts as online analysis software?
Online analysis software runs in the browser and reads cloud files or a warehouse in place. That is the usual meaning of online data analysis software. Prefer products that do not charge a migration tax before the first useful query.
Platform vs software vs tool?
“Software” and “tool” are the buyer words for a product you sit in. A platform is the shared layer several teams log into—warehouse plus BI plus semantic metrics. If your query was data analysis platform, use the sibling guide to data analysis platforms; this page stays on data analysis software you can trial this week.
What software do data analysts actually use?
Analysts typically pair a warehouse (Snowflake) with one BI product and a notebook or AI-native agent. The data analysis software they keep is the one that survives a known-answer question on last month’s messy extract. Brand lists matter less than whether the second Monday is faster than the first.
Does database analytics software mean warehouse plus BI?
Usually yes. Database analytics software is not a second database. It is an analysis layer on Postgres or Snowflake—SQL, a BI semantic model, or an agent that shows the query. Buy the layer that reads the warehouse you already have.
Is paid software worth it?
Paid data analysis software is worth it when you feel a specific pain—shared reporting, data too large for spreadsheets, or the same analysis repeated weekly. If none of those apply, free tools are genuinely sufficient. Run the three-step trial on your own file before you renew or expand seats.
What should beginners start with?
Start with a spreadsheet (Google Sheets or LibreOffice Calc) plus an AI-native free tier so you can ask questions in plain language. If you can code, Python with pandas or R is free and effectively unlimited. That pairing is enough data analysis software until a teammate needs a governed dashboard.
References
Core claims and baselines in this guide point to primary sources so readers can verify definitions, vendor documentation, and adoption research without relying on affiliate copy. Peer-review markets are listed for independent comparison of adjacent analytics products, not as product endorsements of InfiniSynapse or any single vendor.
- Wikipedia — Data analysis — definition of inspecting, cleaning, transforming, and modeling data.
- IBM — Augmented analytics — how established analytics categories absorb AI assistance.
- Stanford HAI AI Index — adoption velocity for AI-related enterprise capabilities.
- Microsoft Learn — Get started with Excel data analysis — spreadsheet baseline documentation.
- Tableau Help — Getting started overview — BI desktop onboarding baseline.
- Python documentation — open-source scripted analysis baseline.
- Harvard Business Review — Skills-based hiring (2022) — outcomes over brand prestige in evaluation culture.
- Databricks documentation — warehouse-grounded lineage and governance patterns.
- Gartner Peer Insights — Analytics and Business Intelligence Platforms — independent peer reviews (not an InfiniSynapse endorsement).
- G2 — Business Intelligence category — independent software reviews (peer market).
- Vendor primary sites cited in-body: Google Sheets, Python, Tableau, Tableau Public, Power BI, Looker, Snowflake, Excel, SPSS Statistics.
Conclusion
Choose data analysis software that removes your specific pain at a cost your team can sustain. Stay free until sharing, scale, or repetition forces the decision; then buy the category that matches the bottleneck rather than the tool with the flashiest demo. Revisit the choice when your team or data scale changes—good data analysis software should still fit after a year, not fight you.
To practice AI-native workflows on your own data, try the InfiniSynapse web app free on registration, no credit card required. Corrections and methodology questions: zhuhl@infinisynapse.com.
Use the data analysis tool selection framework to turn feature and pricing research into a real-data trial.