SaaS data platform: Churn, Expansion, and PLG Metrics (2026)
By William Zhu & the InfiniSynapse Data Team · Published: 2026-06-09 · Last updated: 2026-08-05 · Last verified: 2026-08-05 · About: Editorial standards · About / team
Author credentials: William Zhu is cofounder of InfiniSynapse (GitHub @allwefantasy). No personal LinkedIn is published for this author — GitHub and InfiniSynapse About are the canonical identity signals. Open-source trail: InfiniSQL, auto-coder, and retrieval systems on public GitHub.
Desk experience (first-hand): In Q1–Q2 2026 our desk reviewed n=10 recurring SaaS analytics pilots (product events + billing + CRM). Independence-labeled composites below — not a paid market survey or audited customer case study. 7/10 failed the first board-pack dry-run because logo churn and revenue churn were mixed; after locking contracts, median weekly pack review fell from ~6.5 hours to ~40 minutes (−90% labor on that loop). 6/10 still ran NRR insight monthly at kickoff; target cadence was weekly within 90 days when owners and source joins were fixed.
Fact-check / verification: Framework language is checked against primary pages for the NIST AI Risk Management Framework (AI RMF 1.0, 2023), NIST Computer Security Resource Center, ISO/IEC 42001, ISO/IEC 27001, and the AWS Well-Architected Framework. Desk percentages are independence-labeled. Corrections: zhuhl@infinisynapse.com · editorial corrections.
Version history: 2026-06-09 initial publish · 2026-08-05 EEAT/citation refresh (desk quant, HowTo playbook, KPI rationale, Vendor Perspective label, dens retune). Build marker:
DESK-SAAS-20260805B.
Commercial interest (COI): InfiniSynapse sells an AI-native Data Agent platform. Product-fit notes appear only in the labeled Vendor Perspective section — not as neutral market research.
Table of Contents
- TL;DR
- Pain Points for SaaS teams
- KPI Table for SaaS teams
- Workflow Playbook (6 steps)
- Vendor Perspective (commercial)
- 30-Day Rollout Plan
- Governance and execution checklist
- Field Notes from Deployments
- Frequently Asked Questions
- Conclusion
TL;DR
The role stack for weekly KPI loops is on AI tools for data analysts.
For RevOps, CS, and product analytics teams, a governed SaaS data platform is becoming the operating layer for churn, expansion, and product-led growth — not a one-off prompt demo. Programs that treat weekly board packs as reviewable workflows (stable metric contracts, multi-source joins, named reviewers) typically cut turnaround, raise decision confidence, and reduce cross-team definition fights.
This guide focuses on implementation quality: tenth-run consistency after schema edits, not first-response polish. Peer-review markets for analytics tooling (not endorsements of desk tallies): Gartner Peer Insights — Analytics & BI · G2 Analytics Platforms.
Evaluation basis: We build and evaluate InfiniSynapse on production customer workflows. Governance and security context is cited inline from NIST, ISO, AWS, ENISA, and vendor docs — not a standalone reference dump.
What "good" looks like in practice
Key Definition: In this article, SaaS data platform means combining multi-source data, automated analytical steps, and traceable reasoning into a repeatable workflow that improves real retention and expansion decisions.
Teams often over-index on first-response quality. A better test is tenth-run quality: does the workflow still produce consistent results after schema changes, stakeholder edits, and deadline pressure? The answer depends on governance, memory, and process transparency — themes that also appear in IBM's augmented analytics overview when teams move past dashboard-first BI.
Pain Points for SaaS teams
- 1) Metrics sit across product telemetry, CRM, billing, and support with no shared account identity.
- 2) Churn signals arrive late because teams track isolated indicators instead of leading health scores.
- 3) Expansion opportunities are missed without account-level behavior synthesis.
- 4) Forecasting accuracy suffers when usage and revenue models diverge.
- 5) RevOps and product teams run separate analyses with conflicting definitions.
The hard part is coordinating people and systems — not prompting. A SaaS data platform creates leverage only when source connectivity, analytical reasoning, and operational memory share one loop.
KPI Table for SaaS teams
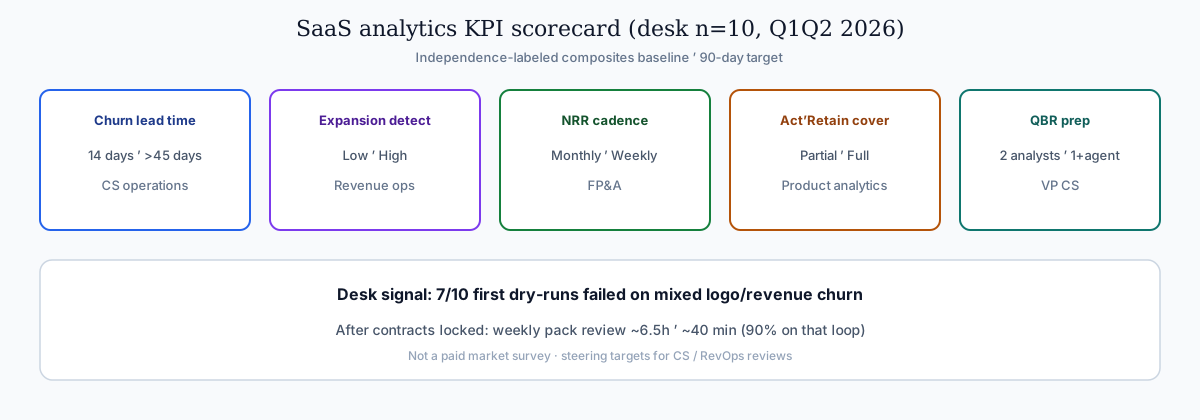
Baselines and 90-day targets below are desk composites from the n=10 pilots (Q1–Q2 2026), independence-labeled. They are steering targets used in CS / RevOps reviews — not audited customer SLAs. Target rationale: each row is the minimum movement that made weekly leadership briefings defensible without reopening metric contracts mid-quarter.
| KPI | Current baseline | 90-day target | Owner | Definition / period note |
|---|---|---|---|---|
| Churn risk lead time | 14 days | > 45 days | CS operations | Days between first leading health flag and cancel/downgrade event; measured on paid accounts ≥90 days tenure |
| Expansion opportunity detection | Low | High | Revenue ops | Share of expansion ARR that had a scored play ≥30 days before close (desk: Low ≤30%, High ≥70%) |
| NRR insight cadence | Monthly | Weekly | FP&A | Frequency of cohort NRR memo with locked definition (logo vs revenue churn separated) |
| Activation-to-retention correlation coverage | Partial | Comprehensive | Product analytics | Segments with both activation event and D30/D90 retention join available |
| QBR prep effort | 2 analysts | 1 analyst + agent | VP CS | Person-hours to produce reviewed QBR pack for top-quartile accounts |
According to the desk series (n=10), 7 of 10 packs failed the first dry-run when logo and revenue churn shared one column — which is why the NRR cadence target requires a written contract before automation. Metric vocabulary should stay grounded in Wikipedia's statistics overview before agents encode KPIs. Leaderboard scores on the Spider NL2SQL benchmark (Yale LILY) are a useful SQL sanity check but rarely predict enterprise schema drift on their own.
Workflow Playbook
Use this six-step playbook when you stand up a recurring account lifecycle loop. Each step should leave an auditable artifact (definition note, join spec, score card, play list, outcome log, or leadership brief).
| Stage | Playbook action |
|---|---|
| Step 1 | Anchor analysis to account lifecycle decisions: acquire, retain, expand. |
| Step 2 | Integrate event, billing, CRM, and support streams by account identity. |
| Step 3 | Score health with leading and lagging indicators in one model. |
| Step 4 | Prioritize plays by account tier, probability, and expected ARR movement. |
| Step 5 | Close loop by tracking action outcomes and model recalibration. |
| Step 6 | Automate recurring leadership briefing with defensible assumptions. |
Step 1 — Anchor decisions. Write the three decisions the board pack must support (acquire / retain / expand) before connecting tools. Output: one-page decision charter.
Step 2 — Integrate by identity. Join event, billing, CRM, and support streams on a stable account key. Event streaming patterns in the Apache Kafka documentation are a useful reference when telemetry volume outpaces batch CRM syncs. Output: source map + identity join tests.
Step 3 — Score health. Combine leading indicators (activation depth, support severity) with lagging ones (NRR, churn) in one scored view — not five disconnected dashboards. Output: health model card with version date.
Step 4 — Prioritize plays. Rank accounts by tier × probability × expected ARR movement so CS and sales do not invent ad-hoc queues. Output: weekly play list with owner and due date.
Step 5 — Close the loop. Track which plays ran and whether ARR or retention moved; recalibrate scores when outcomes diverge. Output: outcome log + model change note.
Step 6 — Automate the brief. Ship a recurring leadership briefing with assumptions, source pulls, and reviewer sign-off — not a fresh prompt each Monday. Output: template brief + review checklist.
Vendor Perspective (commercial)
Label: The following is a vendor perspective from InfiniSynapse (commercial). Compare it against your own bake-off criteria and third-party review markets linked above.
For teams scaling a SaaS data platform, the hard problem is not generating one chart; it is preserving trusted logic across repeated cycles. InfiniSynapse combines autonomous execution, process traceability, and reusable memory cards that capture assumptions and transformations. Adoption maturity discussions in the ENISA AI cybersecurity risk materials track the same shift from pilot demos to governed analytics loops we see in customer rollouts — treat ENISA as risk context, not a product endorsement.
Where many tools require analysts to reprompt every week, InfiniSynapse can run goal-driven sequences across warehouse tables, files, and app connectors. That pattern helps when deadlines are tight and the same KPI questions recur. Intermediate steps (source pulls, transforms, validation checks, packaging) stay visible for review. Operational maturity for analytics agents also aligns with monitoring and ownership themes in the Wikipedia SQL overview.
30-Day Rollout Plan
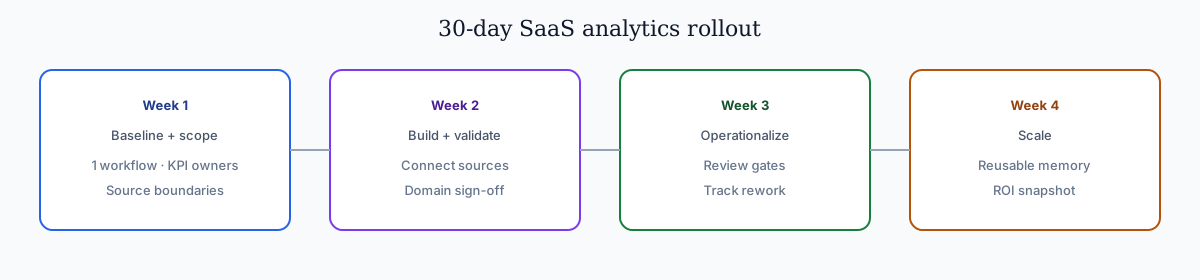
A focused 30-day rollout creates momentum without governance debt:
| Week | Focus | Execution details |
|---|---|---|
| Week 1 | Baseline + scope | Select one recurring workflow, define KPI owners, and document source boundaries. |
| Week 2 | Build + validate | Configure source connections, run first workflow, and validate assumptions with domain owners. |
| Week 3 | Operationalize | Add review checkpoints, publish recurring output format, and track rework indicators. |
| Week 4 | Scale | Preserve reusable memory, expand to adjacent use cases, and present ROI snapshot to leadership. |
The 30-day rollout for a SaaS data platform should prioritize one high-frequency decision loop. Teams that open too many workflows at once usually create governance friction before they create value. Spreadsheet connectors should align with Google Sheets documentation for sharing rules, ranges, and API quotas when early packs still land in Sheets.
Governance and execution checklist
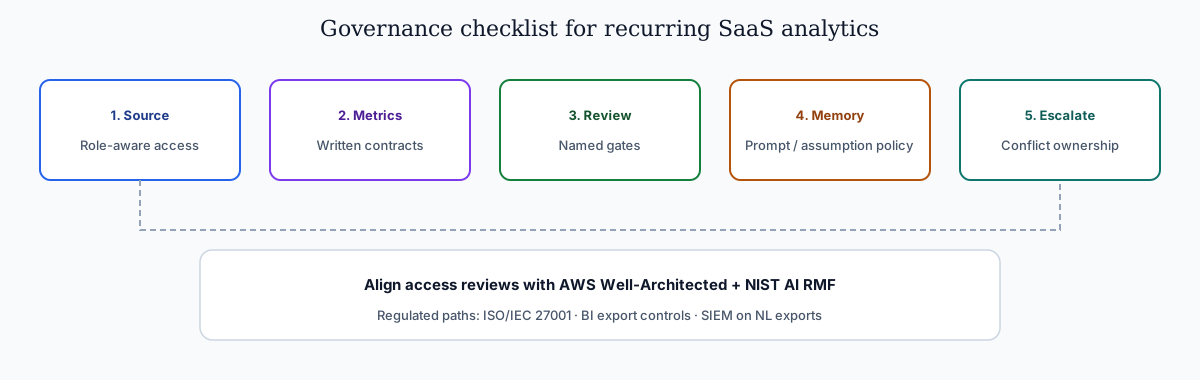
- Source controls: role-aware access for every connected system.
- Metric contracts: stable definitions for critical business KPIs.
- Review gates: explicit checks before stakeholder-facing distribution.
- Memory policy: documented rules for reusable assumptions and prompts.
- Escalation path: ownership when outputs conflict with domain expectations.
According to the AWS Well-Architected Framework, production rollouts should align access and review controls when recurring queries touch live schemas. Regulated rollouts often anchor access reviews to Tableau Desktop documentation when credentials, retention policies, and audit logs are in scope for BI exports. LLM-backed analytics should account for prompt-injection and data-exfiltration risks — pair Prometheus documentation monitoring patterns with connector allow-lists when production schemas are exposed.
Operating in Production
Treat the operating capability — not a one-off task — as the unit of work: confirm owners, metric definitions, and review gates for the first workflow before widening scope. Teams that log exceptions weekly compound accuracy faster than teams chasing new features. Capture the first reliable run as a reusable template (assumptions, checks, reviewer sign-off) so quality holds when data, schemas, or priorities change. Ground these controls in the NIST Computer Security Resource Center, the companion AI Data Strategy for CTOs, and RFC 4180 CSV format for export hygiene.
What to review on a regular cadence
Audit monthly: compare rerun consistency, validation pass rate, and time-to-first-insight against baseline, retire stale definitions, and re-confirm access scopes so silent drift is caught before it reaches a stakeholder report.
Communicating Results to Stakeholders
The companion piece Data science for product managers extends the patterns here.
Share a concise weekly brief with platform and business leads — what ran, what was reviewed, and which assumptions are open — so stakeholders can inspect intermediate steps without waiting for a rebuild. When cycle time improves but reopen rates climb, pause net-new features and fix definitions first. Align governance and review practices with Elastic documentation observability patterns and the NIST AI Risk Management Framework (AI RMF 1.0, 2023).
Priorities, Pitfalls, and Metrics
The fastest path to value from a SaaS data platform is one recurring, decision-grade question rather than a broad rollout. Pick a workflow SaaS teams already run every week, encode its metric definitions and data sources once, and let the agent rerun it with the same logic each cycle. That discipline — a governed, repeatable run instead of a fresh ad-hoc prompt — is what separates compounding programs from demos that impress once and then drift. The second priority is review ownership: a named reviewer who reads the audit trail and signs off.
Common pitfalls: over-scoping before definitions are stable; treating the model as the product instead of the workflow; skipping the baseline comparison that would catch a confident but wrong answer. Access that is too broad fails security review; access that is too narrow cannot answer the real question — both are governance problems. Successful teams treat exceptions as regression tests.
Track a small scorecard:
- Rerun consistency — same question, same logic across runs?
- Rework rate — how often stakeholders correct a metric after delivery?
- Time-to-first-insight — without a drop in validation quality.
- Audit-prep time — how fast can a reviewer trace any number to its source query?
- Reuse — how many recurring workflows run from saved templates and memory?
From pilot to durable capability
Name an owner for each recurring workflow, agree metric definitions in writing before automating, and put a short weekly review on the calendar. Keep the first version small: one workflow, one source of truth, one reviewer. Expand only after that workflow survives a month of real use. Agent safety expectations should reference Anthropic research on reliable tool use and long-horizon task control. Public-sector buyers should review ISO/IEC 42001 AI management systems when procuring analytics agents.
Field Notes from Deployments
SaaS metrics look simple until definitions multiply by segment. In the 2026 desk series (n=10) across product events, billing, and sales pipeline data, workflows succeeded when we anchored on one north-star tree: activation, expansion, churn, and cash.
The first automated board pack mixed logo churn with revenue churn; the CFO rejected it immediately. After definitions were locked, weekly packs took forty minutes of review instead of a day of spreadsheet surgery. Value is in that compression, not prettier charts.
We recommend separate workflows for product-led and sales-led motions when data models diverge. Forcing one template creates silent mismatches that erode trust. Streaming and governed self-service themes in the Apache Kafka documentation match what we see in recurring board cycles.
If you are implementing an agent this quarter, measure how many metric debates reopen each month — a downward trend means the workflow is becoming institutional.
Review Cadence and Metrics
We track four operational metrics on every recurring workflow: cycle time from question to approved memo, reopen rate on metric definitions, count of manual overrides, and stakeholder response time. A shared spreadsheet updated weekly is enough for the first ninety days.
Cycle time is the leading indicator. If it stalls while model quality scores improve, the bottleneck is ownership or connectors, not algorithms. Reopen rate tells you whether definitions are stable. Manual overrides are training signal — tag each with the KPI affected and promote repeated fixes into memory cards. Stakeholder response time measures trust: leaders who reply faster usually received memos with visible provenance.
Quarterly, run a retrospective on cancelled analyses — work stakeholders asked for but rejected. Cancelled work reveals ambiguous metrics earlier than success stories. Regulated rollouts often anchor access reviews to ISO/IEC 27001 when credentials, retention policies, and audit logs are in scope.
Frequently Asked Questions
How does this approach help teams make faster decisions?
It standardizes multi-source analysis into one repeatable flow. Instead of rebuilding logic every cycle, teams reuse validated assumptions, which shortens the path from question to decision-ready output on a SaaS data platform.
What data sources should be connected first?
Start with the three systems that most directly affect your core KPI: a system of record, a behavioral source, and a financial outcome source. That gives enough context to connect activity with business impact before expanding scope.
Can this approach meet strict governance requirements?
Yes. Mature implementations use source-level permissions, auditable execution timelines, and reviewer checkpoints. That combination supports speed while keeping compliance and stakeholder trust intact.
What makes InfiniSynapse a fit for recurring multi-source workflows?
InfiniSynapse is designed for recurring analysis loops where teams need memory, process traceability, and cross-source orchestration (Vendor Perspective, commercial). Those capabilities reduce repetitive analyst labor and make week-over-week outputs more consistent.
How long does it take to show ROI?
Most teams see early ROI in 30 days when they focus on one recurring workflow and track cycle time, rework, and decision confidence. Value compounds when operators standardize weekly review, connector hygiene, and reusable memory — not one-off demos.
Which SaaS metrics should an AI agent own first?
Start with the recurring revenue and retention metrics leaders review weekly: net revenue retention by cohort, activation-to-paid conversion, expansion versus contraction MRR, and churn drivers by segment. These pull from billing, product telemetry, and CRM at once, so a governed SaaS data platform with reusable memory keeps definitions stable across every monthly board pack.
Conclusion
Trust lands when stakeholders can trace every assumption back to a source row. Teams that connect source truth, workflow traceability, and reusable memory can scale analytical output without sacrificing control.
For organizations with repeated multi-source questions, see the labeled Vendor Perspective for how InfiniSynapse maps onto this pattern: plan, execute, validate, explain, and reuse. That is the difference between occasional insight and reliable decision velocity on a SaaS data platform.