Marketing Data Analysis in 2026: The Working Playbook
- Marketing data analysis in 2026 means analyzing data across four source classes: ad platforms, web/product analytics (mostly GA4), the CRM, and the warehouse.
- Eight questions take up most of an analyst's week — CAC by channel, blended payback, retention by cohort, attribution audit, creative performance, funnel diagnostics, LTV by segment, and channel mix vs forecast.
- Attribution choice (last-touch, data-driven, MMM, incrementality) is a policy decision, not a tool choice — pick one primary model and run the others as sanity checks.
- The tool ladder runs from spreadsheets to GA4 BigQuery export to a warehouse plus dbt plus BI, with AI data agents now layering on top for ad-hoc questions.
- AI data agents shine on the open-ended "why did CAC spike in week 14?" question that does not fit a dashboard — connect the warehouse, bind a small knowledge base of business definitions, and ask in plain English.
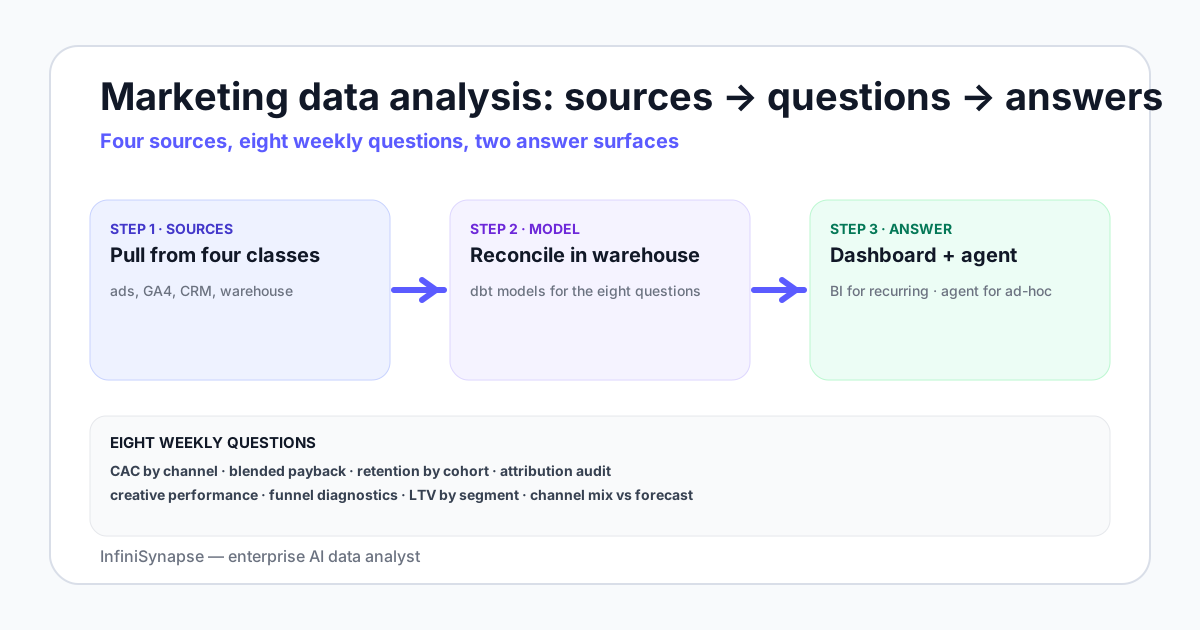
The four source classes every marketing stack pulls from
Four classes of source feed marketing analysis — covering them sets the ceiling for what an analyst can answer:
- Ad platforms. Google Ads, Meta Ads, LinkedIn, TikTok, programmatic. Costs, impressions, clicks, conversions reported by the platform. Pulled via the platform API or an ELT vendor like Fivetran or Airbyte.
- Web and product analytics. Predominantly Google Analytics 4, with some teams running Mixpanel, Amplitude, or PostHog. Sessions, events, conversions, and channel groupings.
- CRM. HubSpot, Salesforce, or a B2C CRM. Lead and opportunity data, deal stage transitions, customer lifecycle attributes.
- Warehouse. Snowflake, BigQuery, Redshift, or a Postgres data warehouse. The reconciled view — every other source lands here through ELT and is modeled with dbt or a transformation layer.
The warehouse is the analytical ground truth. Spreadsheets and platform UIs are points of friction the team graduates from once cross-source questions become weekly.
A later desk pass on a paid-social-plus-web-plus-CRM stack showed the same join failure in definitions, not just connectors. Attribution debates burned two days until a shared cohort definition sat in a source-of-truth doc the Monday run could reference. Creative performance only became usable after ad metadata joined to opportunity stage, not CTR — one campaign looked efficient until the pipeline join, then spend moved within 48 hours instead of the monthly review. UTM gaps, promo codes, and mislabeled regions were logged as corrections and folded back into reusable attribution logic. Treat these notes as illustrative desk composites, not a campaign SLA.
The eight weekly questions analysts actually answer
| Question | What it measures | Where the data sits |
|---|---|---|
| CAC by channel | Spend / new customers, weekly, by channel | Ad platforms + warehouse customer table |
| Blended payback | Days to recover CAC from gross margin | Warehouse — orders, COGS, customers |
| Retention by cohort | % of cohort still active at week N | Warehouse — events or orders |
| Attribution audit | Same conversions, three models — sanity gap | GA4 BigQuery export + warehouse |
| Creative performance | Top creatives by ROAS, normalized by spend | Ad platforms + warehouse |
| Funnel diagnostics | Step-by-step drop-off, segmented | GA4 / product analytics |
| LTV by segment | 90 / 180 / 365 day LTV by acquisition channel | Warehouse — orders, customers, channel |
| Channel mix vs forecast | Actual vs planned spend share, by channel | Spreadsheet plan + ad platforms |
Eight questions cover the working week of most marketing analysts. The remaining time goes to ad-hoc exploration — "why did paid social CPM jump on Tuesday?" — which is exactly where AI database query agents earn their seat. Storefront teams that need RFM, month-1 repurchase, and a warehouse join should continue in the ecommerce analytics playbook rather than stretching these eight marketing questions to cover AOV and checkout drop-off.
Attribution choices in 2026 — pick one, run others as sanity checks
Attribution is a policy decision the team owns, not a tool default. Four credible models in 2026, none of which is the universal answer:
- Last-touch. Simple, biased, but auditable. Still useful as a fallback comparison.
- Data-driven (DDA). GA4 default, machine-learned attribution. Convenient inside GA4, opaque outside it.
- Marketing Mix Modeling (MMM). Top-down regression across spend and outcome time series. Best when privacy changes have eroded tracking. Slower iteration; quarterly cadence.
- Incrementality testing. Holdout-based geo or audience tests. Most credible but operationally expensive.
The working policy: pick one model as the primary number you report and budget on, run a second as a monthly sanity check, and run an incrementality test on each major channel at least once a quarter. The analyst literature and platform documentation both back this pattern; the only argument is which one is primary. Paid-media source maps, the CPM-to-ROAS tree, and a labeled ROAS-decline diagnosis sit in advertising analytics below — do not treat platform-attributed return as the incrementality number.
Advertising analytics: paid-media source map and metric tree
Advertising analytics is the paid-media slice of marketing data analysis: reconcile delivery and cost, join conversions at a safe grain, then pick the next campaign or budget action. It is not competitive ad intelligence. Attributed ROAS is not incremental return. The eight weekly questions stay above; this section is the source map and metric tree for ads.
Write a small data contract before the join — owner, grain, identifiers, time zone, currency, latency, and which system is authoritative for each fact. An ad platform is usually the operational source for delivered spend and impressions; a governed order or billing system is stronger for recognized revenue and refunds.
| Source | Use it for | Required controls | Common mismatch |
|---|---|---|---|
| Ad platforms | Spend, delivery, auction, placement, creative, platform-attributed actions | Account and campaign IDs, currency, time zone, attribution setting, export timestamp | Platform totals use different windows or modeled conversions |
| Web or app analytics | Sessions, events, landing behavior, source and campaign dimensions | UTM policy, click-ID handling, consent state, event versions | Identity loss, self-referrals, overwritten campaign parameters |
| CRM or lead system | Qualified leads, stages, owners, opportunities, delayed outcomes | Stable lead and campaign keys, stage history, duplicate and reopen rules | Latest state replaces history; offline source is missing |
| Orders, billing, or finance | Recognized revenue, margin, refunds, taxes, cancellations | Order and customer keys, accounting date, currency conversion, refund policy | Gross sales compared with net revenue or mixed periods |
A campaign-day table cannot join directly to an order-line table without aggregation or a documented bridge. Keep unmatched and duplicate counts. Prefer aggregate analysis when user-level identity is not required for the decision.
| Question | Useful measures | Calculation | Interpretation warning |
|---|---|---|---|
| Did delivery occur efficiently? | Reach, frequency, CPM, viewability, impression share | CPM = spend ÷ impressions × 1,000 | Cheap impressions may be low quality or outside the eligible audience |
| Did people respond? | CTR, CPC, landing-page engagement, qualified visit rate | CTR = clicks ÷ impressions; CPC = spend ÷ clicks | A click can reflect curiosity, accidental action, or poor expectation setting |
| Did the desired action occur? | CVR, CPA, qualified lead rate, cost per qualified lead | CVR = conversions ÷ eligible visits; CPA = spend ÷ conversions | Conversion definitions, duplication, and windows must match |
| Did the economics work? | New-customer CAC, ROAS, contribution return, payback | ROAS = attributed revenue ÷ ad spend | Attributed revenue is not automatically incremental revenue or profit |
Trace changes along spend → impressions → clicks → eligible visits → conversions → qualified outcomes → revenue or margin before naming a cause. Use attribution for operational credit. Use a lift test or another credible causal design when incrementality is the decision — see multi-touch attribution and incrementality testing for the method pages.
- Define the decision, eligible campaigns, guardrails, and what result triggers pause, repair, test, scale, or no change.
- Freeze time zone, currency, conversion definition, maturity window, and comparison period.
- Save versioned platform, analytics, CRM, and finance exports with timestamps and filters.
- Reconcile spend, impressions, and clicks by account and day before joining.
- Build the metric tree at the approved campaign-day or campaign-cohort grain.
- Diagnose from the largest absolute contribution; segment one dimension at a time.
- Record the action, owner, change size, and how impact will be verified.
Illustrative diagnosis, not a benchmark. A team sees attributed ROAS fall from 4.0 to 3.1 across two four-week windows while spend rises from $100,000 to $120,000 and attributed revenue falls from $400,000 to $372,000. After currency and tax treatment, platform spend matches finance. CPM is up 12%, CTR is flat, landing-page CVR is down 18%, and AOV is stable — most of the absolute revenue loss sits on two mobile landing pages that shipped mid-period. The defensible move is to repair those pages, hold unaffected campaigns, and restore spend under CPA and margin guardrails. A blanket budget cut would treat every channel as equally responsible and hide the page failure. Do not call the observed ROAS gap incremental lift.
The tool ladder — spreadsheets to warehouse to AI agent
| Rung | Stack | When you stay there | When you graduate |
|---|---|---|---|
| 1 | Spreadsheet + platform UI | Solo founder, two channels | Three+ channels or a real product analytics tool |
| 2 | BigQuery + GA4 export + a notebook | One analyst, GA4 questions dominate | The CRM and warehouse have to talk |
| 3 | Snowflake/BigQuery + Fivetran + dbt + BI | Team of 3–8, cross-source weekly | Ad-hoc questions outpace the dashboard backlog |
| 4 | Stack 3 + an AI data agent | Open-ended questions you cannot pre-model | You are already here — read the AI database query pillar for the connection setup pattern |
Each rung adds a tool only when the rung below it has run out of headroom. Skipping rungs is the most common over-engineering mistake.
Where an AI data agent earns the seat in a marketing stack
The dashboard answers the questions you already knew to ask. An AI data agent answers the question you did not know to ask until you saw the dashboard drift. Three concrete patterns:
1. Mid-week anomaly investigation
CAC on paid social spiked 22% on Tuesday. The dashboard shows the spike but not the cause. An AI data analyst with the warehouse connected and a marketing knowledge base bound can break it down by campaign, creative, audience, and landing page in one prompt — minutes instead of a half-day query session.
2. Cross-source attribution audit
The number GA4 reports and the number the warehouse reports disagree by 8%. The agent can quantify the gap, identify the join key where the mismatch lives, and surface the rows that fall on only one side. The output is an evidence trail — plan, SQL, results — the analyst can defend.
3. New-question onboarding for non-analyst marketers
A growth marketer wants to ask "which creatives drove the highest LTV cohort, not just the highest ROAS?" Without an agent, that becomes a BI ticket. With an agent and a bound knowledge base, it becomes a conversation that ends with a chart.
The pattern is not "replace the dashboard" — the pattern is "let the dashboard answer the recurring 80% and let the agent answer the ad-hoc 20% where dashboards cannot be pre-built". See agentic analytics explained for the deeper category framing.
A 30-day start for one weekly question
Do not stand up the full ladder in month one. Pick one of the eight questions, freeze its definitions, and refuse to expand until that run survives a schema change.
| Week | Focus | Done when |
|---|---|---|
| 1 | Baseline + scope | One question, named owner, source boundary written down |
| 2 | Build + validate | First join across ads, web/product, and CRM or warehouse matches the owner's number |
| 3 | Operationalize | Recurring output format and a reviewer checkpoint exist |
| 4 | Reuse | Assumptions and transformations sit in a reusable memory or metric contract |
What a working marketing analysis dashboard contains
A dashboard is the standing answer to questions the team already knows to ask. A working marketing dashboard has six standing panels:
- Spend and CAC by channel, week-over-week, with a 4-week trailing average overlay.
- New customer counts, segmented by acquisition channel, with a forecast line.
- Retention curves by acquisition cohort, 4-week trailing.
- Creative leaderboard, ranked by ROAS within the last 14 days, with a minimum spend filter.
- Funnel diagnostics, top to bottom, with channel and device splits.
- Channel mix vs plan, current week, as a stacked bar.
The dashboard ends there. Questions outside these six belong in an analyst session or an AI agent prompt, not in a permanent panel.
Ask an open-ended marketing question across your warehouse
Connect Snowflake, BigQuery, or Postgres read-only. Bind a small knowledge base of business definitions — what "active customer" means, which status equals a paid conversion. Then ask one question the dashboard does not answer.
Try InfiniSynapse onlineFAQ
Methodology and review notes
Last updated: 2026-09-17 · Next scheduled review: 2026-12-17
This playbook synthesizes Google Analytics 4 official documentation, ad platform reporting reference docs, the dbt analytics engineering guide, marketing mix modeling literature, and field experience across marketing teams that operate on Snowflake, BigQuery, and Postgres warehouses. The eight-question pattern and tool ladder reflect observed practice across more than a dozen teams rather than vendor marketing.
Conflict of interest: InfiniSynapse publishes this guide and sells an enterprise AI data analyst. To reduce bias, the page leads with the topic itself, treats InfiniSynapse as one option among many, and links to external sources for every numeric claim.
Update cadence: Reviewed every 90 days for accuracy and link health.
Sources and references
- [Vendor] Google. Google Analytics 4 documentation. support.google.com/analytics.
- [Vendor] Google. GA4 BigQuery export schema. support.google.com/analytics/answer/7029846.
- [Vendor] dbt Labs. Analytics engineering guide. docs.getdbt.com.
- [Vendor] Meta. Marketing API reference. developers.facebook.com/docs/marketing-apis.
- [Independent] Yao et al. ReAct: Synergizing Reasoning and Acting in Language Models. arxiv.org/abs/2210.03629.
- [Vendor] Anthropic. Building Effective Agents. anthropic.com/research/building-effective-agents.
- [Standard] NIST. AI Risk Management Framework. nist.gov/itl/ai-risk-management-framework.
- [Independent] BIRD-SQL benchmark. bird-bench.github.io.
- [Vendor] Google. Advertising and attribution reports in Analytics. support.google.com/analytics/answer/10607798.
- [Standard] IAB UK. Measuring Digital Advertising toolkit. iabuk.com Measuring Digital Advertising toolkit (PDF).
- [Regulator] UK ICO. Cookies and similar technologies. ico.org.uk PECR cookies guidance.