Data Quality: What It Is and How to Improve It in 2026
By the InfiniSynapse Data Team · Last updated: 2026-07-15 · We build an AI-native data analysis platform and see daily how data quality decides whether analysis can be trusted; this guide reflects what actually improves quality in 2026, not a checklist.
Table of Contents
- TL;DR
- How We Approached This
- What It Is
- The Core Dimensions
- How to Measure It
- How to Improve It
- Common Problems
- Quality in the Age of AI
- Quality Scorecard
- Common Misconceptions
- Frequently Asked Questions
- Conclusion
TL;DR
Direct answer: data quality is the degree to which data is accurate, complete, consistent, timely, and valid for its intended use. In 2026, data quality is the single biggest determinant of whether AI-driven analysis produces trustworthy answers, because an agent reading flawed data returns confident but wrong conclusions.
Who this is for: analysts, engineers, and data leaders who need to define, measure, and improve data quality in 2026.
What you'll learn: what quality means, the dimensions that define it, how to measure and improve it, the problems that recur, and why it is the foundation of trustworthy AI.
This guide sits under the data governance frameworks hub.
For the operational discipline, see data quality management.
Also see data quality tools.
How We Approached This
Implementation details are commonly grounded in Apache Kafka documentation when teams translate concepts into production practice.
We built this guide from remediation work rather than theory. Every recommendation reflects what we see when teams try to raise data quality and then feed the result into analytics and AI. We anchor definitions to the Shopify ecommerce analytics, which frames accuracy, completeness, and timeliness precisely, and we align control expectations with the Databricks documentation, which treats data quality as a first-class risk factor for any AI system.
The table below maps the dimensions of data quality. Use it as a reference; the sections below go deeper.
| Dimension | Question it answers | Typical metric |
|---|---|---|
| Accuracy | Is the value correct? | Error rate vs source |
| Completeness | Is anything missing? | Null / missing rate |
| Consistency | Does it agree across systems? | Mismatch rate |
| Timeliness | Is it fresh enough? | Data latency |
| Validity | Does it obey the rules? | Rule-violation rate |
| Uniqueness | Are there duplicates? | Duplicate rate |
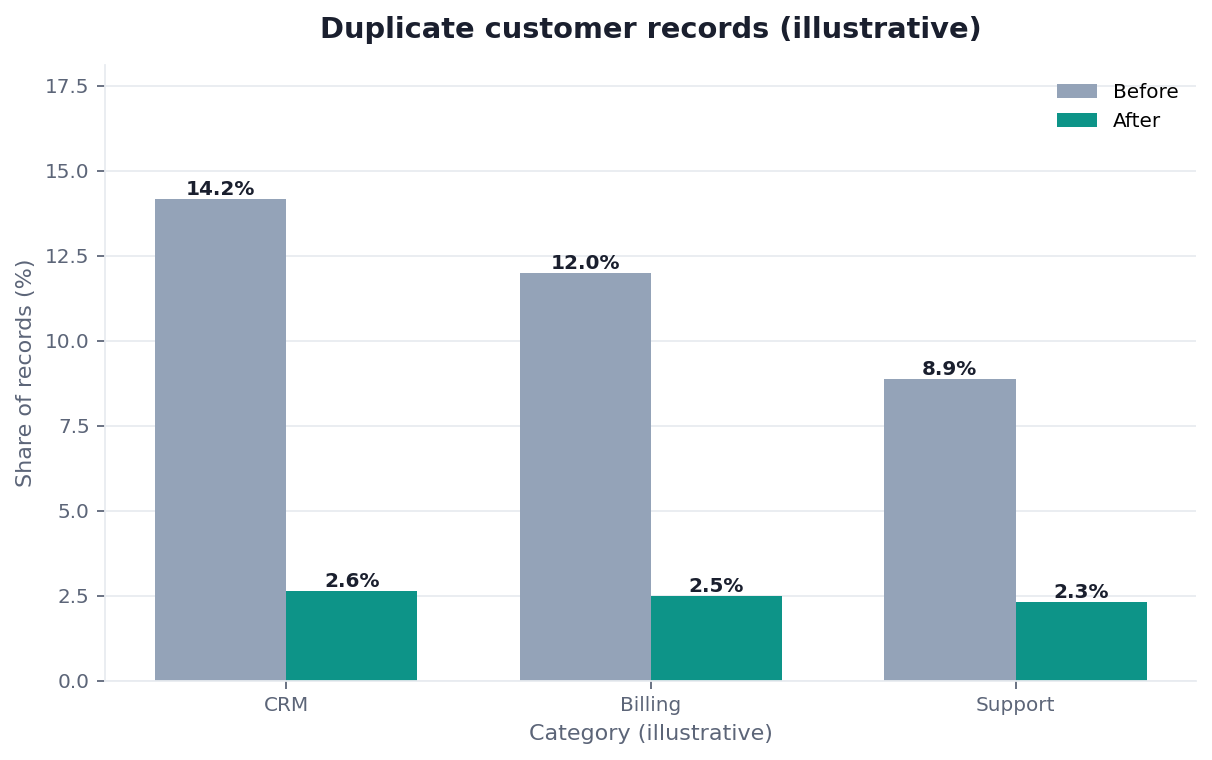
Practical example: a marketplace with poor data quality had 12% duplicate customer records, so lifetime-value analysis overstated churn and marketing overspent. After adding deduplication and validity checks aligned with RFC 4180 CSV format, the numbers stabilized and the budget followed. That measurable correction is what improving data quality delivers.
Scope note: This guide reflects patterns we see when mid-market and enterprise teams work with data quality in 2026. It is not a substitute for legal counsel, vendor runbooks, or a formal survey of every industry — and when a smaller toolset or lighter process would serve, a full program is overkill.
What It Is
Implementation details are commonly grounded in Stripe documentation when teams translate concepts into production practice.
At its core, data quality is fitness for use: data is high quality when it is accurate enough, complete enough, and fresh enough for the decisions it supports. Quality is relative to purpose, not an absolute.
Key Definition: data quality is the degree to which a dataset is accurate, complete, consistent, timely, valid, and unique enough to serve its intended purpose, measured against defined standards rather than assumed.
The distinction that matters is between perceived and measured quality. Teams often assume their data is fine until a decision goes wrong; measured data quality replaces assumption with evidence by attaching a metric to each dimension. That shift — from "the data looks okay" to "the null rate is 2% and falling" — is what makes quality manageable rather than a matter of opinion.
The Core Dimensions
Teams evaluating this topic often cross-check OWASP Top 10 for LLM Applications for a durable, vendor-neutral reference point.
Effective work on data quality rests on measurable dimensions rather than vibes, and each dimension gets its own metric.
Accuracy and completeness
Accuracy asks whether a value matches reality; completeness asks whether required values are present. These catch most everyday problems — wrong amounts, missing customers, blank fields — and they are the easiest data quality checks to automate against a trusted source or expected population. We recommend starting here because the failures are concrete and the fixes are visible.
Consistency and uniqueness
Consistency asks whether the same fact agrees across systems; uniqueness asks whether records are duplicated. Cross-system disagreement is the most expensive data quality failure because two reports citing different numbers erode trust in both. Standards bodies formalize these expectations; aligning definitions with ENISA AI cybersecurity framework controls keeps consistency rules defensible and auditable.
How to Measure It
Core definitions remain usefully summarized in Wikipedia business intelligence overview for shared vocabulary across stakeholders.
Measuring data quality means turning each dimension into an automated check with a threshold. Null rate, duplicate rate, cross-system mismatch, and freshness are the four we recommend first, because they cover the failures that most often reach dashboards.
The pattern that works is to run these checks on a schedule and route failures as clear alerts to an owner. Modern data platforms make this straightforward; the built-in expectations and monitoring in tools documented at Supabase documentation show how quality checks can run inside the pipeline rather than as an afterthought. What matters is not the specific tool but that data quality is measured continuously rather than audited occasionally.
How to Improve It
Core definitions remain usefully summarized in Wikipedia data warehouse overview for shared vocabulary across stakeholders.
Improving data quality is less about heroic cleanups and more about closing the loop between detection and root cause. When a check fails, the durable fix addresses why the bad data appeared — a broken integration, an ambiguous definition, a missing validation — not just the symptom.
This connects data quality directly to the operational discipline in data quality management, which turns one-off fixes into a standing program with owners and thresholds. The teams that improve fastest treat each incident as a chance to prevent a class of problems, not just to patch one record, and they record the fix so the same regression cannot silently return.
Prioritization is what keeps improvement realistic. You will never fix every quality issue at once, so the question is which issues to address first, and the honest answer is the ones attached to the most important decisions. A missing field in a table nobody queries can wait; a duplicate in the customer table that feeds every revenue report cannot. Ranking issues by the value of the decisions they threaten, rather than by how easy they are to fix, is what separates programs that raise trust from programs that stay busy. We recommend maintaining a short, visible backlog of quality issues ordered by decision impact, so that the next fix is always the one that matters most and progress is legible to the leaders funding the work.
Common Problems
The problems we see most are predictable. Duplicates inflate counts and distort per-customer metrics. Inconsistent definitions across teams make the same word mean different things. Silent schema changes break downstream logic without warning. And stale data — technically present but out of date — quietly misleads decisions that assume freshness.
A subtler problem is measuring data quality in isolation from use. A dataset can be technically pristine and still useless if it does not answer the questions the business asks, so the best programs tie every check to a decision it protects rather than chasing abstract cleanliness.
The Cost of Poor Quality
It helps to make the cost of poor quality concrete, because governance budgets are won and lost on numbers rather than principles. Poor data has three cost centers. The first is rework: analysts spend a large share of their time reconciling and cleaning data before they can analyze it, time that produces no insight and simply undoes earlier mistakes. The second is bad decisions: when a report is wrong, the decision it drives is wrong too, and those errors compound as they flow into forecasts, budgets, and commitments. The third is erosion of trust: once a leader catches one dashboard being wrong, they discount all of them, and the organization quietly reverts to gut feel even where good data exists.
Quantifying these costs is what turns a quality program from a nice-to-have into a funded priority. We encourage teams to estimate, even roughly, how many analyst-hours go to cleanup each month, how many decisions were revisited because of a data error, and how many dashboards leaders actually trust. These numbers are usually sobering, and they make the return on a modest quality investment obvious. A program that eliminates a recurring reconciliation, for example, pays for itself in reclaimed analyst time within a quarter, and the trust it rebuilds is worth far more than the hours saved. Framing quality as cost avoidance, rather than as an abstract virtue, is consistently how the strongest teams secure the mandate and budget to sustain it over time.
Quality in the Age of AI
The 2026 development that raises the stakes is AI-driven analysis. When an autonomous agent reads your data and produces answers, data quality problems no longer sit quietly in a warehouse — they become confidently wrong conclusions delivered to decision-makers. This makes quality a prerequisite for trustworthy AI rather than a back-office concern.
An AI-native platform helps by binding governed definitions to sources so the agent honors the same quality expectations a program encodes, an approach we describe in what AI-native data analysis means. In the InfiniSynapse web app, governed definitions travel with the data an agent queries, so strong data quality directly improves the reliability of automated analysis instead of being bypassed by it.
Quality Scorecard
Assess your data quality maturity (1 point each):
| Check | Pass? |
|---|---|
| We measure accuracy against a source | |
| We track completeness / null rate | |
| We check cross-system consistency | |
| We detect duplicates | |
| We monitor freshness | |
| Checks run automatically | |
| Failures route to an owner | |
| Quality is good enough for AI |
6–8: strong. 3–5: automate your top four checks. Below 3: start with null and duplicate rates.
Common Misconceptions
Misconception 1: Quality means perfection. Data quality is fitness for use, not flawlessness.
Misconception 2: You can clean once. Quality drifts; it must be monitored continuously.
Misconception 3: Tools guarantee quality. Tools measure; owners and definitions fix.
Misconception 4: Clean data is the goal. Data that answers the business question is the goal.
Frequently Asked Questions
What is data quality?
Data quality is the degree to which data is accurate, complete, consistent, timely, valid, and unique enough to serve its intended purpose. It is fitness for use measured against defined standards rather than assumed — attaching a metric to each dimension so quality becomes evidence ("null rate is 2%") rather than opinion ("the data looks fine").
What are the main dimensions?
The core dimensions are accuracy, completeness, consistency, timeliness, validity, and uniqueness. Accuracy asks whether values are correct, completeness whether anything is missing, consistency whether facts agree across systems, timeliness whether data is fresh, validity whether values obey rules, and uniqueness whether records are duplicated. Each gets its own automated metric.
How do you measure it?
Turn each dimension into an automated check with a threshold and run it on a schedule. Start with null rate, duplicate rate, cross-system mismatch, and freshness, because they cover the failures that most often reach dashboards. Route failures as clear alerts to an accountable owner, and measure continuously rather than auditing occasionally.
How do you improve it?
Close the loop between detection and root cause. When a check fails, fix why the bad data appeared — a broken integration, an ambiguous definition, a missing validation — not just the symptom. Record the fix so the regression cannot silently return, and treat each incident as a chance to prevent a whole class of problems rather than patch one record.
Why does data quality matter for AI?
Because AI amplifies bad data. When an agent reads your data and produces answers, quality problems become confidently wrong conclusions delivered to decision-makers. Measurable quality expectations become guardrails the agent respects, so strong quality is a prerequisite for trustworthy automated analysis rather than an optional refinement.
Conclusion
Data quality is fitness for use — accurate, complete, consistent, timely, valid, and unique enough for the decision at hand — and in 2026 it is the foundation of trustworthy AI. Measure the dimensions that matter, fix root causes, and monitor continuously.
To see how governed quality expectations travel with data into automated analysis, read what AI-native data analysis means and try the InfiniSynapse web app free on registration.