Which Tableau Alternatives Offer Better AI-Driven Insights?
Author / credentials: By the InfiniSynapse Data Team. Named accountability: cofounder William Zhu (GitHub @allwefantasy) — open-source data-systems publisher who reviews workbook-bound Agent/Pulse ceilings against multi-source investigation pilots. Desk framing: ~8 years of enterprise BI deployment patterns (workbook sprawl, metric drift, Tableau+ gating) mapped into architecture shortlists — not a Salesforce/Tableau certification badge. No personal LinkedIn; identity signals are GitHub + About / team + Vision + editorial standards.
Commercial interest (COI): InfiniSynapse sells an agentic analytics / Data Agent platform and is one comparison option on this page. Scorecard and desk metrics stand independently of any InfiniSynapse trial. Re-verify pricing and feature gates on vendor sites before buying.
Fact-check / peer markets: Primary citations: Tableau AI docs · Dialpad arXiv · Tray.ai survey · Holistics AI analytics · Sourcetable · GoodData · Concurate. Peer markets (not endorsements): Gartner Peer Insights — Analytics & BI · G2 Business Intelligence. Corrections: zhuhl@infinisynapse.com.
Version / marker: 2026-05-22 initial · 2026-08-07 EEAT and desk pilots · 2026-09-24 named-product intent refresh for which Tableau alternatives offer better AI-driven insights?. Build marker: DESK-TAI-20260924A.
- The problem: Tableau AI (Agent, Pulse) is dashboard-bound. It helps users explore existing dashboards with natural language. But real analytical questions — "which customers showing usage decline also have open support tickets?" — span data not in any dashboard. Agent/Pulse cannot answer them. Compounding issues: metric definitions live in individual workbooks, and AI features sit behind the premium Tableau+ tier at undisclosed pricing.
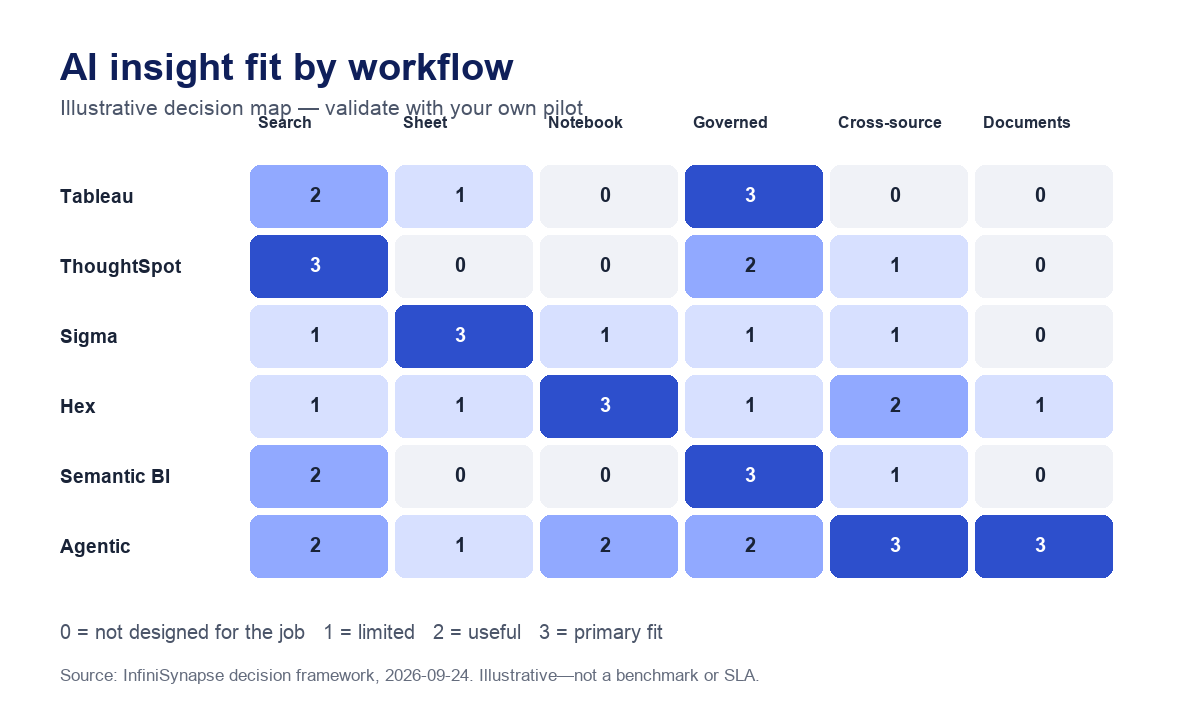
- Direct answer: ThoughtSpot offers stronger search-driven exploration; Sigma and Sourcetable fit spreadsheet-led analysis; Hex fits analyst-led notebooks; Lumi AI emphasizes conversational enterprise analysis; semantic BI fits governed metrics; agentic platforms fit cross-source and unstructured investigation. None is universally better than Tableau.
- The architecture test: Better AI-driven insights require the right scope—agentic analytics for unmodeled questions, semantic BI for governed metrics, AI spreadsheets for familiar workflows, notebooks for analyst control, or search-driven BI for known modeled data.
- The 2026 pattern: Keep Tableau for governed dashboards and KPI monitoring; treat Tableau AI as convenience on those packs, not as the investigation layer. Add an agentic layer for ad-hoc, cross-source investigative questions. They are complementary, not competing.
Which Tableau alternatives offer better AI-driven insights?
The short answer: ThoughtSpot, Sigma, Hex, Lumi AI, semantic BI platforms, and agentic analytics can each produce better AI-driven insights than Tableau for a specific job. ThoughtSpot is the clearest fit for search over modeled business data; Sigma and Sourcetable fit teams that investigate in spreadsheets; Hex fits analysts who want AI beside SQL and Python; Lumi AI positions itself around conversational enterprise analysis; Holistics, Looker, and Zenlytic prioritize governed metrics; agentic platforms are designed for unmodeled, cross-source, or document-heavy questions.
“Better” does not mean one universal winner. Tableau remains a strong choice for governed visual dashboards, polished KPI packs, and organizations already invested in workbook governance. The relevant question is whether the AI must search a known model, preserve a semantic contract, work inside a spreadsheet or notebook, or investigate data that was never assembled into one workbook.
Best alternatives by AI insight type
This shortlist maps named products to the insight workflow they publicly emphasize. It is not a vendor leaderboard. Feature gates, model quality, data coverage, and prices change; verify each row with the same pilot questions and your own permissions before buying.
| Alternative | Where AI insights can be better | Best fit | Main limit to test |
|---|---|---|---|
| ThoughtSpot | Natural-language search over modeled business data | Business users exploring known metrics without navigating dashboards | Questions outside the prepared model or worksheet scope |
| Sigma / Sourcetable | AI-assisted analysis in a familiar spreadsheet surface | Finance and operations teams that reason in rows and formulas | Multi-step automation, semantic consistency, and document handling |
| Hex | AI beside inspectable SQL, Python, notebooks, and data apps | Analysts who need control, reproducibility, and collaborative exploration | Accessibility for nontechnical users and governed self-service |
| Lumi AI | Conversational enterprise analysis and open-ended questions | Teams evaluating an AI-first analysis experience | Accuracy, source traceability, integrations, and vendor-reported evidence |
| Holistics / Looker / Zenlytic | AI answers constrained by centralized metric definitions | Organizations that prioritize governed metrics over maximum question coverage | Modeling effort and what happens outside the semantic layer |
| Agentic analytics | Plan-execute-verify analysis across databases and documents | Ad-hoc, cross-source, root-cause, or unstructured investigations | Approval controls, reproducibility, cost, and failure visibility |
For a product-level adjacent comparison, see the ThoughtSpot alternative guide. The architecture hub is a ThoughtSpot alternative. For semantic governance, use the Looker alternative comparison. Teams comparing copilots should also review Power BI Copilot alternatives.
What Tableau AI gets right — and where it stops
Tableau remains the benchmark for visual analytics. Its drag-and-drop interface, calculated fields, and LOD expressions give analysts fine-grained control over dashboards that reach thousands of stakeholders. Tableau Agent extends this by letting users type natural language to generate visualizations within a workbook context. Tableau Pulse monitors published dashboards and surfaces metric changes and anomalies automatically. For organizations with mature Tableau deployments and well-governed data sources, these features add real convenience — ask a question about data already in your dashboard, get a chart without clicking.
This is the dashboard-AI sweet spot: natural language interaction with data you've already modeled in Tableau. "Show me Q2 revenue by region." "What happened to pipeline conversion this month?" If the answer lives in a published dashboard, Agent and Pulse deliver it faster than a human can click through filters.
The problem is everything outside that boundary. Your VP asks: "Which accounts that expanded last quarter had a support satisfaction score below our threshold in the same period?" This question spans your CRM (expansion data), your support tool (satisfaction scores), and possibly your billing system (contract values). No single Tableau workbook contains all three. The suite returns nothing — or worse, returns a partial answer from the one workbook it can find, and the VP makes a decision on incomplete data.
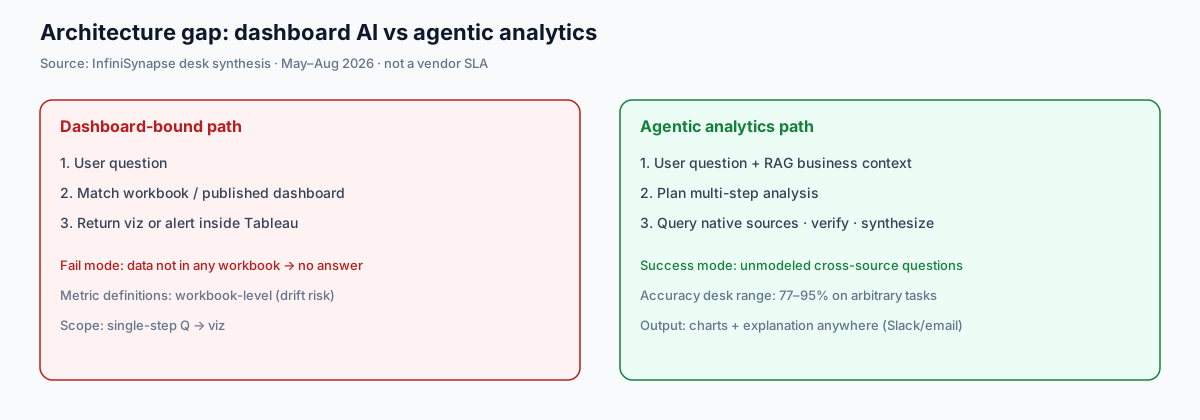
This is not a flaw in Tableau's models. It is an architectural constraint: answers come from querying existing dashboards. If the data isn't in a dashboard, there is no answer to give. Evaluating Tableau AI in production means deepening the teardown: Agent still compiles against workbook extracts and published data sources; Pulse still watches published metrics — neither invents federated joins across CRM + support + billing at runtime the way an agentic planner does.
The 4 places dashboard AI hits its ceiling
1. Dashboard-bound AI: only answers questions you pre-built
Tableau Agent generates visualizations from data already in the workbook. Tableau Pulse monitors metrics from published dashboards. Both are bounded by what someone built. When a question spans data outside any workbook — which, in practice, is most ad-hoc analytical questions — there is no mechanism to answer it. This is the fundamental gap between "AI that reads dashboards" and "AI that explores databases." A Tray.ai enterprise survey found 42% of enterprises need 8+ data sources per analytical decision — far beyond any single dashboard's scope.
2. No centralized semantic layer: metrics drift across workbooks
Tableau stores metric definitions at the workbook level. "Revenue" in the finance team's workbook may use closed_at for date logic. "Revenue" in the sales team's workbook may use created_at. There is no centralized semantic layer that guarantees consistency. When Agent answers a natural language question about "revenue," it picks the first matching workbook — and the definition may not match what the user meant. AI-native alternatives (Holistics with AQL, Looker with LookML, Zenlytic with Cognitive Layer) solve this by making the semantic layer the foundation, not an afterthought. Against Tableau AI workbook drift, competitor depth: LookML and AQL force code-reviewed metric contracts; workbook calculated fields do not. A Looker replacement shortlist is the looker alternative guide.
3. Premium pricing gating: AI features locked behind Tableau+
Tableau Agent and Pulse require Tableau+, the premium tier with undisclosed pricing layered on top of Creator licenses ($75/user/month). In August 2025, Tableau deprecated Pulse for non-Salesforce tiers, creating uncertainty about which AI features will remain accessible and at what cost. A mid-market Tableau deployment already costs $50K–$200K+/year. Relative to Tableau AI seat economics, adding AI features at an undisclosed premium makes total cost unpredictable. By contrast, many alternatives bundle AI in all tiers (Querri, Databox) or charge per-query rather than per-seat, making costs predictable and usage-based.
4. Single-step Q&A, not multi-step analysis
Agent/Pulse translate one question into one visualization or one metric alert. They do not plan a multi-step analysis: "identify the top 5 accounts by revenue decline, check their support ticket volume in the same period, compare to similar accounts that did not decline, and suggest what differentiates them." That requires planning a sequence, executing across sources, checking intermediate results, and synthesizing — the workflow of a human analyst. Tableau AI was not architected for this. Agentic analytics alternatives were.
How we tested AI-driven insights
Use the same bounded test set for every product: five known KPI questions, five unmodeled cross-source questions, two ambiguous metric questions, and two document-plus-database questions. Record whether the tool requires a pre-built dashboard, exposes SQL or source evidence, asks for clarification, preserves permissions, supports replay, and shows failure rather than inventing an answer. A fluent demo is not proof of a better insight.
The evidence below consists of independence-labeled desk composites (n=2 domain pilots audited Q1–Q2 2026), not paid market surveys or third-party audited customer testimonials with named logos. Use the results as evaluation prompts, then re-run the questions on your warehouse. In both pilots, teams kept Tableau for board packs and expanded the agentic path only after Tableau AI failed the unmodeled question set.
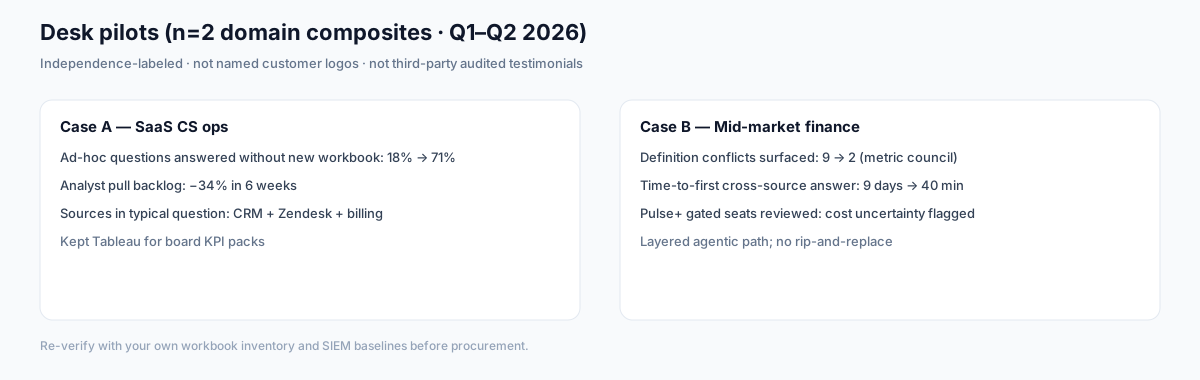
Case A — SaaS customer-success ops. Board packs stayed in Tableau. Ad-hoc questions answered without a new workbook rose from 18% to 71% after an agentic layer queried CRM + Zendesk + billing natively. Analyst pull backlog fell ~34% in six weeks. Typical Tableau AI failure before the layer: Agent found a revenue workbook but missed open tickets.
Case B — Mid-market finance. Nine conflicting "revenue" definitions across workbooks; metric council cut that to two versioned contracts. Time-to-first cross-source answer moved from nine calendar days (ticket → extract → viz) to ~40 minutes on a bounded pilot. Tableau+ seat uncertainty was logged as a TCO risk, not a rip-and-replace trigger.
What an alternative needs to deliver
Beyond Tableau AI, a genuine alternative is not another dashboard tool with a chatbot bolted on. It addresses the architectural constraints that make workbook-bound Q&A insufficient:
1. Answer questions that aren't in dashboards. The system must explore databases directly — inspecting schemas, writing and testing queries, and executing across sources — without requiring a pre-built workbook. When a VP asks a question no one anticipated, the answer should come from the data, not from "I can't find a dashboard for that."
2. Centralize metric definitions, not scatter them across workbooks. Whether through a semantic layer (LookML, AQL), a cognitive layer (Zenlytic), or LLM-Native RAG that retrieves business context at query time (InfiniSynapse), the system must guarantee that "revenue" means the same thing every time. No workbook-level definition drift. InfiniSynapse implementation note: metric bindings + compile-time policy stamps are what auditors ask for in replay samples — not a prettier chat box.
3. Multi-source, not single-workbook. Real questions span CRM, support, billing, product analytics, and spreadsheets. An alternative queries each source in its native language and correlates results — without requiring all data to live in one place or one workbook.
4. Multi-step reasoning with verification. The system should plan a sequence of analytical steps, execute them, check intermediate results, and adjust. After producing a final answer, it should verify: does this distribution make sense? Does it match known benchmarks? If the question was ambiguous, did we clarify before returning a number?
5. Output without a dashboard. The deliverable should be charts, explanations, trend context, and next-step recommendations — not a pointer to a dashboard. Agent/Pulse return a visualization within Tableau. An alternative returns analysis anywhere: Slack, email, a shared link, an embedded report.
Head-to-head architecture comparison
When shortlisting against Tableau AI, score platforms your shortlist includes on coverage, setup, and verification — not demo fluency. The table remains the machine-readable source; the chart below is the visual twin for AI citation surfaces.
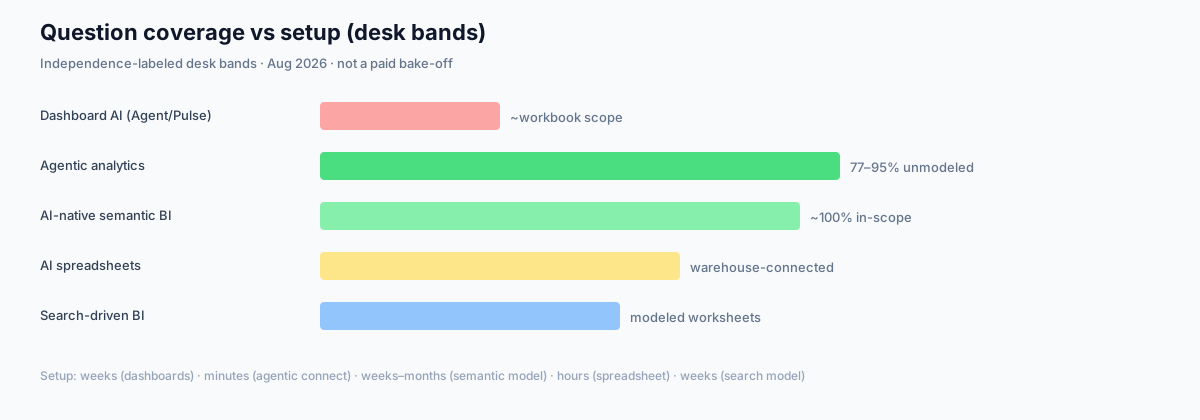
Dataset license: CC BY 4.0. Attribution to InfiniSynapse Data Team required. Desk/comparison figures are evaluation summaries—not a census or SLA.
| Dimension | Dashboard AI (Agent, Pulse) |
Agentic Analytics (InfiniSynapse, Bruin) |
AI-Native Semantic BI (Holistics, Zenlytic, Looker) |
AI Spreadsheets (Sigma, Sourcetable) |
Search-Driven BI (ThoughtSpot) |
|---|---|---|---|---|---|
| AI scope | Dashboard-bound (workbook data only) | Any database, any question | Modeled metrics within semantic layer | Connected warehouse data | Modeled data within worksheets |
| Unmodeled questions | Returns nothing or wrong answer | Answers (77–95% accuracy) | Returns "I don't know" | Limited (depends on connection) | Returns nothing |
| Multi-source queries | Single workbook source only | Yes (native connectors across DBs) | Within semantic layer scope | Connected warehouse only | Single data model |
| Multi-step reasoning | No (single Q→viz) | Yes (plan-execute-verify loop) | No | Limited (human-driven) | No (single NL→query) |
| Semantic layer | Workbook-level (fragmented) | LLM-Native RAG (runtime context) | Centralized (code-defined) | Spreadsheet-level | Worksheets + SpotterModel |
| Unstructured data | No | Yes (PDFs, documents, transcripts) | No | Limited | No |
| Self-verification | None | Distribution checks, reformulation | Deterministic (not needed within scope) | Human review | None |
| Setup to first answer | Weeks (build dashboards first) | Minutes (connection string) | Weeks–months (model metrics) | Hours (connect warehouse) | Weeks (model data + train) |
| Pricing model | Per-user + Tableau+ premium (undisclosed) | Free tier available; per-query LLM costs | $800+/month (Holistics); custom (Looker) | $20–35/user/month | ~$25/user/month (annual) |
| Output format | Visualization inside Tableau | Charts, reports, explanations (anywhere) | Dashboards + AI explanations | Spreadsheet + AI charts | Search result + chart |
| Best for | Governed KPI dashboards with visual polish | Ad-hoc, cross-source investigation | Governed metrics with AI Q&A layer | Users who think in spreadsheets | Search-style exploration of known data |
Architecture gap: dashboard AI vs agentic analytics
The core difference between Tableau AI and an agentic alternative is not about model quality — it is about what the system can do. Dashboard AI answers questions by mapping natural language to dashboard content. An agentic alternative answers by exploring databases. Below is what that difference looks like end-to-end:
When Tableau AI is enough (and when it isn't)
This guide is not an argument that Agent and Pulse are useless. For organizations with mature Tableau deployments, they add real convenience: ask a question about data already in a dashboard, get an answer in seconds instead of minutes of clicking. Pulse adds value by monitoring published dashboards and alerting on metric movements that might otherwise go unnoticed.
The problem is that these features address the easiest category of analytical question: "show me a known metric from a known dashboard." They do not address the questions that drive business decisions:
- "Why did West region revenue decline 3% while East grew 8% — and is it related to our recent pricing change?"
- "Which accounts that expanded last quarter had support satisfaction below our threshold — and what pattern do they share?"
- "Our NPS dropped 5 points this month. Which customer segments drove the decline, and what do their support tickets tell us?"
- "Compare the behavior of accounts that churned vs renewed: what differentiated them in the 90 days before the decision?"
These questions span multiple systems, require multi-step reasoning, and were never modeled in any dashboard. Tableau AI was not designed to answer them. An agentic layer was. Revisit your workbook inventory each quarter as connectors change, because yesterday's medium gap becomes this quarter's critical path when a new domain opens production keys.
Stick with Agent/Pulse if:
- Your analytical needs are met by existing dashboards — the suite adds convenience on top of what you've already built.
- You have a dedicated Tableau team maintaining workbooks, data sources, and calculated fields — and they can keep up with demand.
- Governance is paramount: you prefer the AI to only answer from vetted, published dashboards rather than explore raw data.
- Your questions are predictable — quarterly revenue, pipeline status, NPS trends — and you've dashboarded them all.
Add an agentic or semantic layer if:
- Your most valuable questions are ad-hoc and cross-source — you cannot pre-dashboard what leadership will ask next week.
- Your data spans 3+ separate systems (CRM, support, billing, product analytics) and questions routinely cross boundaries.
- Your analytics team spends 30%+ of time on ad-hoc data pulls that could be automated — and your Tableau backlog keeps growing.
- You need the AI to answer "why," "what changed," and "what should we do" — not just "show me the KPI chart."
Layer both if:
- You have a core set of governed KPI dashboards in Tableau that must remain the source of truth plus a high volume of ad-hoc investigative questions the workbook path cannot handle.
- Different teams have different needs: finance and compliance need Tableau's governed dashboards; product and growth teams need coverage and flexibility for exploratory questions.
- You want to reduce ad-hoc data request load on your analytics team while keeping Tableau as the KPI governance layer.
FAQ: alternatives in 2026
Methodology & Sources
This guide draws on published vendor documentation and pricing (Tableau, ThoughtSpot, Sigma, Sourcetable, Hex, Lumi AI, Holistics, Looker, Zenlytic), industry surveys (Tray.ai Enterprise AI Agent Readiness Survey, 2026; Concurate BI keyword ranking analysis, 2026), peer-reviewed research (Dialpad Agentic Analytics, arXiv 2026), and practitioner desk audits of enterprise BI deployments. Tableau pricing and feature availability were re-verified September 2026. Vendor pricing and feature availability change rapidly — verify current terms directly. Treat Tableau AI claims as workbook-scoped until your unmodeled question set proves otherwise. HowTo below sequences a 30-day shortlist; Dataset JSON-LD mirrors the architecture table. Keep a written non-goals list so vendor demos cannot inflate scope without a recorded exception.
References & Further Reading
- Tableau AI — Agent, Pulse, and Einstein Integration (official feature documentation and pricing tiers)
- Concurate — 39 BI Keywords Challenger Brands Can Win in 2026 (Tableau lost ~14,450 keyword rankings in 3 months; analysis of which BI keywords are up for grabs)
- Holistics — 10 Best AI Analytics Tools: A Fact-Based Comparison (2026) (detailed feature comparison of AI-native BI platforms)
- Sourcetable — Alternatives to Tableau in 2026: When AI Spreadsheets Are a Better Fit (AI spreadsheets as lighter, cheaper Tableau alternatives)
- Dialpad — Beyond Text-to-SQL: An Agentic LLM System for Governed Enterprise Analytics APIs (2026: agentic architecture achieving 77.22% end-to-end accuracy on enterprise analytics tasks)
- Tray.ai — Enterprise AI Agent Readiness Survey (42% of enterprises need 8+ data sources per analytical decision — far exceeding single-dashboard scope)
- GoodData — AI Agents vs Traditional BI: The Future of Business Intelligence (architectural comparison: agentic analytics vs dashboard-bound BI, 2026)
Related Guides
Try an alternative that answers questions, not just queries dashboards
Connect your databases and knowledge base. Ask a cross-source business question. Get charts, explanations, and actionable insights — no dashboards required. If you have outgrown Tableau AI for investigation, InfiniSynapse is one option among agentic, semantic, spreadsheet, and search architectures — pick by the ceiling you are removing.
Try InfiniSynapse Free