What Does a Data Analyst Do? Tasks and a Real Day
By William Zhu & the InfiniSynapse Data Team · Published: 2026-07-09 · Last updated: 2026-09-26 · Last verified: 2026-09-26 · About: Editorial standards · About / team
Author credentials: William Zhu is cofounder of InfiniSynapse (GitHub @allwefantasy). Desk experience: day-in-the-life workflows with customer/partner analyst teams—not licensed career counseling. No personal LinkedIn; GitHub + About are identity signals.
COI: InfiniSynapse sells an AI-native Data Agent platform. Product CTAs only in Product recommendation (commercial). Career guidance stands independently of any trial.
Fact-check: Time shares are InfiniSynapse 2025–2026 Day-in-Life Desk Composite (n=10)—not a BLS microdata extract. Primaries: BLS data analysts OOH · LinkedIn Future of Recruiting 2025 · HBR skills-based hiring · Stanford HAI AI Index. Peer markets: Gartner Peer Insights · G2 Analytics. Corrections: zhuhl@infinisynapse.com · editorial corrections.
Version history: 2026-07-09 initial · 2026-08-06 EEAT / HowTo / DefinedTermSet / dens destuff · 2026-09-26 company questions, week table, analysis types, tool table, pay bridge. Marker:
DESK-WDA-20260926A. Media note: No VideoObject; use HowTo SVG + time-share figure.
 Four recurring tasks—gather, clean, analyze, communicate—define the analyst workday more honestly than a skills laundry list.
Table of Contents
- TL;DR
- Key Terms
- How We Evaluated This Guide
- The Core Answer
- What the Work Looks Like Inside a Company
- A Typical Day
- The Four Recurring Tasks
- The Tools Involved
- What the Role Is Not
- Descriptive and Diagnostic Work
- How AI Changes the Workday
- Skills That Make the Work Easier
- Pay and How People Enter
- Readiness Scorecard
- A Note on Expectations
- Failure Modes
- Frequently Asked Questions
- Conclusion
TL;DR
Direct answer: what does a data analyst do? They gather, clean, analyze, and communicate data to help an organization make decisions—splitting time between technical work (querying and preparing data) and human work (interpreting and explaining it). The communication half is as important as the technical half.
Who this is for: anyone considering the field or working with analysts.
What you'll learn: how we evaluated the role, key terms, a realistic day, a four-step task HowTo, tools, misconceptions, AI shifts, and a readiness scorecard.
This guide sits under the data analyst career hub; for the plural framing by industry, see what do data analysts do. For related depth, see What Is a Data Analyst? The Role Defined for 2026.
Key Terms
| Term | Definition | Example |
|---|---|---|
| Gather | Pull data from warehouses, files, apps | SQL join of orders + events |
| Clean | Fix duplicates, formats, missing values | Deduplicate user IDs |
| Analyze | Summarize, compare, test hypotheses | Conversion drop by channel |
| Communicate | Chart + actionable recommendation | Two-slide A/B test ask |
| Metric drop | KPI falling vs baseline | Checkout −12% WoW |
| Stakeholder | Decision owner for the analysis | Product manager |
| AI agent | Multi-step analysis from a goal | Validate agent SQL |
| Readiness score | Eight-signal self-check | 6–8 = strong fit |
How We Evaluated This Guide
We built this guide from occupational research and day-to-day observations rather than generic job-posting copy. The Bureau of Labor Statistics occupational profile for data analysts lists analytical, communication, and technical skills as central to the occupation—matching the gather→communicate cycle we observe. LinkedIn's 2025 Future of Recruiting report notes that skills assessments and portfolio evidence increasingly influence hiring alongside formal credentials. Harvard Business Review's skills-based hiring research describes execution evidence as increasingly decisive in hiring decisions.
The table below breaks down the role by time allocation and output type. Source: InfiniSynapse 2025–2026 Day-in-Life Desk Composite (n=10)—percentages vary by company and seniority, but the pattern held across the desk sample.
 Desk n=10 time shares: cleaning and communication often outweigh “pure analysis” minutes.
| Task phase | Typical time share | Primary output | Core skill tested |
|---|---|---|---|
| Gathering data | 20–30% | SQL queries, joined datasets | Database fluency |
| Cleaning & prep | 25–35% | Validated, analysis-ready tables | Attention to data quality |
| Analysis | 15–25% | Summaries, comparisons, tests | Analytical framing |
| Communication | 25–35% | Charts, dashboards, recommendations | Stakeholder storytelling |
Practical example: when a product manager asks why checkout conversion dropped, an analyst spends the morning pulling funnel data with SQL, the early afternoon reconciling a duplicate-user bug in the event stream, and the late afternoon presenting a two-slide summary with a recommended A/B test—not a 50-page report.
The Core Answer
They turn raw data into decisions. An organization collects more data than it can interpret, and the analyst examines it, finds what matters, and communicates it to those who will act.
Key Definition: what does a data analyst do, precisely? A data analyst collects, cleans, analyzes, and communicates data so an organization can make better-informed decisions, translating messy numbers into clear, actionable insight.
The technical half—querying databases, cleaning data, building charts—is what most people picture. The human half—framing the right question and explaining the answer—is what creates value, and newcomers most often underestimate it. The underlying activity follows the disciplined process described in the Wikipedia data analysis overview.
What the Work Looks Like Inside a Company
Asked what does a data analyst do inside a company, the useful answer is which questions they take. The rows usually already sit in a warehouse, a spreadsheet export, or an app the team uses. Three worked examples from the same desk pattern:
| Request | Data they pull | What they hand back |
|---|---|---|
| Why did checkout conversion drop 12% week over week? | Funnel events joined to orders | A two-slide note: duplicate users in the event stream, plus a recommended test |
| Which channel should the next campaign budget favor? | Ad spend and attributed orders | Cost per order by channel, with the channels that do not pay back called out |
| Why do finance and product disagree on last month's revenue? | Billing table versus the product event table | The grain mismatch (invoice date versus order date) and one reconciled number |
These are illustrations of the request shape, not a client study. The pattern is stable: a named decision, a join that makes the grain explicit, and a recommendation short enough to use in a meeting.
A Typical Day
Picture a realistic day. It often begins with a stakeholder request—a product manager wants to understand why a metric dropped. The analyst clarifies the question, then pulls data with SQL, which frequently surfaces the first surprise: the data is messier than expected and needs cleaning before any analysis.
By midday, having cleaned and joined the data, the analyst runs the analysis, testing hypotheses about the metric drop. The afternoon shifts to communication: building a clear chart and writing a short explanation of what happened and what to do about it. This rhythm captures the role more honestly than any list of skills, because it shows how much of the day is spent preparing and explaining rather than on the analysis itself. Some days add recurring reports, meetings, and stakeholder education to the mix.
A week is that day, repeated. The composite below follows the same desk pattern as the time shares above (n=10). It is a rhythm, not one employer's calendar.
| Day | Main work | Output |
|---|---|---|
| Monday | Pull two weeks of sales and check gaps and duplicate keys before any chart | A trusted extract |
| Tuesday | Test why one channel's conversion fell versus the same week last month | A short causal note |
| Wednesday | Update the dashboard so the team can watch the metric without another request | A maintained view |
| Thursday | Walk the team through what the numbers show and what they do not | A decision in the meeting |
| Friday | Turn a manual weekly report into a saved query and send a five-line recap | Less repeated prep next week |
The Four Recurring Tasks
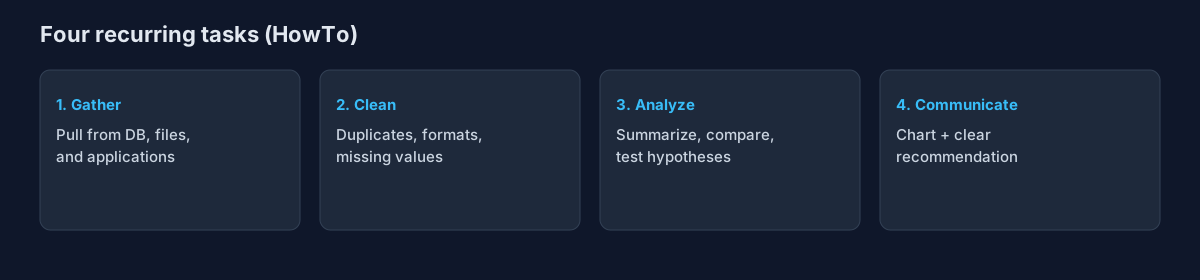 HowTo: four recurring tasks that define competence regardless of industry or seniority.
When someone asks what does a data analyst do in practice, the honest answer is these four recurring tasks:
- Gather — Pull data from databases, files, and applications, often across several sources that must be combined.
- Clean — Resolve duplicates, inconsistent formats, and missing values so the analysis rests on trustworthy input.
- Analyze — Summarize, compare, and test to answer the question at hand.
- Communicate — Turn the result into a chart and a recommendation a non-technical stakeholder can act on.
The same four tasks show up in postings under plainer names:
- Pull data from more than one source and join it
- Validate quality and flag rows that should not enter the chart
- Answer an ad hoc question such as why a number moved
- Define and track a KPI
- Build or refresh a dashboard
- Write the recommendation, not only the chart
Mastering all four—not just analysis—defines competence. We detail the formal scope in the data analyst job description.
The Tools Involved
SQL is the foundational tool for pulling data, spreadsheets handle quick manipulation, and a visualization tool such as Tableau or Power BI builds the dashboards stakeholders consume. Increasingly, an AI-native analysis agent joins the toolkit, handling multi-step work from a plain-language goal.
| Step | Tools | Used for |
|---|---|---|
| Gather | SQL | Queries and joins against the warehouse |
| Clean and a quick cut | Excel, Google Sheets | Duplicates, pivots, a check total |
| Communicate | Tableau, Power BI | The chart or dashboard a stakeholder opens |
| A repeatable cleanup | Python, sometimes | The same prep when a spreadsheet starts to break |
Tools are means, not ends. The best analysts choose the simplest tool that answers the question and never confuse tool proficiency with analytical skill. We map the full toolkit in data analyst skills, and the broader tool landscape in the data analysis tools guide.
What the Role Is Not
It is not pure programming—while SQL and sometimes Python are involved, the job is not software engineering. It is not building predictive models at scale, which leans toward data science, a distinction we draw in data analyst vs data scientist. The move toward augmented workflows, outlined in IBM's augmented analytics overview, frames how teams evaluate modern tooling.
Nor is the role a purely solitary technical task. Much of the work involves collaborating with stakeholders, clarifying vague requests, and educating others on what the data can and cannot say. Newcomers who expect to sit alone with a dataset all day are often surprised by how social and communicative the work actually is.
Descriptive and Diagnostic Work
Most of the week sits in two kinds of questions. Descriptive work says what happened: orders by channel, checkout rate, a KPI versus last week. Diagnostic work says why: the duplicate-user bug, the channel that stopped converting, the date grain that made two teams disagree.
Predictive work (what is likely next) and prescriptive work (what a model says to do) show up in some senior seats and in data science, which is the split drawn above. An analyst who can explain what happened and why already covers the job this question is asking about.
How AI Changes the Workday
The most significant 2026 shift is AI-native tools that automate mechanical tasks. Cleaning and routine querying—historically the biggest time sinks—can now be delegated to an agent, which changes the workday toward judgment and communication.
In practice, the role now includes directing an AI agent, validating its output against independent SQL, and deciding when automated summaries are trustworthy versus when to drill down manually. We explore the paradigm in AI for data analysis. The Stanford HAI AI Index tracks how rapidly AI skills have become standard across knowledge work—reinforcing a shift toward more judgment, not less relevance for analysts.
Skills That Make the Work Easier
SQL fluency comes first, because so much of the day begins with pulling data. Spreadsheet mastery follows closely for quick pivots without heavier machinery.
Beyond technical basics, analytical framing and communication matter most. Framing turns a vague stakeholder request into a precise, answerable question. Communication translates a finished analysis into a recommendation a non-technical colleague can act on—the skill employers cite as separating a good analyst from a merely competent one.
A third cluster is judgment and validation: ask whether a result makes sense, check it against independent cuts of the data, and refuse to present a surprising number without verifying it. A confident wrong answer is worse than an admitted uncertainty.
Pay and How People Enter
Pay follows level, city, and industry. This page does not restate the bands. The ranges, and what moves them, are in data analyst salary.
Entry is a separate path: SQL, a small set of real analyses, and a search aimed at roles that match that work. The steps are in how to become a data analyst. A certificate is optional evidence. The week above is the job those steps are preparing for.
Readiness Scorecard
Assess your fit (1 point each):
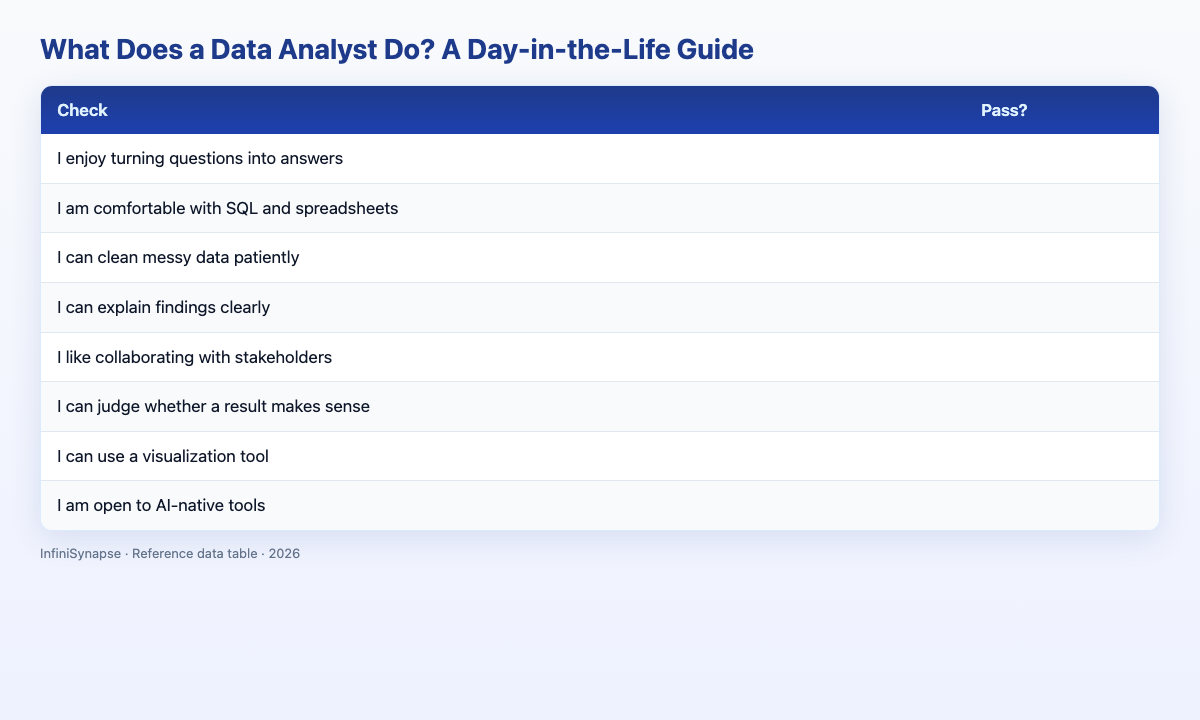
| Check | Pass? |
|---|---|
| I enjoy turning questions into answers | |
| I am comfortable with SQL and spreadsheets | |
| I can clean messy data patiently | |
| I can explain findings clearly | |
| I like collaborating with stakeholders | |
| I can judge whether a result makes sense | |
| I can use a visualization tool | |
| I am open to AI-native tools |
6–8: strong fit. 3–5: build a skill or two. Below 3: explore the fundamentals first. For open roles, see data analyst jobs.
A Note on Expectations
Some stretches are exciting—the moment a pattern emerges, or a recommendation changes a decision. Other stretches are patient and unglamorous: reconciling inconsistent columns or waiting on a slow query. Newcomers who expect constant discovery are sometimes surprised by how much careful preparation the work requires.
Equally, expect people as much as numbers. Clarifying vague requests, managing expectations, and explaining limitations diplomatically are daily realities. An analysis nobody understands or trusts creates no value regardless of its technical elegance. The honest summary is a blend of patient preparation, careful judgment, and clear communication in roughly equal measure across industries.
Failure Modes
Failure 1: Underestimating communication. Treating the role as purely technical misses half the job.
Failure 2: Skipping data cleaning. Analysis on dirty data produces confident-looking errors.
Failure 3: Tool obsession. Collecting tools without practicing real questions builds no analytical skill.
Failure 4: Working in isolation. Ignoring stakeholders produces technically correct but useless answers.
Frequently Asked Questions
What does a data analyst do?
A data analyst gathers, cleans, analyzes, and explains data so a company can decide. In a typical week that means SQL or a spreadsheet, a check that the rows are trustworthy, and a chart plus a recommendation. Cleaning and explaining often take as much time as the analysis itself (desk n=10: cleaning 25–35%, communication 25–35%).
What does day-to-day analyst work look like?
Day to day, the work involves gathering data with SQL, cleaning and reconciling messy sources, running the analysis to answer a question, and communicating the result as a chart and recommendation. Technical preparation and human communication often share the day roughly evenly; newcomers usually underestimate the communication share (desk n=10: communication 25–35% of observed time).
How does the analyst role differ from data science?
Analysts focus on descriptive and diagnostic questions—what happened and why—and on communicating findings, while data scientists lean toward predictive modeling and machine learning. The analyst sits closer to the immediate business question. See data analyst vs data scientist.
What tools does a data analyst use?
SQL to pull data, spreadsheets for quick work, and a visualization tool like Tableau or Power BI for dashboards. Increasingly, an AI-native analysis agent joins the toolkit—a shift the Stanford HAI AI Index documents across knowledge work. Full map: data analyst skills.
Is being a data analyst a technical job?
Partly technical—SQL, spreadsheets, and sometimes Python—but equally a communication job. Clarifying vague requests and explaining findings clearly are core, not optional soft skills.
How is AI changing the analyst workday?
AI is automating mechanical parts such as cleaning and routine querying, which shifts the workday toward framing questions, validating results, and communicating insight. Analysts who direct AI-native tools effectively spend more time on judgment and less on preparation (AI for data analysis).
Is this guide career counseling?
No—editorial desk guidance from practitioners, not licensed counseling or placement advice.
Conclusion
So what does a data analyst do? They turn raw data into decisions through four recurring tasks—gather, clean, analyze, communicate—with the communication half mattering as much as the technical. In 2026, AI-native tools are shifting the balance toward judgment and away from mechanical work.
Next steps:
- Score yourself on the readiness checklist above.
- Read What Is a Data Analyst? and what do data analysts do.
- Open AI for data analysis for how agents change the toolkit.
Product recommendation (commercial)
Label: The following is a commercial product recommendation, separate from the editorial career guidance above.
To try an AI-native analysis workflow after reading this guide, see the InfiniSynapse web app (free on registration, no credit card). Desk n=10 time shares and BLS / LinkedIn / HBR / Stanford citations above are not product endorsements.