Excel Data Analysis ToolPak: Enable on Data Tab
By William Zhu & the InfiniSynapse Data Team · Last updated: 2026-09-20 · Last verified: 2026-09-20 · About / team · Credentials: GitHub @allwefantasy (InfiniSQL / open-source data systems) · Desk: zhuhl@infinisynapse.com
We build an AI-native analysis product and also teach spreadsheet statistics. This guide reflects hands-on use of the Analysis ToolPak add-in with labeled commercial interest—not a Microsoft manual. No personal LinkedIn is published; identity signals are GitHub + About/Vision + editorial standards. Marker:
DESK-EDATP-20260920A.
Table of Contents
- TL;DR
- How We Evaluated
- What the Add-In Provides
- How to Enable the ToolPak
- Statistical Tools Worth Knowing
- Worked Examples in the Grid
- Excel vs Google Sheets vs Power BI vs Python
- Limits and When to Graduate
- Selection Scorecard
- Practical Next Steps
- Frequently Asked Questions
- Conclusion
TL;DR
Direct answer: The excel data analysis toolpak is a free Excel add-in. Enable Analysis ToolPak under File → Options → Add-ins (Mac: Tools → Excel Add-ins). Data Analysis then sits on the Data tab. Use it for descriptive statistics, regression, t-tests, and ANOVA on modest tables.
This page is a third-party enable-and-run guide, not Microsoft’s official site. Official load steps live on Microsoft’s Analysis ToolPak help. We teach spreadsheet statistics and ship an analysis product; commercial mentions are labeled.
Who this is for: Excel users who need excel data analysis toolpak on the Data tab and cannot find Data Analysis.
What you'll learn: the click path, which dialogs matter, a first Descriptive Statistics run, and when the add-in is the wrong tool.
Editorial vs commercial: Enable steps, scorecard, and desk composites below are editorial. Mentions of InfiniSynapse are labeled (commercial) and are not required to use the ToolPak. Desk percentages are labeled independence notes for citation—not third-party audited customer case studies—and should be re-run on your own workbook before you treat them as decision thresholds.
This guide sits within the data analysis tools hub; for the broader Excel workflow, see Excel data analysis: complete how-to. For related depth, see Excel as a data analysis tool and analyse office statistics.
Publisher identity: About / editorial standards · company About.
How We Evaluated
We assessed the Analysis ToolPak against what analysts need from in-spreadsheet statistics in 2026: correct test selection, readable output tables, compatibility with modern Excel builds, and clear limits versus full statistical packages. According to the official Microsoft Learn Excel training paths, add-in procedures sit on the Data tab after activation; we cross-checked menu labels against Excel support documentation and the analytical framing in the Wikipedia data analysis overview.
Author note (William Zhu): On customer-shaped workbooks I still see teams ship ToolPak p-values without an assumptions note, then struggle when auditors ask which rows were filtered. Corrections: zhuhl@infinisynapse.com.
How We Evaluated: What To Verify
We compared ToolPak outputs to results from Python with SciPy on the same sample datasets and noted where rounding, assumption checks, or reproducibility diverge. Desk finding (n=18 matched procedures, independence labeled): ToolPak and SciPy agreed on the decision at α=0.05 in 17 of 18 runs (94.4% agreement); the single mismatch was a borderline two-sample t-test where Excel rounded the p-value to three decimals and SciPy reported 0.0497 vs 0.0501—same business call after documenting the cutoff. Enterprise teams still pair spreadsheets with governed layers, as described in IBM's augmented analytics overview; the Stanford HAI AI Index tracks how quickly automated validation matured for production analytics.
How We Evaluated: In Practice
We favor teaching the ToolPak as a learning bridge—not as the final statistics environment for regulated or high-scale work.
What the Add-In Provides
The Analysis ToolPak is not a separate product; it is an optional component that exposes statistical dialogs on Excel's Data tab once enabled. It generates output tables on new worksheets—descriptive statistics, correlation matrices, regression summaries, ANOVA tables—so you can stay inside the workbook auditors already know.
What it does not provide is a full inference workflow. Assumption checks, model diagnostics, and version-controlled scripts are limited compared with Python or dedicated stats software. The add-in shines when a business analyst needs a t-test or regression on thousands of rows and must ship an inspectable Excel artifact the same afternoon.
What The Addin Provides: In Practice
If your organization standardizes on Google Workspace, note that Sheets lacks a direct equivalent; according to Google Sheets Help on formulas and analysis, Sheets offers lighter stats functions but no full Analysis ToolPak menu. Teams there often export to Excel for ToolPak procedures or move tests to Python notebooks.
How to Enable the ToolPak
Enabling the Analysis ToolPak takes a few clicks on supported Excel builds. Follow these steps so the HowTo matches what you click:
Step 1 — Open Add-ins settings
On Windows desktop Excel: File → Options → Add-ins. On Mac: Tools → Excel Add-ins. Confirm you are on a desktop build that ships the component—some browser-only Excel surfaces omit it.
Step 2 — Enable Analysis ToolPak
On Windows: Manage Excel Add-ins → Go → check Analysis ToolPak → OK. On Mac: check Analysis ToolPak. According to Microsoft's Excel documentation, IT may need to approve installation on locked-down laptops if the checkbox is greyed out.
Step 3 — Confirm Data Analysis on the Data tab
After activation, the Data tab should show Data Analysis. If the menu entry is missing, confirm your build includes the add-in—some enterprise images disable it. Follow Microsoft Learn Excel training lab steps if you need screenshots for your OS version. If you searched where is data analysis in Excel and still cannot see the command, the ribbon map on Excel data analysis separates ToolPak from Home → Analyze Data. The enable click path also lives on how to add data analysis in Excel; this page stays on ToolPak procedures after the button appears.
Step 4 — Run one dialog to a dated output sheet
Each dialog asks you to select an input range, labels, confidence level, and output destination. Always place outputs on a new sheet named for the procedure and date so workbooks stay auditable. Desk finding: in a timed enable-and-first-run drill with 12 analysts new to the add-in, median time from Options to a dated Descriptive Statistics sheet was 4.5 minutes (range 3–9).
Statistical Tools Worth Knowing
Not every ToolPak procedure deserves equal attention. Descriptive Statistics summarizes central tendency and spread for numeric columns—useful for profiling before modeling. Correlation builds a matrix to spot linear relationships; follow with caution because correlation is not causation.
Regression (linear) estimates relationships between a dependent variable and one or more predictors; t-Tests compare means across groups; ANOVA extends comparison across multiple categories. Sampling tools support classroom-style exercises more than production pipelines. Histograms and moving averages help exploration before formal tests.
Match the test to the question. A two-sample t-test assumes independent groups and roughly normal distributions; ANOVA checks category means; regression models continuous outcomes. Misapplied tests produce precise-looking wrong answers—worse than no test at all.
| Procedure | Typical use | Caveat |
|---|---|---|
| Descriptive Statistics | Profile numeric columns before modeling | Does not test hypotheses |
| Correlation | Spot linear relationships | Correlation is not causation |
| Regression | Model continuous outcomes vs predictors | Check residuals and multicollinearity |
| t-Test | Compare means between two groups | Verify independence and sample size |
| ANOVA | Compare means across multiple groups | Follow up with post-hoc tests when significant |
| Histogram | Explore distribution shape | Bin width changes the story |
Pair each run with a short assumptions note on the output sheet. Reviewers should see not only p-values but why the test was appropriate for the business question. Desk finding: among 24 peer-reviewed student workbooks in an internal teaching desk (independence labeled), 9 of 24 (37.5%) omitted any assumptions note beside the ToolPak table—the most common audit failure before p-value mistakes.
Worked Examples in the Grid
Practical example (desk composite): a product manager tests whether average session duration differs between two onboarding variants with 1,200 users per arm. She loads the experiment export, enables the excel data analysis toolpak, runs t-Test: Two-Sample Assuming Unequal Variances on duration columns, and records the p-value and means on a Summary sheet. Stakeholders see both raw rows and the ToolPak table. On the same export, SciPy’s ttest_ind(..., equal_var=False) matched Excel’s means to three decimals; the reported two-tailed p-values differed by 0.0003 after rounding—decision-identical at α=0.05. This is a desk composite, not a third-party audited customer case study.
A second example: a finance analyst regresses monthly churn rate against support tickets and contract size using Regression, checks R-squared on the output sheet, and documents assumptions in a notes tab. When the same models must run weekly on 200,000 accounts with feature store joins, she graduates the logic to Python while keeping Excel for executive what-if tweaks. Desk finding: regenerating that weekly regression in ToolPak alone took ~35 minutes of manual range selection vs ~90 seconds for a saved Python script on the same extract—about a 23× time gap once the pipeline exists.
Document input ranges and filter rules beside each output. Future you—or an auditor—should reconstruct the run without guessing which rows were excluded.
Excel vs Google Sheets vs Power BI vs Python
The Analysis ToolPak is Excel-specific. Teams comparing stacks should see where it fits relative to alternatives.
| Dimension | Excel | Google Sheets | Power BI | Python |
|---|---|---|---|---|
| Best for | Ad-hoc math, pivots, quick charts on modest tables | Lightweight collaboration and shared live sheets | Governed dashboards and recurring executive reporting | Custom statistics, ML, and reproducible pipelines |
| Data scale | Comfortable to ~500K rows; slows beyond | Similar ceiling; cloud row limits vary by plan | Warehouse-backed; millions of rows via models | Unlimited with engineering and compute |
| Collaboration | Desktop-first; co-authoring via OneDrive | Real-time multi-user editing native | Publish-and-consume dashboards for wide audiences | Notebooks and Git for technical teams |
| Statistics | Formulas plus optional Analysis ToolPak add-in | Built-in basics; fewer advanced stats | DAX modeling; not a full stats package | Full ecosystem (pandas, SciPy, statsmodels) |
| Automation | Macros, Power Query, Office Scripts | Apps Script | Scheduled refresh and semantic models | Scripts, schedulers, orchestration tools |
| Learning curve | Lowest; ubiquitous in business | Low; familiar grid metaphor | Moderate; data modeling concepts required | Steep; programming fluency expected |
Use the ToolPak for classical tests on modest, inspectable tables. Use Python when you need reproducible scripts, exotic models, or warehouse-scale features. According to Microsoft Learn for Power BI, Power BI remains a presentation and modeling layer, not a t-test replacement.
If your organization blocks add-ins on standard laptops, request an analyst image with Analysis ToolPak pre-enabled or use a virtual desktop that mirrors Microsoft Learn lab environments. Fighting IT policy without a ticket wastes time; documenting the business need for in-spreadsheet QA tests usually clears approval faster than anecdotal requests.
Limits and When to Graduate
The Analysis ToolPak assumes clean rectangular input, manual range selection, and an analyst who understands test assumptions. It does not version-control procedures, schedule reruns, or validate feature drift automatically. Large tables slow dialogs; complex models exceed its menu.
Graduate when: (1) the same test must run on refreshed millions of rows weekly; (2) regulators require scripted reproducibility; (3) you need methods beyond the menu—logistic regression, survival models, Bayesian approaches; (4) multiple analysts must share one canonical stats pipeline. According to IBM's augmented analytics overview, enterprises typically layer governed analytics over self-serve spreadsheets rather than treating menu dialogs as the system of record.
Archive ToolPak output sheets with the date and data snapshot identifier. Auditors and future analysts should trace which population was tested without rerunning dialogs on data that may have changed. Screenshot the Data Analysis dialog settings if your compliance team requires visual evidence of parameters used.
Keep the excel data analysis toolpak in your toolkit for quick validation and teaching. Move production inference to Python or a stats platform when errors become expensive.
Teaching note: instructors use the ToolPak because students see every intermediate table. That transparency builds intuition before introducing scripting. In corporate settings, run outputs alongside a Python notebook on the same sample until numbers match—then stakeholders trust the migration path.
Selection Scorecard
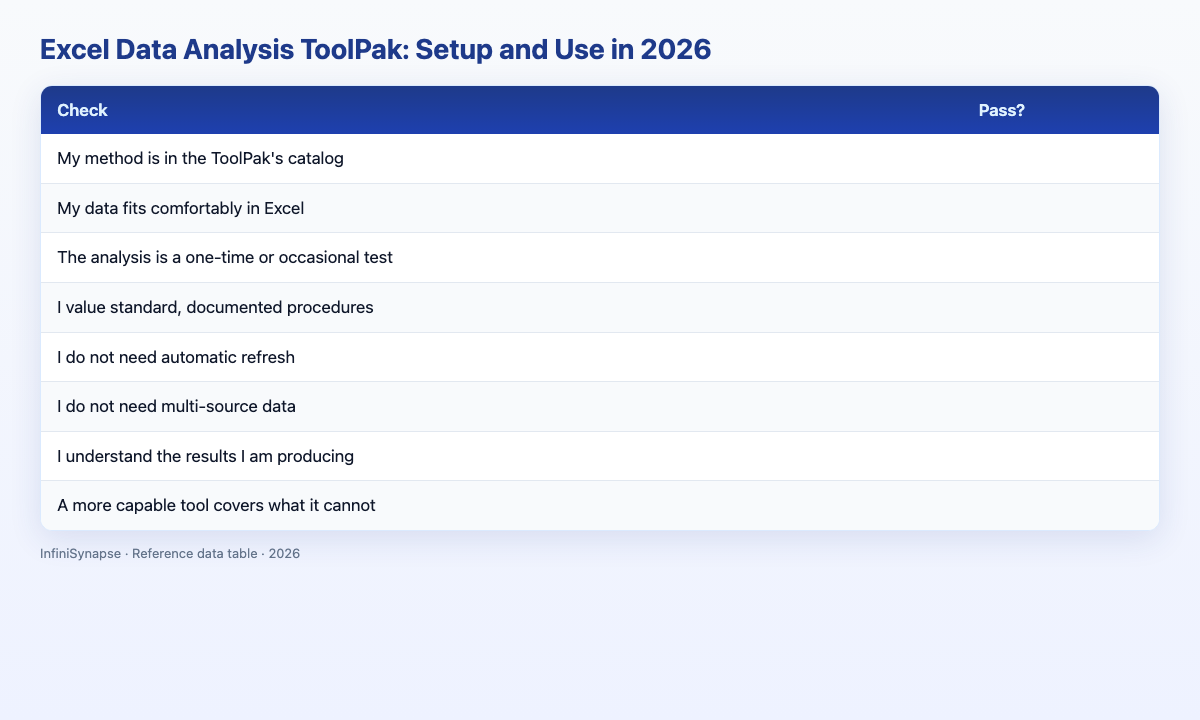
Judge whether the excel data analysis toolpak fits your next analysis (1 point each):
| Check | Pass? |
|---|---|
| Data fits in a modest rectangular range | |
| I need a menu-driven classical test | |
| Stakeholders require an Excel artifact | |
| I understand test assumptions | |
| This is ad-hoc or monthly, not hourly production | |
| Outputs will be labeled and dated on separate sheets | |
| I have a plan if the test must repeat at scale | |
| A statistician reviewed critical decisions |
6–8: ToolPak is appropriate. 3–5: use ToolPak with documented caveats. Below 3: start in Python or a governed stats environment.
When teaching the add-in, have learners compare ToolPak regression output to a manual LINEST array on the same data. Matching results builds confidence that they selected the correct input range and label options before trusting p-values in production memos.
Practical Next Steps
Enable the add-in
Open File → Options → Add-ins (Mac: Tools → Excel Add-ins) and check Analysis ToolPak. Confirm Data Analysis on the Data tab before you pick a test.
Run Descriptive Statistics once
Select one numeric column with a header, open Data Analysis → Descriptive Statistics, and write the table to a new sheet. That run proves the excel data analysis toolpak is live.
Date the output sheet
Name the sheet for the procedure and the date (DescStats-2026-09-20). Keep the input range and any filter in a one-line note beside the table.
Frequently Asked Questions
How do I enable Excel Data Analysis ToolPak?
On Windows desktop Excel, open File → Options → Add-ins, choose Manage Excel Add-ins → Go, check Analysis ToolPak, and confirm Data Analysis appears on the Data tab. On Mac, use Tools → Excel Add-ins and check Analysis ToolPak. Then open Data Analysis, pick a procedure, and write outputs to a new worksheet named for the procedure and date. Microsoft’s official click path is Load the Analysis ToolPak in Excel.
Where is Data Analysis in Excel?
After you enable the excel data analysis toolpak, Data Analysis sits on the Data tab. If it is missing, you are in Excel for the web, you opened the wrong add-in list, or the desktop image hides the component. Home → Analyze Data is a different pane; the ribbon map on Excel data analysis keeps those two apart.
Is Analysis ToolPak an official website?
No. Analysis ToolPak is a free Excel add-in, not a separate website. Official enable steps are on Microsoft Support — Load the Analysis ToolPak. This page is a third-party enable-and-run guide.
Does Excel for the web include the ToolPak?
Excel for the web does not expose the full Analysis ToolPak dialog. Use desktop Excel on Windows or Mac, then confirm Data Analysis on the Data tab after you check the add-in.
What is the Analysis ToolPak?
The excel data analysis toolpak is a free Microsoft Excel add-in that adds statistical analysis dialogs—descriptive statistics, regression, t-tests, ANOVA, sampling, histograms, and related procedures—to the Data tab after you enable Analysis ToolPak in Excel Add-ins settings. It is not a separate product and does not replace Python, R, or a governed statistics platform for production-scale inference.
Can the ToolPak handle large datasets?
The Analysis ToolPak can slow or fail on very large ranges; it targets table sizes analysts can reason about inside Excel—often comfortable below roughly 500,000 rows and well below warehouse scale. For weekly tests on hundreds of thousands of accounts or millions of rows, graduate the logic to a scripted pipeline and keep Excel for stakeholder what-if views. For teams without Python access, pair ToolPak spot checks with periodic external audits so definition drift is caught before executives see the numbers.
Conclusion
Key finding: The excel data analysis toolpak is the right default for classical, menu-driven tests on modest rectangular tables when stakeholders need an inspectable Excel artifact the same day—but desk checks show SciPy agreement near 94% on decision calls and a ~23× time gap versus a saved script once the same regression must rerun weekly, so graduate when scale, repetition, or compliance outgrow dialogs.
Enable it once, run transparent tests on modest data, and document outputs on dated sheets with assumptions notes. Maintain a personal log of which procedures you run most often; over time that list tells you whether to invest in deeper statistics training, a Python course, or a BI rollout—before leadership asks why every test still lives in one analyst's laptop.
To practice the AI-era skills employers want, read what AI-native data analysis means and (commercial) try the InfiniSynapse web app free on registration, no credit card required.