Survey Data Analysis: A Complete Workflow (2026)
By the InfiniSynapse Data Team · Last updated: 2026-07-08 · We build an AI-native data analysis platform; this workflow reflects how survey data is actually cleaned and analyzed in practice.
Table of Contents
- TL;DR
- What Makes Surveys Distinct
- Cleaning Survey Responses
- Analyzing Question Types
- Cross-Tabulation and Segmentation
- Handling Open-Ended Responses
- Reporting Survey Findings
- How AI Assists
- Good Analysis Starts With Good Design
- From Analysis to Action
- Scorecard
- Frequently Asked Questions
- Conclusion
TL;DR
Direct answer: survey data analysis is the process of cleaning, analyzing, and interpreting responses to a survey. It handles distinct challenges, mixed question types, rating scales, and open-ended text, through a workflow of cleaning responses, analyzing each question type appropriately, cross-tabulating by segment, and reporting clearly. Both quantitative and qualitative techniques apply.
Who this is for: anyone conducting survey data analysis on questionnaire or feedback data.
What you'll learn: what makes surveys distinct, cleaning responses, analyzing question types, cross-tabulation, handling open text, and reporting.
This guide sits within the advanced methods hub; for the general process, see the data analysis process.
For related depth in this pillar, see Bayesian Data Analysis: Intuition First.
What Makes Surveys Distinct
Survey data analysis has distinct characteristics that set it apart from other analysis. Surveys mix question types, multiple choice, rating scales, ranking, and open-ended text, each requiring a different analytical treatment. This mix means survey data analysis is rarely a single technique but a combination, applying the right approach to each question type within one dataset.
Surveys also carry specific data-quality concerns that shape survey data analysis. Response bias, incomplete submissions, and inconsistent answering all affect the data, so careful cleaning is especially important. The general activity follows the disciplined process described in the Wikipedia overview of data analysis, but survey data analysis adds these survey-specific considerations. Understanding what makes surveys distinct, mixed question types and particular quality concerns, is the foundation for analyzing them well rather than treating them like any other dataset.
Cleaning Survey Responses
Cleaning is a critical first stage of survey data analysis, because survey data arrives messier than it appears. Incomplete responses must be handled, deciding whether to exclude partial submissions or analyze the questions they did answer. Straight-lining, where a respondent gives the same rating to everything, may signal disengagement and warrant exclusion. Duplicate submissions need removing.
Cleaning in survey work also involves standardizing responses, especially for questions that allowed free text or inconsistent formats. Decisions made here, which responses to keep, how to treat missing answers, shape the results and should be documented. This cleaning stage is where much of the effort in survey work goes, and skipping it produces misleading conclusions. Careful cleaning ensures the subsequent analysis rests on trustworthy data, which is as true for survey data analysis as for any analytical work.
Analyzing Question Types
The heart of survey data analysis is applying the right technique to each question type. Multiple-choice and categorical questions are analyzed with frequency counts and percentages, showing how responses distribute. Rating scales, like satisfaction on a one-to-five scale, are summarized with averages and distributions, though care is needed since scale data has statistical subtleties. Predictive workflows should be interpreted against the Wikipedia machine learning overview.
Rating-scale analysis in survey work deserves particular attention, as treating ordinal scales as if they were fully numeric can mislead, so many analysts report distributions alongside averages. Ranking questions require their own summarization of preference orders. The principle across survey data analysis is to match the technique to the question type, since applying the wrong summary, like averaging categorical codes, produces meaningless results. Handling each question type correctly is a core skill of survey data analysis that distinguishes sound analysis from superficial number-crunching.
Cross-Tabulation and Segmentation
Cross-tabulation is one of the most valuable techniques in survey work, breaking responses down by respondent characteristics to reveal differences. Comparing satisfaction across age groups, regions, or customer types often surfaces insights invisible in the overall totals, since aggregate figures can hide sharp differences between segments.
Segmentation deepens survey data analysis by grouping respondents and comparing their patterns. This reveals which groups feel differently and why, guiding targeted action. Cross-tabulation and segmentation transform survey data analysis from reporting overall averages into understanding how different groups responded, which is usually far more actionable. A caution in survey work is ensuring segment sizes are large enough to be meaningful, since comparing tiny subgroups produces noise rather than insight. Used well, these techniques are where survey data analysis delivers its most decision-relevant findings.
Handling Open-Ended Responses
Open-ended responses are where survey data analysis meets qualitative methods. Free-text answers contain rich detail that closed questions cannot capture, but analyzing them requires the coding and thematic techniques of qualitative work rather than counting. This makes survey data analysis often a mixed-methods endeavor, combining quantitative and qualitative approaches.
Analyzing open text in survey work means coding responses to identify themes, then reporting those themes alongside representative quotes. This qualitative side, covered in depth in qualitative data analysis, adds the why behind the quantitative what. Many analysts underuse open-ended responses because they are harder to analyze, but they often contain the most valuable insights in survey work. Handling them properly, with systematic coding rather than casual skimming, ensures the full value of a survey is realized rather than leaving its richest data unexamined.
Reporting Survey Findings
Reporting completes survey data analysis by presenting findings clearly to those who will act on them. Good survey reporting leads with the key findings rather than walking through every question, uses clear visualizations suited to each data type, and combines the quantitative patterns with illustrative open-text quotes. The goal is insight, not a data dump of every result.
Honest reporting in survey work also notes the survey's limitations: sample size, potential response bias, and how representative the respondents are of the broader population. A finding from a small or skewed sample should be presented with appropriate caution. This transparency strengthens the credibility of survey data analysis. Done well, reporting turns the analysis into decisions, communicating what the survey revealed and what it implies clearly enough that stakeholders can act on it with appropriate confidence in the findings. Scripted analysis should follow Python documentation conventions for reproducibility and testable pipelines.
How AI Assists
In 2026, AI-native tools streamline survey data analysis across its stages. AI can help clean responses, apply the right summary to each question type, generate cross-tabulations, and, notably, code open-ended responses at scale, which is traditionally the most labor-intensive part of survey data analysis. This accelerates the whole workflow while the analyst validates and interprets.
InfiniSynapse illustrates this capability. It is not an NLP2SQL box or a ChatBI widget but a system that behaves like a professional data analyst, connecting to sources with one-click authorization and analyzing both the structured responses and the open text through InfiniSQL. For survey data analysis, its multi-modal capability handles the quantitative and qualitative sides together, which is exactly what surveys require. We explore the paradigm in what AI-native data analysis means, and the Stanford HAI AI Index documents how these tools handle mixed data while the analyst guides the interpretation that survey data analysis depends on.
Good Analysis Starts With Good Design
The quality of analysis is capped by the quality of the survey itself, so the best results begin before a single response arrives. A well-designed questionnaire asks clear, unambiguous questions, uses consistent scales, and avoids leading or double-barreled items that produce muddled data. When the instrument is sound, the analysis that follows is cleaner and more trustworthy, because the responses actually mean what they appear to mean.
Design choices ripple directly into analysis. A rating scale with too few points loses nuance; one with inconsistent labeling confuses respondents and analysts alike. Questions that allow multiple interpretations yield answers that cannot be cleanly summarized. Thinking about analysis during design, asking how each question will be summarized and what comparisons it will support, prevents the frustration of collecting data that cannot answer the intended question. The most experienced practitioners design the analysis and the questionnaire together, so that every question earns its place by contributing to a planned comparison or metric.
This connection between design and analysis also guards against common failures. A survey that forgets to collect the demographic variables needed for segmentation cannot be segmented afterward, no matter how skilled the analyst. One that uses incompatible scales across related questions makes comparison awkward. By anticipating the analysis while designing, you ensure the data you collect is the data you need, which is far cheaper than discovering the gap after fielding the survey and having to run it again.
From Analysis to Action
The purpose of analyzing responses is to inform a decision, so the strongest work connects findings explicitly to action. Rather than presenting every result, a good analyst highlights the findings that matter for the decision at hand and states what they imply. A satisfaction survey that reveals a specific pain point should lead to a concrete recommendation to address it, not merely a chart of scores.
Turning findings into action also means prioritizing. Not every finding is equally important, and part of the analyst's job is to distinguish the results that should drive decisions from those that are merely interesting. Presenting a ranked set of actionable insights, each tied to evidence from the responses, is far more useful to stakeholders than an exhaustive report. This decision-first framing is what makes a survey worth the effort of running it, and it ensures the analysis changes something rather than sitting unread. Closing that loop, from question to data to insight to action, is the true measure of a survey's value. Query-first analysis aligns with concepts in the Wikipedia SQL overview.
Scorecard
Assess your survey analysis (1 point each):
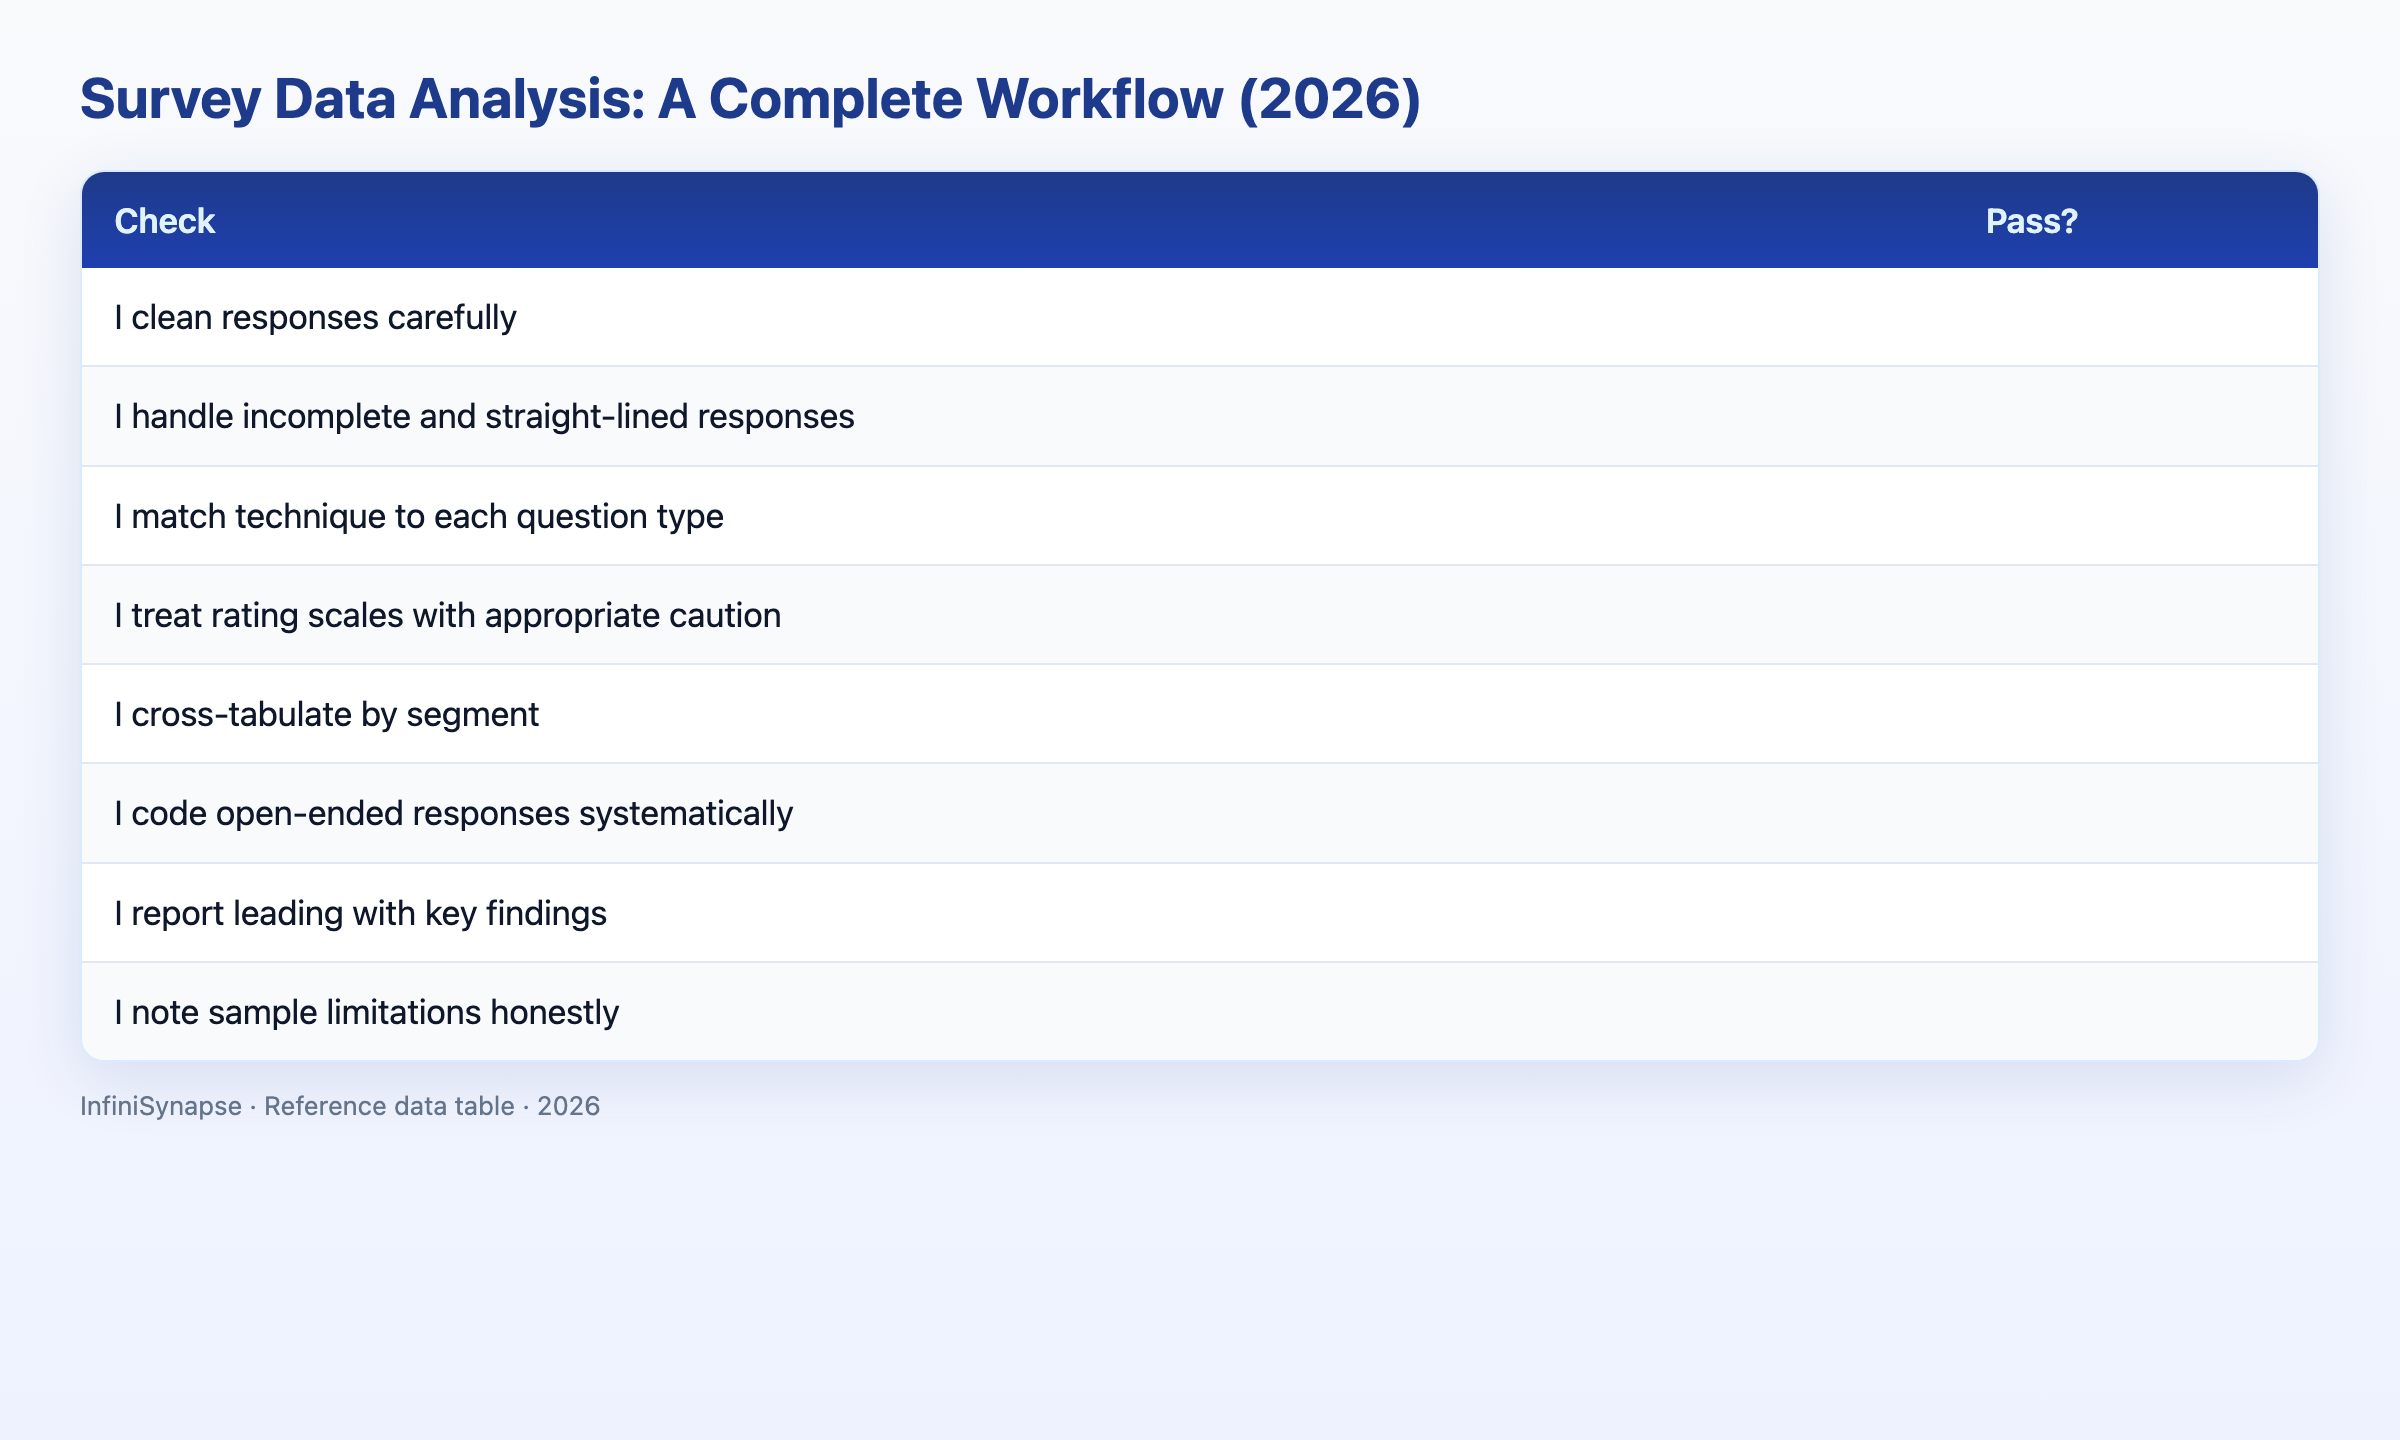
| Check | Pass? |
|---|---|
| I clean responses carefully | |
| I handle incomplete and straight-lined responses | |
| I match technique to each question type | |
| I treat rating scales with appropriate caution | |
| I cross-tabulate by segment | |
| I code open-ended responses systematically | |
| I report leading with key findings | |
| I note sample limitations honestly |
6–8: sound survey analysis. 3–5: strengthen a stage. Below 3: revisit the workflow.
Frequently Asked Questions
What is survey data analysis?
Survey data analysis is the process of cleaning, analyzing, and interpreting responses to a survey. It handles distinct challenges, mixed question types, rating scales, and open-ended text, through a workflow of cleaning responses, analyzing each question type appropriately, cross-tabulating by segment, and reporting clearly, combining both quantitative and qualitative techniques.
How do you analyze survey data?
Analyze survey data by first cleaning responses, handling incomplete and straight-lined submissions, then applying the right technique to each question type: frequencies for categorical questions, distributions and averages for rating scales, and coding for open-ended text. Cross-tabulate by segment to reveal differences, then report leading with key findings and noting limitations.
How do you analyze rating scale questions?
In survey data analysis, rating scale questions are summarized with averages and distributions, but with care: because scales are ordinal, treating them as fully numeric can mislead, so many analysts report the full distribution alongside averages. This gives a truer picture of how responses spread than an average alone, which can hide polarization.
How do you handle open-ended survey responses?
Open-ended responses in survey work are handled with qualitative coding: systematically labeling responses to identify themes, then reporting those themes with representative quotes. This adds the why behind the quantitative results. Open text often contains the most valuable insights, so systematic coding rather than casual skimming realizes the full value of a survey.
How does AI help with survey data analysis?
AI-native tools help survey data analysis by cleaning responses, applying appropriate summaries to each question type, generating cross-tabulations, and coding open-ended responses at scale, the most labor-intensive part. Their multi-modal capability handles both structured responses and open text together, accelerating the workflow while the analyst validates and interprets the findings.
Conclusion
Survey data analysis combines quantitative and qualitative techniques in a workflow of cleaning responses, analyzing each question type correctly, cross-tabulating by segment, handling open text, and reporting honestly. In 2026, AI-native tools accelerate every stage, especially coding open responses, while the analyst supplies the interpretation and judgment surveys require.
To see mixed structured-and-text analysis in one tool, read what AI-native data analysis means and try the InfiniSynapse web app free on registration, no credit card required.