Spatial Data Analysis: A 2026 Guide
By the InfiniSynapse Data Team · Last updated: 2026-07-08 · We build an AI-native data analysis platform; this guide reflects how location data is actually analyzed to surface geographic insight.
Table of Contents
- TL;DR
- What It Is
- Why Location Changes Analysis
- The Core Methods
- Common Applications
- The Tools
- Common Pitfalls
- How AI Assists
- Reading Maps Critically
- The Growing Reach of Location Insight
- Scorecard
- Frequently Asked Questions
- Conclusion
TL;DR
Direct answer: spatial data analysis examines data that has a geographic or location component to find patterns tied to place. It goes beyond ordinary analysis by accounting for where things are and how nearby locations relate, using methods like mapping, spatial clustering, and spatial statistics to answer questions that location shapes.
Who this is for: anyone learning spatial data analysis or working with location data.
What you'll learn: what it is, why location changes analysis, the core methods, common applications, the tools, and how AI assists.
This guide sits within the advanced methods hub; for the broader technique landscape, see data analysis techniques.
For related depth in this pillar, see Topological Data Analysis, Made Practical and Survey Data Analysis.
What It Is
Spatial data analysis is the analysis of data that includes a location component, coordinates, addresses, regions, to uncover patterns connected to geography. Where ordinary analysis might tell you how sales vary by product, spatial data analysis tells you how they vary by place and whether nearby locations behave similarly. Location is treated as a meaningful dimension of the data, not just another attribute.
The distinguishing idea of spatial analysis is that location matters and that nearby things tend to be related, a principle sometimes called the first law of geography. This spatial relationship is what spatial data analysis specifically accounts for, and it is what ordinary analysis ignores. Grounded in the broader analytical process described in the Wikipedia overview of data analysis, spatial data analysis adds the geographic dimension that transforms location-tagged data into geographic insight. Predictive workflows should be interpreted against the Wikipedia machine learning overview.
Why Location Changes Analysis
Location fundamentally changes analysis, which is why spatial data analysis is its own discipline. When data has a geographic component, patterns often cluster in space, nearby locations resemble each other, and ignoring this leads to misleading conclusions. Standard statistical methods that assume independent observations can be invalid when applied to spatially correlated data, a core concern of spatial analysis.
This spatial dependence means spatial data analysis requires methods designed for it. A pattern that looks like a strong relationship might simply reflect that nearby places share characteristics, and spatial data analysis has techniques to distinguish genuine relationships from mere spatial proximity. Recognizing that location changes what analysis is valid, that spatial data cannot be treated as if each point were independent, is the conceptual foundation of spatial analysis and the reason it demands specialized methods rather than ordinary statistics applied to coordinates.
The Core Methods
Spatial data analysis draws on several core methods. Mapping and visualization come first, since seeing data on a map reveals geographic patterns the eye grasps instantly, making visualization especially central to spatial data analysis. Spatial clustering identifies where high or low values concentrate, detecting hotspots and coldspots across a region.
More advanced spatial data analysis includes spatial autocorrelation, which measures how much nearby values resemble each other, and spatial regression, which models relationships while accounting for spatial dependence. Interpolation estimates values at unmeasured locations from nearby measurements. Each method of spatial analysis addresses a specific geographic question, from where clusters form to how a variable relates to location. Choosing the right method depends on the question, but all share the goal of extracting insight that accounts for the spatial structure of the data.
Common Applications
Spatial data analysis has wide applications. In business, it guides site selection, analyzing where customers are to choose store locations, and territory planning. In public health, spatial data analysis maps disease patterns to identify outbreaks and target interventions. In urban planning, it examines how land use, transportation, and population distribute across a city.
Environmental science relies heavily on spatial data analysis to study phenomena like pollution spread, habitat distribution, and climate patterns across geography. Logistics uses it to optimize routes and facility locations. These diverse applications share the common thread that location is central to the question, which is precisely where spatial data analysis adds value that ordinary analysis cannot. Wherever a question involves where as much as what, spatial data analysis is the appropriate approach, and its applications continue to expand as location data grows more abundant.
The Tools
The tools of spatial analysis range from dedicated geographic information systems to programming libraries. GIS software provides comprehensive environments for spatial data analysis, with powerful mapping and geographic processing capabilities that have long been the standard in fields like planning and environmental science. Scripted analysis should follow Python documentation conventions for reproducibility and testable pipelines.
For those who prefer code, programming libraries extend general analysis languages into spatial data analysis, letting analysts combine geographic methods with their broader workflow. Python and R both have strong spatial ecosystems. In 2026, AI-native platforms increasingly bring spatial data analysis capabilities to more users, lowering the barrier that specialized GIS tools once posed. The choice of tool for spatial data analysis depends on the depth of geographic work required and the analyst's existing skills, but the growing accessibility of these tools is bringing spatial data analysis to teams that once lacked the specialized expertise.
Common Pitfalls
Several pitfalls affect spatial data analysis. The most fundamental is ignoring spatial dependence, applying standard methods that assume independence to spatially correlated data, which produces invalid results. Recognizing when data requires genuine spatial data analysis rather than ordinary analysis is the first safeguard against this error.
Another pitfall in spatial analysis is the modifiable areal unit problem, where results change depending on how geographic areas are defined, so conclusions can be artifacts of arbitrary boundaries. Misleading maps are a third pitfall, where choices of color scale or classification distort the apparent pattern. A fourth is confusing spatial correlation with causation, just as in ordinary analysis. Avoiding these pitfalls requires understanding the specific challenges of spatial analysis, since geographic data carries subtleties that trip up analysts who treat it like ordinary data with coordinates attached.
How AI Assists
In 2026, AI-native tools make spatial data analysis more accessible, handling geographic processing that once required specialized GIS expertise. An analyst can increasingly ask location-based questions and have an agent perform the relevant spatial data analysis, lowering the barrier that specialized tools historically posed while surfacing the geographic patterns that matter.
InfiniSynapse reflects the broader accessibility shift. It is not an NLP2SQL box or a ChatBI widget but a system that behaves like a professional data analyst, connecting to sources with one-click authorization and analyzing data, including location-tagged data, through InfiniSQL. While dedicated GIS remains essential for deep geographic work, AI-native tools bring elements of spatial analysis to broader teams. We explore the paradigm in what AI-native data analysis means, and the Stanford HAI AI Index documents how these tools expand access while the analyst's understanding of spatial concepts remains essential to sound spatial data analysis.
Reading Maps Critically
Because maps are the primary output of geographic work, reading them critically is an essential skill for both producers and consumers of location insight. A map is a designed object, and its design choices, color scale, classification of values into ranges, projection, shape what pattern the viewer perceives. The same underlying data can tell very different visual stories depending on these choices, so a critical eye is essential.
One common distortion arises from classification: grouping values into ranges can make a gradual pattern look like sharp boundaries or vice versa, depending on where the breaks fall. Another arises from using raw counts rather than rates, so that a map of disease cases mostly reflects where people live rather than where risk is elevated. A responsible analyst chooses these design elements to reveal the true pattern honestly, and a critical reader questions whether the choices might be exaggerating or hiding something. Query-first analysis aligns with concepts in the Wikipedia SQL overview.
Developing this critical literacy protects against being misled by persuasive but distorted maps, which are common in media and advocacy. It also makes you a better producer, since understanding how design shapes perception lets you present geographic findings truthfully. Whether you are making maps or interpreting others', the habit of asking how the design choices affect the apparent pattern is central to honest work with location data, and it is as important as any statistical method in the geographic toolkit.
The Growing Reach of Location Insight
Location data has become vastly more abundant, and with it the reach of geographic insight has grown far beyond its traditional homes in planning and environmental science. Mobile devices, connected vehicles, and countless sensors now generate location-tagged data continuously, creating opportunities to understand movement, access, and place at a scale unimaginable a generation ago. This abundance is drawing more analysts into geographic work.
As location data proliferates, the ability to analyze it is spreading from specialists to a broader range of practitioners, aided by increasingly accessible tools. Businesses use it to understand customer catchments, cities to plan services, and researchers to study everything from mobility to inequality. This growing reach means geographic literacy is becoming a more widely valuable skill, no longer confined to those with dedicated GIS training. At the same time, the abundance of location data raises real privacy considerations, since movement data is deeply personal, so responsible practice must weigh insight against the obligation to protect the individuals the data describes. Navigating that balance thoughtfully is part of doing location analysis well in an era where such data is everywhere.
Scorecard
Assess your spatial analysis (1 point each):
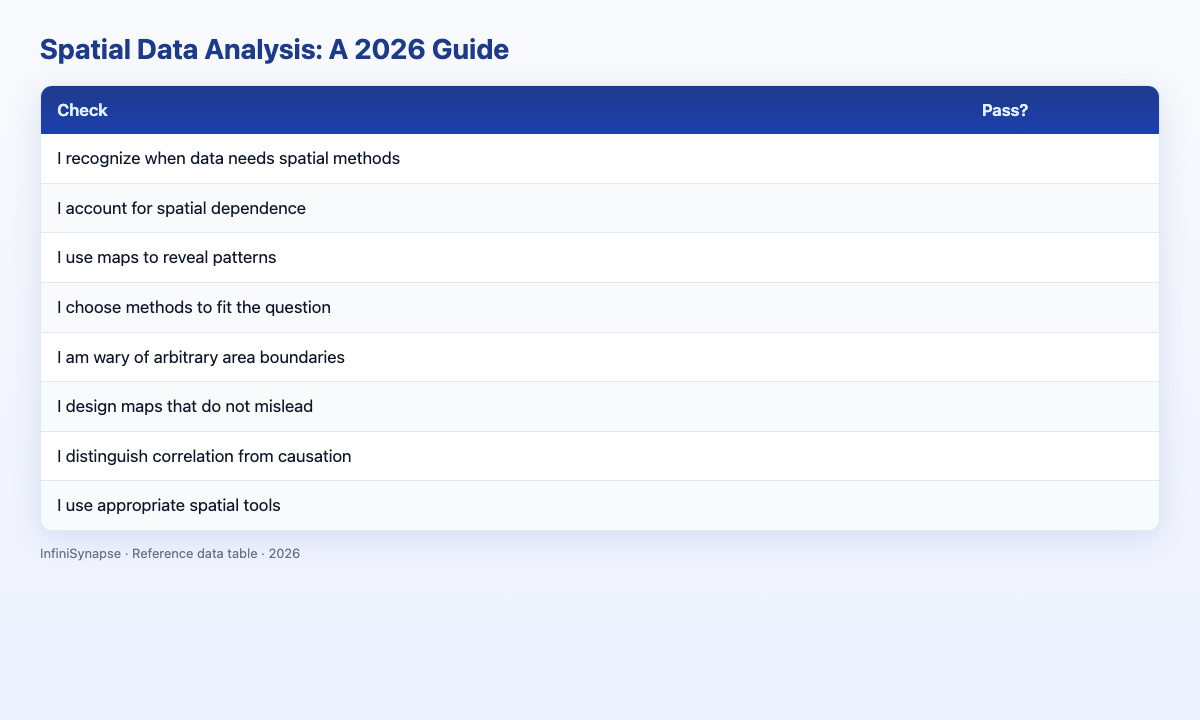
| Check | Pass? |
|---|---|
| I recognize when data needs spatial methods | |
| I account for spatial dependence | |
| I use maps to reveal patterns | |
| I choose methods to fit the question | |
| I am wary of arbitrary area boundaries | |
| I design maps that do not mislead | |
| I distinguish correlation from causation | |
| I use appropriate spatial tools |
6–8: sound spatial analysis. 3–5: strengthen a concept. Below 3: revisit spatial dependence.
Frequently Asked Questions
What is spatial data analysis?
Spatial data analysis examines data that has a geographic or location component to find patterns tied to place. It goes beyond ordinary analysis by accounting for where things are and how nearby locations relate, using methods like mapping, spatial clustering, and spatial statistics to answer questions that location fundamentally shapes.
Why does location require special analysis methods?
Location requires special methods because spatial data violates the independence assumption of standard statistics: nearby locations tend to resemble each other. Spatial data analysis accounts for this dependence, distinguishing genuine relationships from mere proximity. Applying ordinary methods to spatially correlated data can produce invalid or misleading conclusions, which is why the discipline exists.
What are the main methods in spatial analysis?
The main spatial analysis methods are mapping and visualization to reveal geographic patterns, spatial clustering to find hotspots, spatial autocorrelation to measure how nearby values resemble each other, spatial regression to model relationships accounting for location, and interpolation to estimate values at unmeasured points. Each addresses a specific geographic question.
What is spatial data analysis used for?
Spatial data analysis is used for site selection and territory planning in business, disease mapping in public health, land use and transportation study in urban planning, pollution and habitat study in environmental science, and route optimization in logistics. These share the common thread that location is central to the question being answered.
How does \1it help\2?
AI-native tools make spatial data analysis more accessible by handling geographic processing that once required specialized GIS expertise, letting analysts ask location-based questions and get spatial patterns surfaced. While dedicated GIS remains essential for deep work, AI-native tools bring elements of spatial analysis to broader teams, with the analyst's grasp of spatial concepts still essential.
Conclusion
Spatial data analysis adds the geographic dimension to analysis, accounting for where things are and how nearby places relate, through methods like mapping, clustering, and spatial statistics. It applies wherever location shapes a question, and in 2026 AI-native tools broaden access while understanding spatial concepts remains essential to sound results.
To see accessible analysis that includes location-tagged data, read what AI-native data analysis means and try the InfiniSynapse web app free on registration, no credit card required.