Topological Data Analysis: Shape, Tools & When to Use
Topological data analysis studies the shape of a point cloud: connected components, loops, and voids that correlation and clustering do not name. Use it when that shape is the question, after PCA and a simple clustering pass have already failed to answer it.
By the InfiniSynapse Data Team · Published: 2026-07-09 · Last updated: 2026-09-23 · Next review: 2026-12-23 · About / Team: https://infinisynapse.com/en/editorial-standards (#about)
Named authors & credentials (Authority): William Zhu — InfiniSynapse cofounder; public professional background: GitHub @allwefantasy (InfiniSQL / open-source data systems). Desk contact: zhuhl@infinisynapse.com. Page reviewers with published industry resumes / qualification frames: analytics engineering, data platform, editor. Traceable org + individual authority: About / team page · who reviews · InfiniSynapse org on GitHub.
Disclosure: we build InfiniSynapse, an AI-native Data Agent platform. This guide evaluates when shape-based methods change decisions; InfiniSynapse appears only where governed analytics is relevant.
External validation status. Third-party frameworks / peer signals (not InfiniSynapse product claims): Edelsbrunner et al. 2002, Zomorodian & Carlsson 2005, Carlsson 2009, Cohen-Steiner, Edelsbrunner, and Harer 2007, Stanford HAI AI Index 2026, HBR skills-based hiring (2022), IBM augmented analytics, GUDHI, scikit-tda. Peer-review archive: editorial standards. This page is vendor-affiliated; it is not a commissioned independent audit.
Table of Contents
- TL;DR
- What topological data analysis is
- How We Evaluated TDA Methods
- From point cloud to barcode
- A runnable circle-and-blob example
- Persistence into model features
- Tools and Libraries Compared
- Where shape methods apply
- From Desk Fixture to Plant Sensors
- When Simpler Methods Suffice
- AI and Advanced Methods in 2026
- TDA Readiness Scorecard
- Practical Next Steps
- Frequently Asked Questions
- Who wrote this
- References
- Conclusion
TL;DR
Direct answer: Topological data analysis reads the shape of data — connected components, loops, and voids — across scales. It is the right next step for a high-dimensional point cloud when PCA and clustering have not named the structure you hypothesized, using libraries such as GUDHI and Ripser.py.
Who this is for: analysts and researchers deciding whether topological data analysis is worth the learning cost on one concrete question.
What you'll learn: a definition you can quote, how a point cloud becomes a barcode, a reproducible circle-versus-blob check, how diagrams become model features, which library to pin, and when to stop.
This guide sits within the advanced methods hub. For related depth in this pillar, see spatial data analysis and Bayesian data analysis. Shape stays here. Location and clusters are how you detect spatial data. For the broader method landscape, see data analysis methods.
What topological data analysis is
Topological data analysis studies shape that survives a change of coordinates. The Wikipedia overview [15] frames it as a way to pull structure from high-dimensional, incomplete, noisy data without depending on one privileged metric. A plotted cloud may show a blob, several clusters, a ring, or branching arms. Connected components count separate groups; loops suggest cyclic dynamics; higher-dimensional voids appear in richer embeddings.
Correlation captures pairs. A cloud can show weak pairwise correlations and still form a ring. Topological data analysis names that ring. Carlsson’s survey (2009) [8] is the readable bridge from the picture to the algebra: connect points within distance ε, then increase ε, and keep the features that survive many values of ε.
How We Evaluated TDA Methods
We selected topological data analysis approaches by whether they change a decision, not by mathematical novelty. Each candidate had to pass four checks: the data are high-dimensional enough that local summaries hide global structure; a persistent feature survives reasonable noise; a stakeholder can read the output; and a simpler baseline (PCA, clustering, UMAP) was attempted first.
We checked that bar against the Wikipedia data analysis overview [1], the Wikipedia topology overview [2], and the scikit-learn user guide [3]. A one-off script with unpinned dependencies fails the same audit as any opaque model. We favor GUDHI and Ripser.py, plus a notebook that records the distance and the filtration. Teams that already run governed exploration, as in IBM's augmented analytics overview [4], can treat topological data analysis as a specialist escalation. The Stanford HAI AI Index Report 2026 [5] shows assistants speeding up routine EDA; they still leave the diagram to a person.
From point cloud to barcode
Persistent homology is the calculation that makes topological data analysis operational. Foundational algorithms appear in Edelsbrunner, Letscher, and Zomorodian (2002) [6] and the algebraic formulation of Zomorodian and Carlsson (2005) [7].
Math sketch. Given a finite metric space $(X, d)$ and scale $\varepsilon \ge 0$, a filtration builds nested simplicial complexes. Persistent homology tracks classes in $H_k$. Each class has a birth $b$ and a death $d$. Persistence is $d - b$. Betti numbers $\beta_0, \beta_1, \beta_2$ count components, loops, and voids at one scale. Topological data analysis replaces that snapshot with the multiscale record.
Čech, Vietoris–Rips, and Alpha
In topological data analysis the complex is a parameter, not a silent default.
| Complex | Rule | When we use it |
|---|---|---|
| Čech | Nerve of balls of radius ε around each point | Closest to the union of balls; costly as dimension grows |
| Vietoris–Rips | A simplex on every finite subset whose pairwise distances are all ≤ ε | Ripser’s default; the desk fixture below uses this |
| Alpha | A subcomplex of the Delaunay triangulation, filtered by radius | Smaller than Čech; GUDHI’s usual choice on low-dimensional clouds |
Rips accepts any finite metric, including a distance matrix. Alpha is the smaller complex when the cloud already sits in $\mathbb{R}^2$ or $\mathbb{R}^3$. Record the choice beside the distance metric.
Barcodes and persistence diagrams
Topological data analysis draws the same pairs $(b, d)$ in two pictures. A barcode is one horizontal bar per feature, from birth to death. A persistence diagram is one point per feature, birth on the horizontal axis and death on the vertical. Points far from the diagonal are long-lived. Points near the diagonal are usually noise.
Cohen-Steiner, Edelsbrunner, and Harer (2007) [16] proved that the bottleneck distance between diagrams is at most the size of the input perturbation. A little coordinate noise does not invent a new long bar. Stability does not choose the metric. Document preprocessing anyway.
The Mapper algorithm [9] is the other picture inside topological data analysis. Filter the cloud through a lens (a PCA coordinate or a density), cover that range, cluster inside each slice, and connect clusters that overlap. KeplerMapper draws the graph. Mapper does not replace a barcode. It gives stakeholders a shape they can click.
A runnable circle-and-blob example
Experience (InfiniSynapse Data Team desk, 2026-07-28). We re-ran a labelled synthetic fixture under named accountability (William Zhu): two point clouds of n = 400 each, numpy seed 42, Euclidean Vietoris–Rips via Ripser.py 0.6.15, maxdim = 1.
| Cloud | Construction | Max finite H₁ persistence | H₁ features with persistence > 0.5 | Runtime |
|---|---|---|---|---|
| Circle + noise | unit circle, σ = 0.05 | 1.43 | 1 | 0.28 s |
| Isotropic blob | N(0, 0.35²) in ℝ² | 0.09 | 0 | 0.03 s |
The circle’s longest H₁ bar was about 15.6× the blob’s. PCA followed by 2-means does not name that gap as a loop. This is the desk signal for when topological data analysis earns compute: the scientific question is a cycle, not only a cluster count. It is not a customer KPI and not a root-cause proof. Reproduce these two clouds before you point the same pipeline at a sensor extract.
Persistence into model features
A diagram is not yet a feature matrix, so topological data analysis still needs a vector of fixed length before a classifier. The giotto-tda Vietoris–Rips quickstart [17] is the path we recommend: build diagrams with VietorisRipsPersistence, then vectorize with PersistenceEntropy. Persistence landscapes and persistence images live in the same gtda.diagrams module.
We did not re-run giotto-tda on the circle fixture. Those numbers are Ripser.py 0.6.15. Ripser or GUDHI answers whether a long bar exists. giotto-tda answers whether that bar can be a feature. Refuse the model if the topological coordinates do not beat the PCA baseline on held-out labels.
Tools and Libraries Compared
Topological data analysis libraries span C++ cores with Python bindings and pure Python packages. Versions below were checked on PyPI, CRAN, or project docs on 2026-07-28, except giotto-tda, which we cite from its quickstart rather than a fresh pin.
| Tool | Language | Version we cite | Strengths | Best for |
|---|---|---|---|---|
| GUDHI | C++/Python | 3.13.0 (docs) | Rips, Alpha, cubical, persistence | Research-grade homology |
| Ripser.py | Python | 0.6.15 (PyPI) | Fast Vietoris–Rips | Large clouds, quick diagrams |
| giotto-tda | Python | quickstart API | Diagrams to vectors, sklearn API | Features for a classifier |
| KeplerMapper | Python | 2.1.0 (PyPI) | Mapper graphs | Stakeholder exploration |
| scikit-tda | Python | 1.1.1 (PyPI) | Ecosystem hub | Learning the stack |
| R TDA package | R | 1.9.4 (CRAN) | Landscapes, academic workflows | Statistics-heavy teams |
Pin dependencies and save the diagram with the seed, following the Python documentation. The Wikipedia software list [15] also names Dionysus, PHAT, and DIPHA. Those engines compute homology. They do not vectorize a diagram.
Where shape methods apply
Topological data analysis has traction where a structural hypothesis is specific and local summaries blur it. State the shape first, then choose the tool.
| Domain | Shape question | What persistence is asked to show |
|---|---|---|
| Gene expression and protein networks | Do interactions form loops rather than a tree? | Long bars in the network filtration |
| Neural population recordings | Is the activity cyclic in a high-dimensional state space? | A persistent H₁ class across scales |
| Porous or networked materials | How do voids connect as the threshold moves? | H₂ features that survive noise |
| Sensor windows and delay embeddings | Does a pre-failure regime orbit? | H₁ in the failure class, absent in the normal class |
| Latent spaces and loss surfaces | Did k-means collapse a branch or a ring? | A Mapper graph or a long bar the clustering step never named |
Each row is valid only when the shape question is written down before the library is imported. Mapper on a behavior embedding is the same test: nodes that k-means had glued together.
From Desk Fixture to Plant Sensors
The circle-versus-blob numbers show how topological data analysis transfers to operations without inventing a customer KPI.
A manufacturing team watches hundreds of sensor channels and suspects a periodic fault that standard alarms miss. The analyst exports normalized windows labeled normal versus pre-failure, embeds them with PCA to twenty dimensions so the complex stays tractable, and runs Ripser on each class with Ripser.py 0.6.15 and the same logged filtration as the desk fixture.
A long-lived H₁ bar in the pre-failure class, absent from the normal class, supports a cyclic-fault hypothesis. Check it with KeplerMapper 2.1.0 and the first principal component as the lens. The diagram points at a spectral diagnostic. It does not replace one.
Ship the diagram, the preprocessing, the filtration, and a note that topological data analysis suggests a cycle. Harvard Business Review, February 2022 [10] is why that note stays inspectable: seed, version, and the baseline that failed.
When Simpler Methods Suffice
Topological data analysis is the wrong tool when the data are low-dimensional, when regression or clustering already answers the question, or when stakeholders need a coefficient. If PCA plus k-means separates the classes and persistence adds nothing, stop. The blob is that case: its longest finite H₁ bar was 0.09, and nothing persisted past 0.5.
Filtrations and diagram reading have a real learning cost. Reserve topological data analysis for questions where conventional EDA failed and the shape is the object of inference. The scikit-learn documentation [3] covers decomposition, manifold learning, and clustering, which should come first.
AI and Advanced Methods in 2026
Assistants now draft the Ripser or Mapper snippet. Reading a topological data analysis diagram is still a human job: which bar is signal, which complex you chose, and whether the baseline already solved it. For warehouse-scale exploration that standard methods handle, see what AI-native data analysis means. Features from a diagram still need a held-out check in scikit-learn.
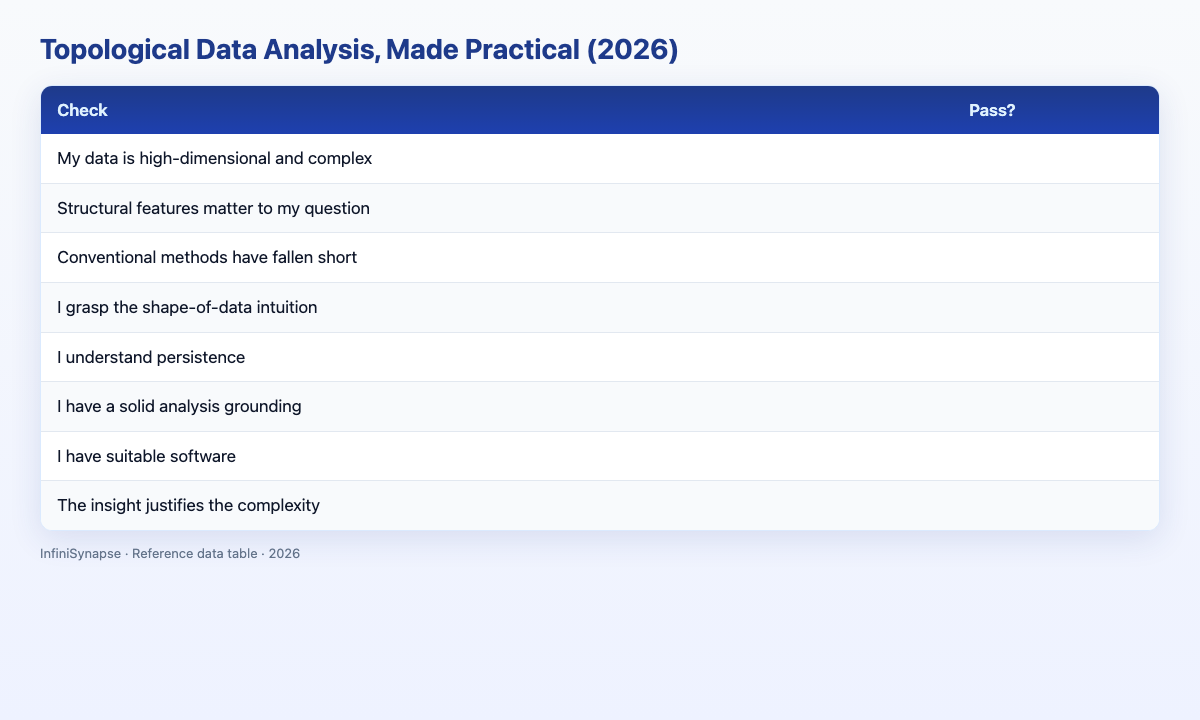
TDA Readiness Scorecard
Score whether topological data analysis fits before you install a library (1 point each):
| Check | Pass? |
|---|---|
| The cloud is high-dimensional or structurally tangled | |
| You have a shape hypothesis (loop, component, branch, void) | |
| PCA and clustering did not answer that hypothesis | |
| You can explain birth, death, and persistence | |
| Preprocessing and the distance metric can be written down | |
| A pinned library is available (GUDHI, Ripser, KeplerMapper, or giotto-tda) | |
| A stakeholder can read a Mapper graph or a diagram | |
| The possible insight justifies the learning and compute cost |
6–8: topological data analysis may be worth a circle-versus-blob fixture. 3–5: strengthen the baseline first. Below 3: standard methods are the better spend.
Practical Next Steps
- Reproduce the topological data analysis desk fixture:
n = 400, seed42, Ripser.py0.6.15, circle versus blob. Confirm the H₁ gap before any production window. - Pin the library from the table. Save the diagram and the filtration parameters in git.
- If the next consumer is a classifier, vectorize the diagram (persistence entropy, landscape, or image) and beat the PCA baseline on held-out labels.
- Only then move topological data analysis onto a domain embedding — plant sensors, a biological network, or a latent space — with the shape hypothesis written in one sentence.
- For everyday questions that standard methods already answer, read what AI-native data analysis means.
Frequently Asked Questions
What is topological data analysis?
Topological data analysis applies topology to the shape of a dataset: how points connect, form loops, or leave voids. Persistent homology and the Mapper algorithm are the two tools analysts actually run. The method is most useful on complex, high-dimensional data after simpler exploratory methods have been tried.
What is persistence?
In topological data analysis, persistence is the lifetime $d - b$ of a feature as the scale moves. Long bars are treated as signal. Short bars are treated as noise. A barcode and a persistence diagram draw those same pairs.
What software implements it?
GUDHI 3.13.0 and Ripser.py 0.6.15 compute persistent homology. KeplerMapper 2.1.0 builds Mapper graphs. giotto-tda turns diagrams into vectors for scikit-learn. R users can start with the CRAN TDA package 1.9.4. The broader learning hub is scikit-tda.
When should you use it?
Use topological data analysis when the data are high-dimensional, a cycle or a void would change the decision, and PCA plus clustering did not reveal that shape. For a coefficient, stay with scikit-learn.
How does AI relate to it?
Assistants speed up routine EDA and can scaffold the library calls. Choosing the filtration and reading the diagram still require a person. Treat topological data analysis as a deliberate escalation, not a default button.
Who wrote this
Named author. William Zhu — InfiniSynapse cofounder. Professional background (public): GitHub @allwefantasy. Org profile: github.com/InfiniSynapse.
Team byline & About page. Published by the InfiniSynapse Data Team. Public About / Team page: https://infinisynapse.com/en/editorial-standards · About InfiniSynapse.
Desk experience. The circle-versus-blob fixture was re-run on the InfiniSynapse research desk (2026-07-28) under William Zhu’s engineering accountability, with pinned Ripser.py 0.6.15 and seed 42. The giotto-tda path is cited from the project quickstart; we did not claim a second timed run.
Corrections & peer review. zhuhl@infinisynapse.com · corrections policy · peer-review archive.
Suggested citation
APA (7th): InfiniSynapse Data Team. (2026, September 23). Topological data analysis: shape, tools, and when to use. InfiniSynapse. https://infinisynapse.com/en/blog/topological-data-analysis
References
- [Reference] Wikipedia. Data analysis. en.wikipedia.org/wiki/Data_analysis
- [Reference] Wikipedia. Topology. en.wikipedia.org/wiki/Topology
- [Docs] scikit-learn developers. User guide. scikit-learn.org/stable/user_guide.html
- [Reference] IBM. What is augmented analytics? ibm.com/topics/augmented-analytics
- [Independent] Stanford Institute for Human-Centered Artificial Intelligence. AI Index Report 2026. hai.stanford.edu/ai-index
- [DOI] Edelsbrunner, H., Letscher, D., & Zomorodian, A. (2002). Topological persistence and simplification. Discrete & Computational Geometry, 28, 511–533. https://doi.org/10.1007/s00454-002-2885-2
- [DOI] Zomorodian, A., & Carlsson, G. (2005). Computing persistent homology. Discrete & Computational Geometry, 33, 249–274. https://doi.org/10.1007/s00454-004-1146-y
- [Journal] Carlsson, G. (2009). Topology and data. Bulletin of the American Mathematical Society, 46(2), 255–308. AMS
- [Reference] Wikipedia. Mapper (data analysis / algorithm). en.wikipedia.org/wiki/Mapper_algorithm
- [Independent] Harvard Business Review. (2022, February). Skills-Based Hiring Is Good for Business. What Are the Next Steps? hbr.org/2022/02/…
- [Docs] GUDHI project. GUDHI Python modules (v3.13.0). gudhi.inria.fr/python/latest
- [Docs] scikit-tda. Ripser.py. ripser.scikit-tda.org
- [Policy / About] InfiniSynapse. About the research desk & editorial standards. infinisynapse.com/en/editorial-standards
- [Person] William Zhu. Cofounder, InfiniSynapse — public engineering profile. github.com/allwefantasy
- [Reference] Wikipedia. Topological data analysis. en.wikipedia.org/wiki/Topological_data_analysis
- [DOI] Cohen-Steiner, D., Edelsbrunner, H., & Harer, J. (2007). Stability of persistence diagrams. Discrete & Computational Geometry, 37, 103–120. https://doi.org/10.1007/s00454-006-1276-5
- [Docs] giotto-tda. Topological feature extraction using VietorisRipsPersistence and PersistenceEntropy. giotto-ai.github.io
Conflict-of-interest note: InfiniSynapse sells an AI-native analytics platform. Library notes are open-source options checked against a labelled desk fixture, not a commissioned ranking.
Conclusion
Topological data analysis names loops, components, and voids when PCA and clustering do not. Start from a written shape hypothesis, choose Čech, Rips, or Alpha on purpose, pin the library, and keep the barcode next to the baseline it beat. The 15.6× H₁ gap on the circle fixture is the topological data analysis check to reproduce before a plant window or a latent space inherits the same pipeline. Teams that can show the seed, the version, and the failed baseline can defend the diagram when someone asks whether it is a cause or only a shape.