Data Analytics Software Compared (2026)
By the InfiniSynapse Data Team · Last updated: 2026-07-15 · We build an AI-native data analysis platform and work across analytics stacks daily; this guide compares data analytics software in 2026 by category and decision, not by brand ranking.
Table of Contents
- TL;DR
- How We Compare It
- What It Is
- The Main Categories
- Criteria That Matter
- Matching Software to Need
- Where the Category Came From
- Common Pitfalls
- The Category in the Age of AI
- Readiness Scorecard
- Common Misconceptions
- Frequently Asked Questions
- Conclusion
TL;DR
Direct answer: data analytics software is the class of tools that helps people clean, query, analyze, and present data — from spreadsheets and SQL tools to statistical environments, BI platforms, and AI assistants. In 2026, choosing data analytics software is about matching the tool to your data, your questions, and your team's skills rather than finding one product that claims to do everything.
Who this is for: analysts and leaders evaluating data analytics software in 2026.
What you'll learn: what it is, the main categories, the criteria that matter, how to match it to need, and how AI relates.
This guide sits under the data visualization hub.
For related categories, see data analytics tools.
Also see business analytics software.
How We Compare It
Implementation details are commonly grounded in AWS Well-Architected Framework when teams translate concepts into production practice.
We compare data analytics software by category and criteria rather than by ranking products, because fit is contextual. Every point reflects real evaluations. We anchor concepts to the BIRD NL2SQL benchmark and weigh evaluation against Wikipedia data quality overview.
The table below frames data analytics software.
| Category | Best for |
|---|---|
| Spreadsheets | Quick, small-scale work |
| SQL & query tools | Structured interrogation |
| Statistical/code | Custom modeling |
| BI platforms | Repeatable reporting |
| AI assistants | Conversational analysis |
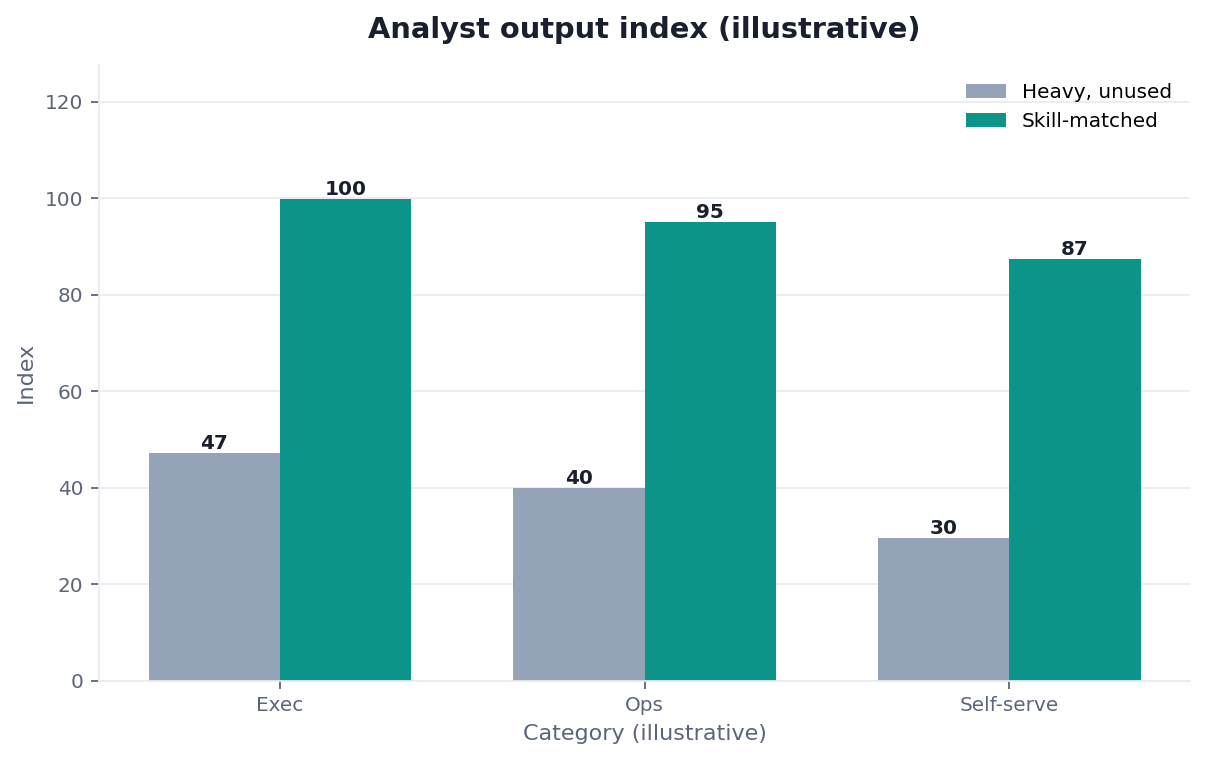
Practical example: a team overpaid for heavy data analytics software their analysts could not use; matching tools to real skills — the fit-first logic reinforced at Elastic documentation — cut cost and lifted output.
Scope note: This guide reflects patterns we see when mid-market and enterprise teams work with data analytics software in 2026. It is not a substitute for legal counsel, vendor runbooks, or a formal survey of every industry — and when a smaller toolset or lighter process would serve, a full program is overkill.
What It Is
At its core, data analytics software is any tool that helps turn raw data into understanding, covering the stages of cleaning, querying, analyzing, modeling, and presenting.
Key Definition: data analytics software is the set of applications, languages, and environments used to prepare, query, analyze, model, and communicate data, ranging from general-purpose spreadsheets and SQL tools to specialized statistical and programming environments, business intelligence platforms, and AI-powered analysis assistants.
The essence of data analytics software is that the category is broad and no single product excels at every stage. Cleaning, precise querying, modeling, and communication are distinct jobs, so the practical aim is a well-matched set rather than one tool asked to do everything.
The Main Categories
Core definitions remain usefully summarized in Wikipedia data warehouse overview for shared vocabulary across stakeholders.
Data analytics software falls into categories by the stage it serves: spreadsheets for quick preparation and small analysis, SQL and query tools for interrogating structured data, statistical and programming environments for modeling, BI platforms for repeatable reporting, and AI assistants that increasingly span stages.
Each category of data analytics software has a clear sweet spot, as the analytics guidance at Anthropic research reflects. Spreadsheets are unbeatable for quick, ad-hoc work; SQL is the rigorous choice for structured data; code environments handle bespoke modeling; BI platforms industrialize dashboards. Trouble arises when a tool is pushed past its sweet spot — modeling at scale in a spreadsheet, for instance — which is a frequent source of error and frustration.
Criteria That Matter
The criteria for data analytics software that actually predict success are fit to your data, usability for the people who will operate it, and connectivity to your sources — not the length of the feature list.
Evaluating data analytics software well means asking who uses it and against what data. A tool matched to your team's skills gets used; one that demands scarce expertise sits idle. Connectivity to your real sources matters more than exotic features, and honest, accessible presentation of results — aligned with guidance like the Stanford HAI AI Index — keeps outputs trustworthy. Fit to people and data beats raw capability nearly every time.
Matching Software to Need
Implementation details are commonly grounded in Google Vertex AI documentation when teams translate concepts into production practice.
Choosing data analytics software comes down to matching tool to job and skill. A team fluent in SQL against a warehouse needs query and BI tools; a team of business users needs self-service; a research team needs statistical environments.
The discipline in selecting data analytics software is to buy for the jobs you actually do, not the jobs you imagine. List the recurring analytical tasks, who performs them, and what data they touch, then match categories to those tasks. A lean, well-integrated set that your people can operate beats an impressive collection nobody fully uses, and it keeps cost and complexity proportional to the value returned.
Where the Category Came From
The category of data analytics software accumulated as each stage of analysis earned dedicated tooling. Spreadsheets brought analysis to the desktop; databases and SQL made querying rigorous; statistical packages enabled serious modeling; and BI platforms industrialized reporting for organizations.
Understanding this history clarifies why the landscape is a patchwork rather than one integrated product: each tool arose to serve a stage better than the general-purpose software of its time. It also explains why integration and skills remain the hard parts, since tools from different eras and vendors rarely connect seamlessly. The newest entrants — AI assistants — stand out precisely because they attempt to unify several historically separate stages behind one conversational interface.
Common Pitfalls
Governance and risk expectations are framed by FTC consumer protection guidance when programs need an external control reference.
The pitfalls of data analytics software begin with buying for capability the team cannot use. Powerful software demanding scarce skills becomes shelfware while people quietly revert to spreadsheets, and the investment returns nothing.
A subtler pitfall with data analytics software is neglecting the data foundation beneath it. The software analyzes whatever it is given, so no tool compensates for dirty data, undefined metrics, or disconnected sources. A further trap is chasing novelty — adopting the latest platform because it is fashionable rather than because a genuine job demands it — which layers cost and learning curves without improving the analysis. The healthiest approach keeps the toolset lean, the data governed, and every purchase tied to a real analytical need.
There is also a hidden cost in fragmented skills that teams routinely underestimate. When each analyst masters a different tool, the organization accumulates knowledge that cannot be shared, reviewed, or handed off, and a departure can strand an entire workflow that only one person understood. The remedy is not rigid standardization but a sensible default for each job, learned and documented well enough that work survives the person who created it. Treating tool choice as partly a people-and-continuity decision, rather than purely a technical one, is what keeps an analytics capability resilient as the team changes over time, and it often matters more to long-run productivity than any single tool's raw feature set.
The Category in the Age of AI
AI is reshaping data analytics software by letting users ask questions in natural language and receive analysis directly, collapsing several stages into one interface.
We explore this in what AI-native data analysis means. In the InfiniSynapse web app, an agent analyzes across your data sources and prepares, queries, and visualizes in response to a question, so data analytics software increasingly consolidates around agents that span jobs once split across many programs — while specialized tools stay valuable for deep, custom work.
Readiness Scorecard
The NIST SP 800-53 security controls adds dirty-schema realism that Spider-only leaderboards under-weight in production.
Assess your software choice (1 point each):
| Check | Pass? |
|---|---|
| It fits the jobs you actually do | |
| Intended users can operate it | |
| It connects to your data | |
| The set is lean, not sprawling | |
| The data foundation is sound | |
| Purchases tie to real needs | |
| Outputs are trustworthy | |
| An AI-native option was considered |
6–8: a well-matched choice. 3–5: revisit fit. Below 3: restart from the jobs.
Common Misconceptions
Misconception 1: The most powerful software is best. Fit to team and data wins.
Misconception 2: One product does everything. Different stages need different tools.
Misconception 3: Software fixes bad data. It analyzes whatever it is given.
Misconception 4: You must operate it manually. AI lets you ask in plain language.
Frequently Asked Questions
What is data analytics software?
It is the set of applications, languages, and environments used to prepare, query, analyze, model, and communicate data, ranging from general-purpose spreadsheets and SQL tools to specialized statistical and programming environments, business intelligence platforms, and AI-powered analysis assistants. The category is deliberately broad, and its defining reality is that no single product excels at every stage. Cleaning, precise querying, modeling, and communication are distinct jobs, so the practical aim is a well-matched set of tools rather than one product asked to do everything at once.
What are the main categories?
By the stage they serve, the categories are spreadsheets for quick preparation and small analysis, SQL and query tools for interrogating structured data, statistical and programming environments for modeling, BI platforms for repeatable reporting, and AI assistants that increasingly span stages. Each has a clear sweet spot — spreadsheets for ad-hoc work, SQL for structured data, code for bespoke modeling, BI for dashboards. Trouble arises when a tool is pushed past its sweet spot, such as modeling at scale in a spreadsheet, which reliably produces errors and frustration.
Which criteria actually matter when choosing?
Fit to your data, usability for the people who will operate the software, and connectivity to your sources predict success far better than the length of a feature list. A tool matched to your team's skills gets used, while one demanding scarce expertise sits idle. Connectivity to your real sources matters more than exotic features, and honest, accessible presentation keeps outputs trustworthy. In practice, how well a tool fits your people and your data almost always outweighs how capable it looks in a specification sheet or a polished sales demonstration.
How do I match software to my need?
Buy for the jobs you actually do, not the jobs you imagine. List the recurring analytical tasks, who performs them, and what data they touch, then map categories to those tasks. A team fluent in SQL against a warehouse needs query and BI tools; business users need self-service; a research team needs statistical environments. A lean, well-integrated set your people can operate beats an impressive collection nobody fully uses, and it keeps cost and complexity proportional to the value the analysis actually returns to the organization.
How is AI changing this category?
AI is letting users ask questions in natural language and receive analysis directly, collapsing several previously separate stages into one interface. An AI-native platform can analyze across your data sources and prepare, query, and visualize in response to a plain-language question, so the category is beginning to consolidate around agents that span jobs once split across many programs. Specialized tools remain valuable for deep, custom work, but a growing share of routine analysis is becoming something you can simply request rather than assemble by hand across several applications.
Is it different from a data analytics platform?
They overlap, but a platform usually implies a more integrated, end-to-end environment, while "software" is the broader umbrella term that includes standalone tools. A single spreadsheet or query tool is data analytics software but not a full platform; a platform typically bundles preparation, analysis, and visualization with shared governance and collaboration. In practice, many organizations combine both — standalone tools for specific jobs alongside a central platform for shared reporting. The useful question is not the label but whether a given option delivers the integration and governance your team's workflow actually requires.
Conclusion
Data analytics software spans spreadsheets, SQL, statistical environments, BI, and AI assistants, and the right choice follows your data, questions, and team skills rather than any feature ranking. In 2026, keep the toolset lean, the data foundation sound, and every purchase tied to a real need — and remember AI-native agents now let much routine analysis happen by simply asking.
Then try asking your data directly in the InfiniSynapse web app, free on registration.