Big Data Analytics Tools (2026)
By the InfiniSynapse Data Team · Last updated: 2026-07-15 · We build an AI-native data analysis platform and work with large-scale data stacks; this guide covers big data analytics tools in 2026 by category and decision, not by brand ranking.
Table of Contents
- TL;DR
- How We Approach It
- What They Are
- The Main Categories
- How the Layers Fit
- Choosing Among Them
- Where the Category Came From
- Common Pitfalls
- The Category in the Age of AI
- Readiness Scorecard
- Common Misconceptions
- Frequently Asked Questions
- Conclusion
TL;DR
Direct answer: big data analytics tools are the platforms and frameworks that store, process, and analyze data too large or fast-moving for conventional tools — spanning distributed storage, processing engines, query layers, and visualization. In 2026, choosing among big data analytics tools is less about finding the single best product and more about assembling the right layers for your data volume, velocity, and the questions you actually need answered.
Who this is for: architects and leaders evaluating big data analytics tools in 2026.
What you'll learn: what they are, the main categories, how the layers fit, how to choose, and how AI relates.
This guide sits under the data visualization hub.
For related categories, see data analytics tools.
Also see data analytics platforms.
How We Approach It
Core definitions remain usefully summarized in Wikipedia data quality overview for shared vocabulary across stakeholders.
We frame big data analytics tools by the layer each addresses, because "big data" is a stack, not a single product. Every point reflects real deployments. We anchor concepts to the OWASP API Security Top 10 and weigh patterns against the reference architectures at Python documentation.
The table below frames big data analytics tools.
| Layer | Role |
|---|---|
| Storage | Hold volume cheaply |
| Processing | Transform at scale |
| Query | Ask questions fast |
| Visualization | Communicate findings |
| Orchestration | Coordinate the pipeline |
Practical example: a team drowning in logs assembled big data analytics tools by layer — distributed storage, a processing engine, a query layer — rather than buying one platform, an approach the guidance at Wikipedia statistics overview supports.
Scope note: This guide reflects patterns we see when mid-market and enterprise teams work with big data analytics tools in 2026. It is not a substitute for legal counsel, vendor runbooks, or a formal survey of every industry — and when a smaller toolset or lighter process would serve, a full program is overkill.
What They Are
At their core, big data analytics tools are technologies built to handle data whose volume, velocity, or variety exceeds what a single machine or traditional database can manage, distributing the work across many machines.
Key Definition: big data analytics tools are the platforms, frameworks, and services designed to store, process, query, and analyze datasets too large, fast, or varied for conventional single-machine tools, typically by distributing storage and computation across clusters so that analysis remains feasible at scale.
The essence of big data analytics tools is distribution. When data outgrows one machine, these tools spread storage and processing across many, coordinating them so that querying terabytes or streaming millions of events per second becomes practical rather than impossible.
The Main Categories
Core definitions remain usefully summarized in Wikipedia data warehouse overview for shared vocabulary across stakeholders.
Big data analytics tools fall into recognizable categories: distributed storage systems, large-scale processing engines, fast query and warehouse layers, streaming platforms for real-time data, and visualization tools that turn results into understanding.
Each category within big data analytics tools solves a different scaling problem, as the reference guidance at Anthropic research illustrates. Storage systems keep enormous volumes affordable; processing engines transform them in parallel; query layers answer questions quickly; streaming tools handle data in motion; and visualization layers communicate the findings. No single tool spans all of these well, which is why real stacks combine several.
How the Layers Fit
Understanding big data analytics tools means seeing how the layers connect. Raw data lands in distributed storage; processing engines clean and transform it; a query or warehouse layer makes it fast to interrogate; and a visualization tool presents the results.
The way these layers combine among big data analytics tools varies by need, and the visualization end often relies on established tools documented at Shopify ecommerce analytics. A batch-analytics stack emphasizes storage and processing; a real-time stack adds streaming; an interactive-analysis stack leans on a fast query layer. The pipeline is only as useful as its weakest layer, so each must fit both the data and the questions being asked.
Choosing Among Them
Governance and risk expectations are framed by NIST Cybersecurity Framework when programs need an external control reference.
Choosing big data analytics tools starts from the workload, not the brand. The decisive questions are how much data you have, how fast it arrives, how quickly you need answers, and what your team can actually operate.
The discipline in selecting big data analytics tools is to resist over-engineering. Many teams reach for heavyweight distributed frameworks when their data, though large, would fit comfortably in a modern warehouse — inheriting operational complexity they do not need. Match the tool to the genuine scale of the problem, and prefer the simplest layer that handles your volume and velocity, because every added component is a cost in expertise and maintenance that recurs for as long as the stack runs.
Where the Category Came From
The category of big data analytics tools emerged in the late 2000s when web-scale companies hit data volumes that no single database could handle. Distributed frameworks appeared to spread storage and computation across commodity machines, making analysis at unprecedented scale possible and affordable.
Over time the ecosystem matured and specialized, splitting into the distinct layers we see today and increasingly moving to managed cloud services that hide the operational complexity. Understanding this history clarifies why the category is a stack rather than a product: it grew from many separate problems — storage, processing, querying, streaming — each solved by its own class of tool. It also explains the persistent over-engineering pitfall, since the frameworks born for genuine web scale are often applied to data that never needed them.
Common Pitfalls
Implementation details are commonly grounded in Stripe documentation when teams translate concepts into production practice.
The pitfalls of big data analytics tools begin with adopting them for data that is not actually big. Distributed frameworks carry real operational overhead, and applying them to merely moderate data buys complexity without benefit.
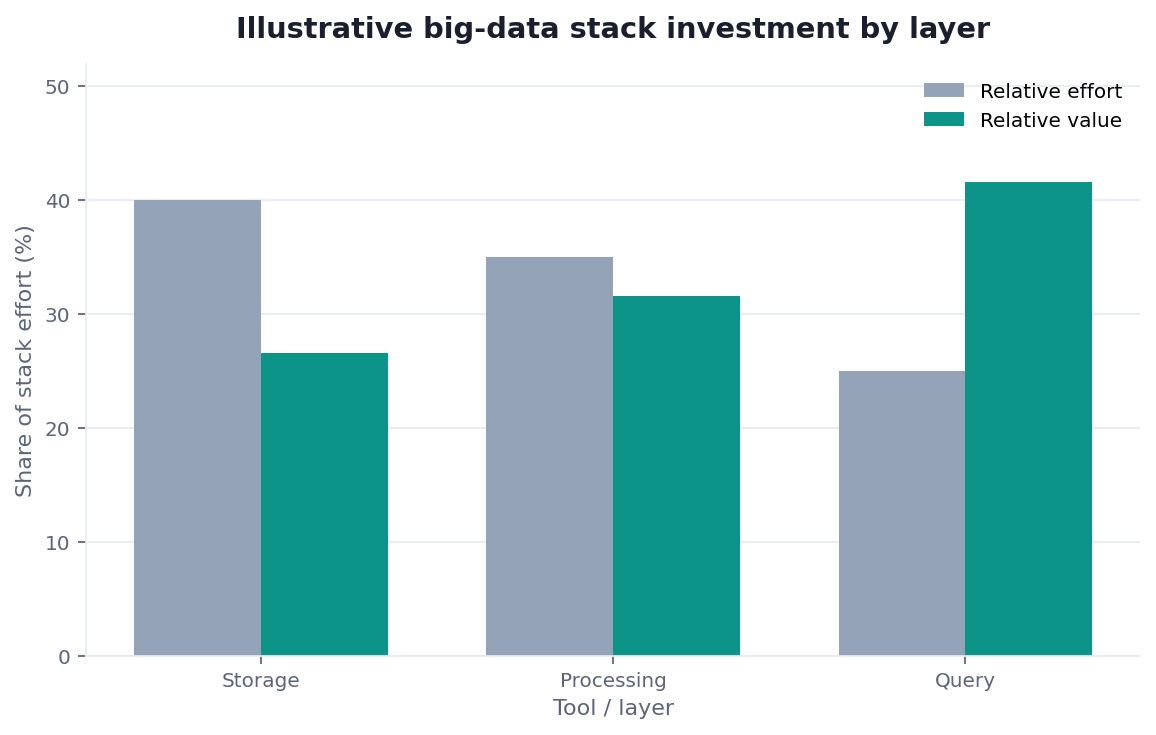
A subtler pitfall with big data analytics tools is neglecting the last mile — analysis and communication. Teams invest heavily in storage and processing, then leave the query and visualization layers as afterthoughts, so vast, well-processed data never reaches the people who need to act on it. The point of the whole stack is decisions, not storage, and a pipeline that ends in a hard-to-query data swamp has failed however impressive its scale.
A further pitfall is underestimating the ongoing operational cost of running a distributed stack. Clusters need tuning, upgrades, monitoring, and people who understand them; a framework that looked free because it was open-source can quietly consume more engineering time than a managed service would have cost. Teams frequently adopt heavyweight tooling in an early burst of enthusiasm, then discover that keeping it healthy is a standing tax on a small team that would rather be answering business questions. The realistic way to evaluate any component is to price not just the license but the human effort of operating it reliably, and to prefer managed or simpler options whenever they meet the genuine scale of the problem, reserving self-run distributed systems for the cases that truly demand them.
The Category in the Age of AI
AI is reshaping big data analytics tools by changing who can query them. Instead of specialists writing distributed jobs, analysts increasingly ask questions in natural language and let an agent generate the queries.
We explore this in what AI-native data analysis means. In the InfiniSynapse web app, zero-config federation lets an agent analyze across large sources — warehouses, lakes, and databases — without forcing everything into one framework first, so big data analytics tools become something a broader audience can interrogate directly rather than a specialist-only stack.
Readiness Scorecard
Governance and risk expectations are framed by CISA AI security guidance when programs need an external control reference.
Assess your big-data stack (1 point each):
| Check | Pass? |
|---|---|
| The data is genuinely large or fast | |
| Storage suits the volume | |
| Processing matches the workload | |
| The query layer is fast enough | |
| Visualization reaches decision-makers | |
| The stack is not over-engineered | |
| The team can operate it | |
| Federation was considered |
6–8: a well-matched stack. 3–5: simplify or fill gaps. Below 3: rebuild from the workload.
Common Misconceptions
Misconception 1: Big data tools suit any large dataset. Only genuinely big or fast data justifies them.
Misconception 2: One platform does it all. Real stacks combine layers.
Misconception 3: Storage and processing are the whole job. Query and communication decide value.
Misconception 4: Everything must be consolidated. Federation can query across sources.
Frequently Asked Questions
What are big data analytics tools?
They are platforms, frameworks, and services designed to store, process, query, and analyze datasets too large, fast, or varied for conventional single-machine tools, usually by distributing storage and computation across clusters. Their defining trait is distribution: when data outgrows one machine, they spread the work across many and coordinate it so that querying terabytes or streaming millions of events per second stays practical. They are best understood as a stack of cooperating layers rather than any single product you can buy off the shelf.
What are the main categories?
The recognizable categories are distributed storage systems that hold volume cheaply, large-scale processing engines that transform data in parallel, fast query and warehouse layers that answer questions quickly, streaming platforms that handle data in motion, and visualization tools that turn results into understanding. Each solves a different scaling problem, and no single tool spans all of them well. That is precisely why real-world stacks combine several categories, choosing one component per layer to match the shape of the data and the questions being asked.
How do the layers fit together?
Raw data lands in distributed storage; processing engines clean and transform it; a query or warehouse layer makes it fast to interrogate; and a visualization tool presents the results to people. The exact combination varies with need — a batch stack emphasizes storage and processing, a real-time stack adds streaming, and an interactive stack leans on a fast query layer. The pipeline is only as strong as its weakest layer, so each stage must fit both the data volume and the decisions the analysis is meant to support.
How should I choose among them?
Start from the workload, not the brand. Ask how much data you have, how fast it arrives, how quickly you need answers, and what your team can realistically operate. Then pick the simplest layer that handles your volume and velocity. The most common error is over-engineering — reaching for heavyweight distributed frameworks when the data would fit comfortably in a modern warehouse — because every added component is a recurring cost in expertise and maintenance. Match the tooling to the genuine scale of the problem, not to its reputation.
How does AI change big data analytics?
AI is changing who can query these systems. Rather than specialists writing distributed jobs, analysts increasingly ask questions in natural language and let an agent generate and run the queries. An AI-native platform with federation can analyze across large sources — warehouses, lakes, and databases — without forcing everything into one framework first. That widens access, so the stack becomes something a broader audience can interrogate directly, and it reduces the movement and duplication that traditionally made large-scale analysis slow and expensive to operate.
Do I need big data tools if my data fits in a warehouse?
Usually not. If your data comfortably fits and performs in a modern cloud warehouse, adding distributed big-data frameworks on top typically buys operational complexity without a matching benefit. The honest signal that you need them is a concrete limit you are actually hitting — queries that no longer finish in acceptable time, ingestion that outpaces what the warehouse can absorb, or data variety a structured system cannot model. Absent such a limit, a warehouse plus good query and visualization layers serves most organizations, and you can add heavier tooling later if genuine scale arrives.
In practice, teams evaluating big data analytics tools should judge outcomes by reliability and clarity, not by tool count alone.
When stakeholders ask for a short takeaway on big data analytics tools, start from the decision it must support and work backward.
Conclusion
Big data analytics tools are a stack — storage, processing, query, streaming, visualization — assembled to make analysis feasible at scale, and the right choice follows your volume, velocity, and questions rather than any single brand. In 2026, avoid over-engineering, invest in the query and communication layers, and remember AI-native federation lets a broader audience interrogate large data directly.
Then try federated analysis in the InfiniSynapse web app, free on registration.