Analysis of Data: Process, Steps, and Examples (2026)
By the InfiniSynapse Data Team · Last updated: 2026-07-08 · We build an AI-native data analysis platform; this guide frames the analysis of data as the active process it truly is, grounded in real practice.
Table of Contents
- TL;DR
- Framing It as a Process
- The Steps Involved
- Common Approaches
- A Worked Example
- Where It Goes Wrong
- How AI Performs It
- Iterating on the Analysis
- Communicating the Results
- Process Scorecard
- Common Mistakes
- Frequently Asked Questions
- Conclusion
TL;DR
Direct answer: the analysis of data is the active process of working through data, step by step, to extract meaning. It moves from a question, through gathering and cleaning, to examination and interpretation, and ends in a communicated conclusion. Framing it as a process, rather than a thing, is the key to doing it well.
Who this is for: anyone wanting to understand the analysis of data as a concrete, repeatable activity.
What you'll learn: how to frame it as a process, the steps involved, common approaches, a worked example, and how AI now performs it.
For the broader discipline, see the complete data analysis guide; for the steps in depth, see the data analysis process.
For related depth in this pillar, see Data Analysis Methods and 7 Data Analysis Examples by Industry.
Framing It as a Process
The most useful way to understand the analysis of data is to frame it as a verb rather than a noun, an active process rather than a static thing. People sometimes speak of "the analysis" as if it were an object, but the analysis of data is really something you do: a sequence of deliberate steps that transform raw information into understanding.
This framing matters because it directs attention to how the work is performed, which is where quality lives. A good analysis follows a disciplined process; a poor one skips steps or proceeds haphazardly. Seeing it as a process, consistent with the Wikipedia overview of data analysis, reveals that the outcome depends on the method, and that improving your results means improving the process you follow rather than hoping for a better outcome by chance. Dashboard-centric workflows sit within the broader Wikipedia business intelligence overview.
The Steps Involved
The analysis of data proceeds through a recognizable sequence of steps. It begins with a clear question, because the analysis of data without a question is aimless wandering. Next comes gathering the relevant data, then cleaning it to ensure the analysis rests on trustworthy input, a step that often consumes the most effort.
With clean data in hand, the work moves to examination: calculating summaries, comparing groups, and looking for patterns that bear on the question. Then comes interpretation, judging what the patterns mean and whether they make sense, followed by communication of the conclusion. We detail each step in the data analysis process. This sequence holds whether the analysis of data is a quick spreadsheet task or a complex multi-source study, and following it deliberately is what separates reliable work from confident guessing.
Common Approaches
The analysis of data can take several approaches depending on the question. A descriptive approach summarizes what the data shows, answering what happened. A diagnostic approach digs into why, exploring causes and relationships. These two cover the majority of everyday analysis of data in business and research.
More advanced approaches include predictive analysis, which uses patterns to forecast, and prescriptive analysis, which recommends actions. We explore these in types of data analysis. The right approach depends on the question, and a common error is applying a complex predictive approach when a simple descriptive one would answer the question better and faster with far less risk of overreach. Matching the approach to the question is a core skill, because the most sophisticated method is not the best one unless the question actually calls for it.
A Worked Example
A concrete example grounds the analysis of data. Suppose an online store wants to know why refunds rose last quarter. The question is clear. They gather refund records, order data, and product details, then clean the data, discovering that some refund reasons were recorded inconsistently and standardizing them.
With clean data, the analysis of data proceeds: they group refunds by product and reason, and calculate rates over time. The examination reveals that one product's refunds spiked, and the dominant reason was "item not as described." Interpreting this, they conclude the product's listing is misleading, and they communicate a recommendation to fix it. This worked example shows the analysis of data as a complete process, from question to actionable conclusion, and illustrates how each step builds on the last to produce an answer the business can act on immediately. Enterprise adoption patterns in Google Cloud's AI overview mirror the shift from pilots to governed analytics.
Where It Goes Wrong
The analysis of data goes wrong in predictable ways, and knowing them helps you avoid them. The most common failure is skipping the cleaning step, performing the analysis of data on dirty input and reaching confident but wrong conclusions. Duplicates, inconsistent categories, and unhandled missing values all corrupt results silently.
A second failure in the analysis of data is starting without a clear question, which produces aimless exploration that yields no actionable answer. A third is confirmation bias, where the analyst looks only for data that supports a preconceived conclusion, undermining the whole point of letting evidence guide the answer. A fourth is over-complicating the method when a simple analysis of data would suffice. Each of these failures traces back to abandoning the disciplined process, which is why following the steps deliberately is the best protection against a misleading result.
How AI Performs It
In 2026, the analysis of data is increasingly performed by AI-native agents that automate the mechanical steps. Where a person once had to write every query and clean every column by hand, an agent can now take a goal in plain language, plan the steps, and carry out the analysis of data autonomously, returning a result with an inspectable trail.
InfiniSynapse exemplifies this. It is not an NLP2SQL box or a ChatBI widget but a system that behaves like a professional data analyst, connecting to sources with one-click authorization and performing multi-step analysis of data through InfiniSQL. This automates the gathering, cleaning, and examination that once consumed most of the effort, while leaving the human to frame the question and judge the result. We explore the paradigm in what AI-native data analysis means), and the Stanford HAI AI Index documents how quickly this capability matured. The process stays the same; what changes is how much of the analysis of data a machine can now carry.
Iterating on the Analysis
Real work rarely proceeds in a clean straight line, and understanding this saves beginners much frustration. A first pass often raises new questions or reveals that the original question was not quite the right one. Perhaps the refund spike turns out to concentrate in a single region, prompting a follow-up on why that region differs. Good practice treats each conclusion as a potential starting point for the next inquiry rather than a final full stop, looping back through the steps with a refined question.
This iterative character is a feature, not a flaw. Each cycle sharpens understanding, and the willingness to revisit and refine distinguishes thorough work from a superficial single pass. The discipline is to iterate deliberately, updating the question and re-running the relevant steps, rather than wandering aimlessly through the data. Skilled practitioners hold both threads at once: the structure of a defined process and the openness to let findings reshape the question. Embracing iteration, while keeping it disciplined, is what turns a one-time exercise into genuine, deepening insight over time. The move toward augmented workflows, outlined in IBM's augmented analytics overview, frames how teams evaluate modern tooling.
Communicating the Results
The final step deserves more attention than it usually gets, because a conclusion that is never clearly communicated changes nothing. Communicating results well means leading with the takeaway rather than burying it under method, choosing a chart that clarifies rather than decorates, and stating what the finding implies for a decision. The audience should grasp the point quickly and trust how it was reached.
Effective communication also means honesty about uncertainty and limitations. A responsible presentation notes what the data can and cannot support, what assumptions were made, and where the conclusion might be wrong. This candor builds trust and prevents others from overreaching on a finding. In many settings, the communication is what stakeholders actually experience of the entire effort, so investing in a clear, honest, decision-oriented message is not an afterthought but a core part of the work. The best insight in the world is wasted if it cannot be conveyed in a way that moves someone to act wisely.
Process Scorecard
Assess your analysis process (1 point each):
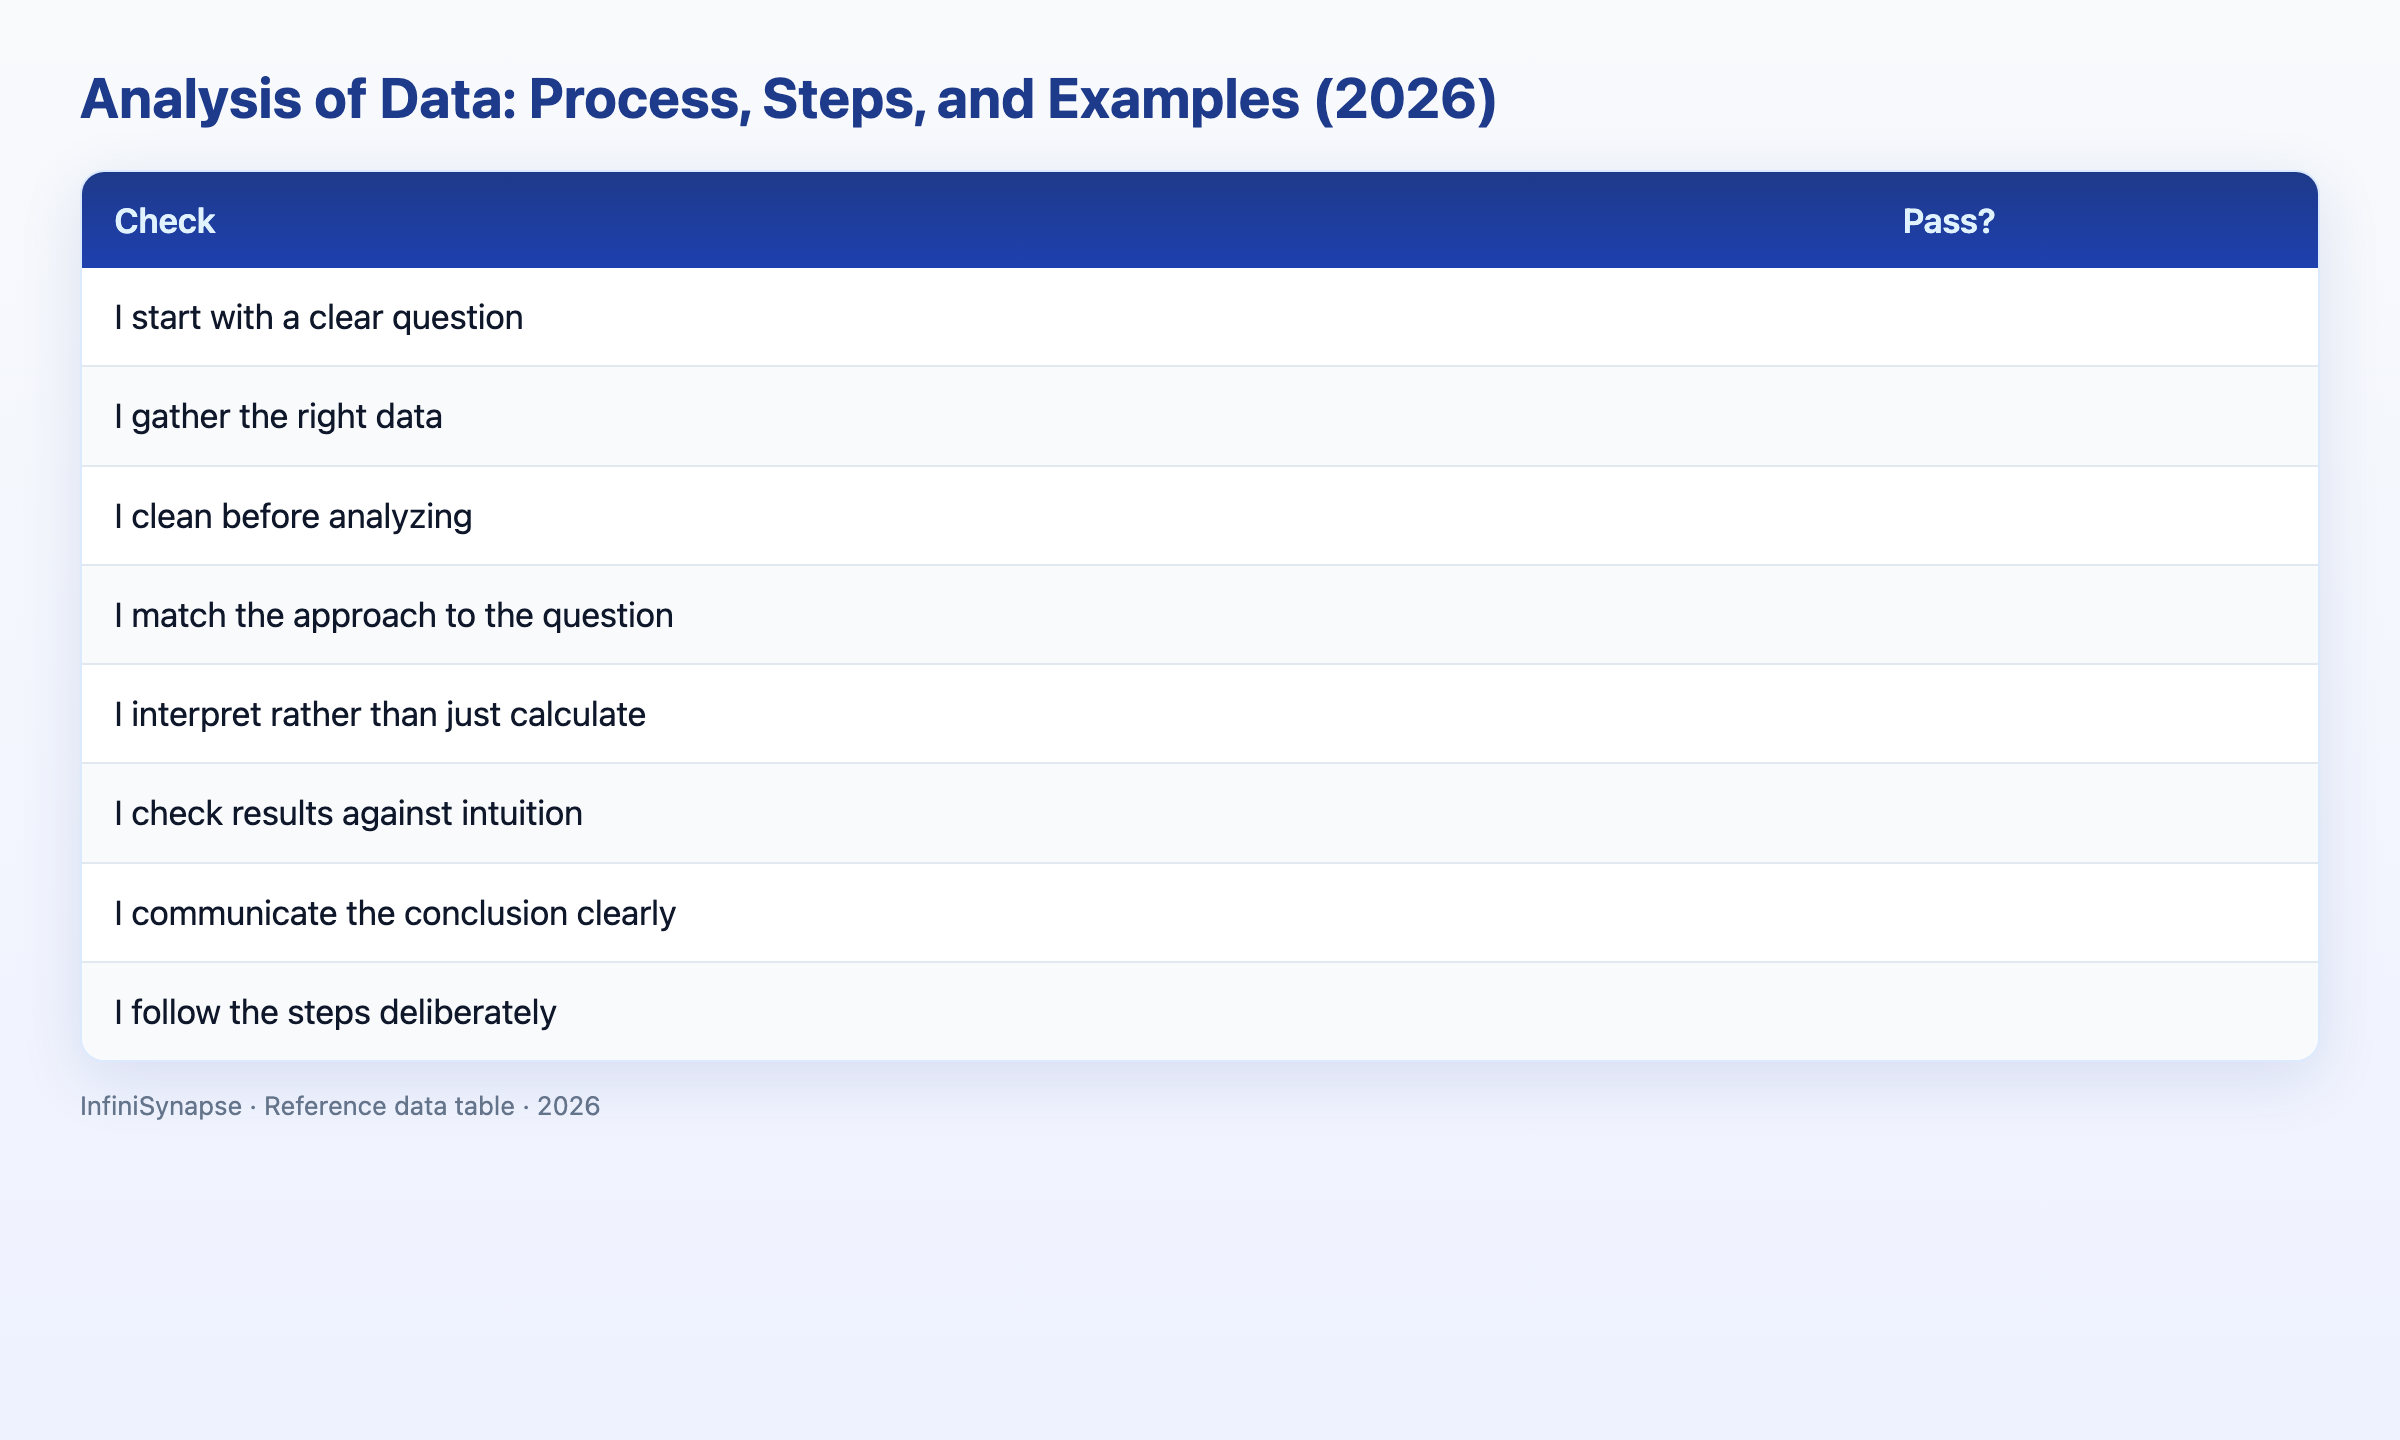
| Check | Pass? |
|---|---|
| I start with a clear question | |
| I gather the right data | |
| I clean before analyzing | |
| I match the approach to the question | |
| I interpret rather than just calculate | |
| I check results against intuition | |
| I communicate the conclusion clearly | |
| I follow the steps deliberately |
6–8: a disciplined process. 3–5: reinforce a step. Below 3: revisit the sequence.
Common Mistakes
Mistake 1: Skipping cleaning. Performing the analysis of data on dirty input yields confident but wrong results.
Mistake 2: No clear question. The analysis of data without a question wanders aimlessly.
Mistake 3: Confirmation bias. Seeking only supporting data undermines the whole process.
Mistake 4: Over-complicating. A complex method where a simple one suffices wastes effort.
Frequently Asked Questions
What is the analysis of data?
The analysis of data is the active process of working through data, step by step, to extract meaning and answer a question. It moves from a clear question through gathering and cleaning to examination and interpretation, ending in a communicated conclusion. Framing it as a process rather than a static thing is key to doing it well.
What are the steps in the analysis of data?
The analysis of data proceeds through defining a clear question, gathering the relevant data, cleaning it into trustworthy form, examining it to find patterns, interpreting what those patterns mean, and communicating the conclusion. This sequence applies whether the analysis is a quick spreadsheet task or a complex multi-source investigation.
What approaches can the take?
The analysis of data can take descriptive (what happened), diagnostic (why it happened), predictive (what will happen), and prescriptive (what to do) approaches. Descriptive and diagnostic cover most everyday work, while predictive and prescriptive require more advanced methods. The right approach depends on the question being asked.
What commonly goes wrong in the ?
The analysis of data commonly goes wrong by skipping the cleaning step and analyzing dirty data, starting without a clear question, falling into confirmation bias by seeking only supporting evidence, or over-complicating the method. Each failure traces back to abandoning the disciplined process, so following the steps protects against misleading results.
How do \1teams proceed\2?
AI-native tools perform the analysis of data by taking a goal in plain language, planning the steps, and carrying out the gathering, cleaning, and examination autonomously, returning a result with an inspectable trail. This automates the mechanical effort while leaving humans to frame the question and judge the result, keeping the process the same but faster.
Conclusion
The analysis of data is best understood as an active, disciplined process: question, gather, clean, examine, interpret, communicate. Following the steps deliberately protects against the common failures, and in 2026, AI-native agents can carry much of the process while humans supply the questions and judgment. Whether performed by a person in a spreadsheet or an agent across many sources, the same disciplined sequence produces trustworthy answers, and abandoning it produces confident mistakes no matter how powerful the tool. Master the underlying process first, and the modern tools become genuine force multipliers rather than crutches you lean on blindly.
To see the process performed by modern tools, read the complete data analysis guide and what AI-native data analysis means), then try the InfiniSynapse web app free on registration.