
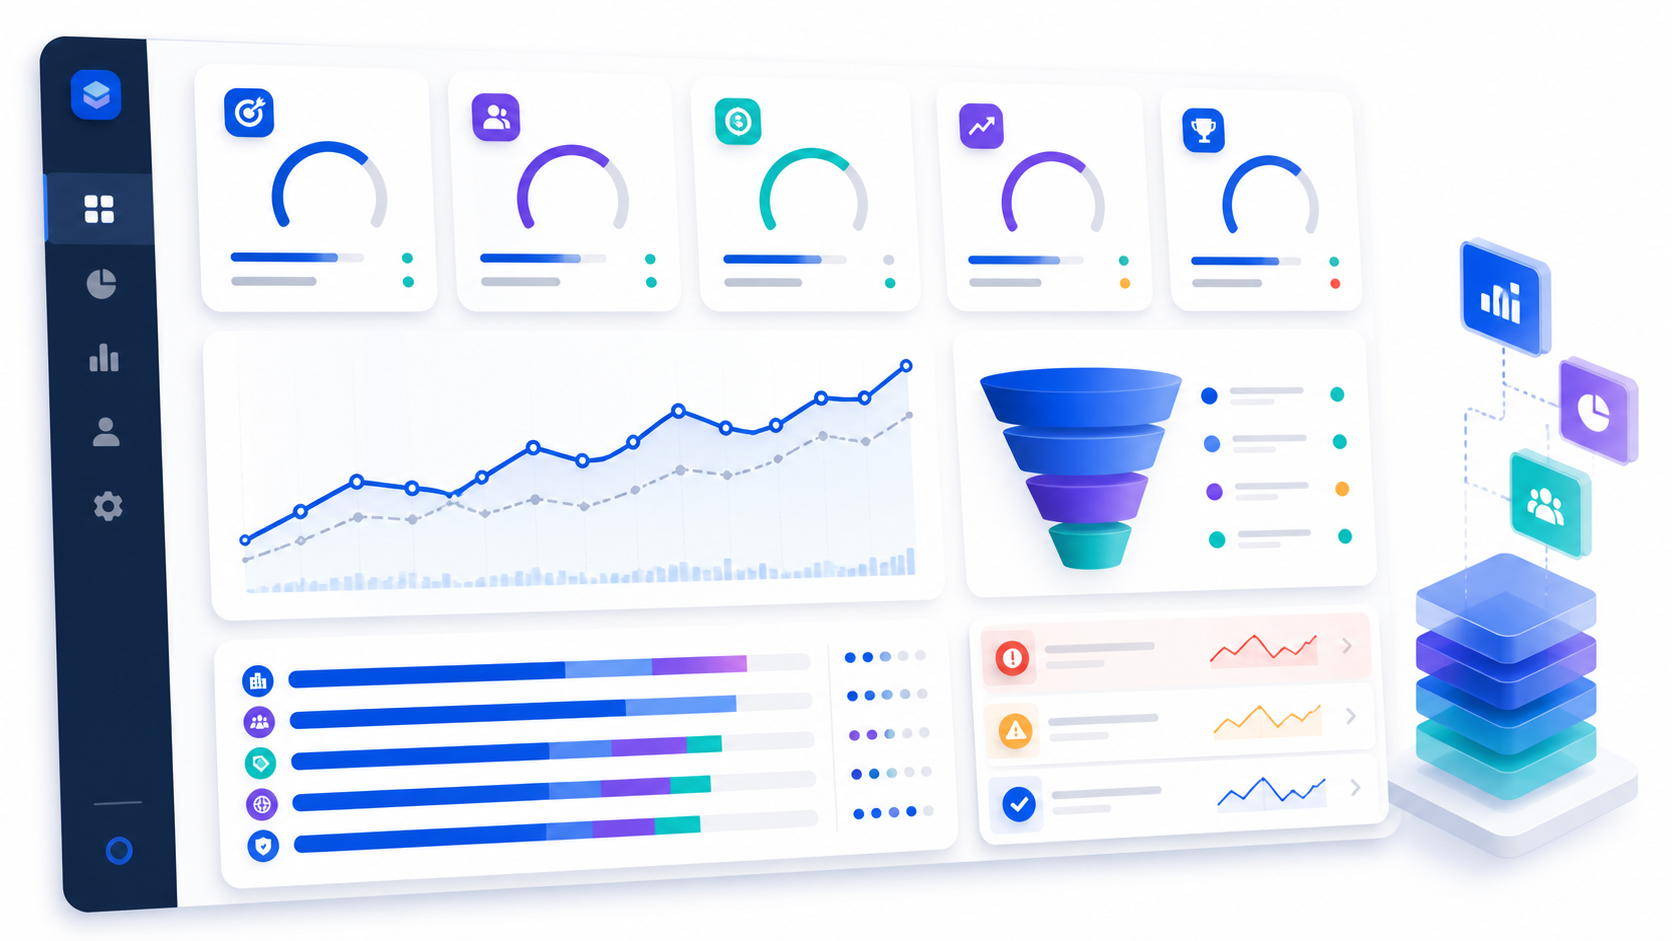
What Is a Sales Performance Dashboard?什么是销售绩效仪表板?
A sales performance dashboard is a governed visual workspace that compares sales outcomes and leading indicators with targets, prior periods, and relevant segments so a defined audience can decide what to review or change. It should expose the metric definition, time window, data freshness, sample size, and drill-through evidence—not only display charts.
销售绩效仪表板是一个受治理的可视化工作区,它把销售结果和领先指标与目标、历史期间及相关分群比较,帮助明确的受众决定需要复核或改变什么。它不仅展示图表,还应说明指标定义、时间窗、数据新鲜度、样本量和可下钻证据。
A useful dashboard is tied to a decision cadence: a rep's daily review, a manager's weekly pipeline inspection, a monthly performance review, or an executive forecast meeting. These audiences need different levels of detail. One overloaded page rarely serves all of them well.
有效仪表板应连接到明确的决策节奏,例如销售人员每日检查、经理每周管道复盘、月度绩效会议或高管预测会议。这些受众需要不同细节层级;一个过度拥挤的页面通常无法同时服务所有人。
Monitors a compact set of defined measures, comparisons, exceptions, and drill paths for repeated decisions.
为反复决策监控一组精简且已定义的指标、比较、异常和下钻路径。
May provide a broader historical record, detailed tables, commentary, or one-time analysis without continuous monitoring.
可能提供更广泛的历史记录、明细表、评论或一次性分析,而不承担持续监控。
Start With the Audience and Decision Question从受众和决策问题开始
Before choosing KPIs, write the audience, decision, cadence, population, owner, and action window. “Build a sales dashboard” is not a sufficient brief. “Help regional managers identify quota risk and pipeline gaps every Monday before coaching meetings” is specific enough to determine content.
选择 KPI 之前,应写明受众、决策、节奏、业务对象、负责人和行动时间窗。“制作销售仪表板”不是充分简报;“帮助区域经理在每周一辅导会议前识别配额风险和管道缺口”则足以决定内容。
| Audience受众 | Primary question主要问题 | Typical cadence常见节奏 | Required action所需行动 |
|---|---|---|---|
| Sales representative销售人员 | Which opportunities and activities need attention now?哪些商机和活动现在需要关注? | Daily每日 | Update, follow up, qualify, or escalate更新、跟进、资格判定或升级 |
| Sales manager销售经理 | Where are target, pipeline, conversion, and coaching risks?目标、管道、转化和辅导风险在哪里? | Weekly每周 | Inspect deals, coach, rebalance, or remove blockers检查交易、辅导、重新分配或消除阻碍 |
| RevOpsRevOps | Are definitions, process, coverage, and forecasts reliable?定义、流程、覆盖和预测是否可靠? | Weekly / monthly每周 / 每月 | Correct data, process, model, or governance纠正数据、流程、模型或治理 |
| Executive / finance高管 / 财务 | Will revenue meet plan, and what explains the variance?收入能否达到计划,偏差由什么解释? | Monthly / quarterly每月 / 每季度 | Adjust forecast, capacity, investment, or plan调整预测、产能、投入或计划 |
Reusable Sales Performance Dashboard Template可复用的销售绩效仪表板模板
Use this one-page blueprint before selecting charts. Each zone should answer a different level of the review: status, change, location, explanation, and action. If a component does not affect a named decision, move it to a detail report.
选择图表前,可先使用这一页式蓝图。每个区域分别回答复盘中的不同层级:状态、变化、位置、解释和行动。如果某组件不影响明确决策,应把它移到明细报告。
| Dashboard zone仪表板区域 | What to show展示内容 | Required context必要背景 |
|---|---|---|
| 1. Scope bar1. 范围栏 | Period, team, region, product, segment, currency, refresh time期间、团队、区域、产品、分群、币种、刷新时间 | Visible active filters and reset state可见的当前筛选和重置状态 |
| 2. Outcome strip2. 结果指标条 | Revenue, target attainment, closed-won value, forecast variance收入、目标达成、成交金额、预测偏差 | Actual, target, variance, comparison, and status rule实际值、目标、偏差、比较和状态规则 |
| 3. Trend and target3. 趋势与目标 | Performance over time with plan or comparable prior period随时间变化的表现,并加入计划或可比上期 | Consistent calendar, target version, and annotation一致日历、目标版本和事件注释 |
| 4. Pipeline mechanics4. 管道机制 | Coverage, stage movement, win rate, cycle, age, slippage覆盖、阶段流转、赢率、周期、老化、延期 | Cohort rules, stage history, and denominatorCohort 规则、阶段历史和分母 |
| 5. Segment breakdown5. 分群拆解 | Product, region, source, customer, deal band, or representative产品、区域、来源、客户、交易区间或销售人员 | Contribution, rate, volume, and minimum sample flag贡献、比例、样本量和最低样本标记 |
| 6. Exceptions and action6. 异常与行动 | Material gaps, stale records, risks, owners, due dates重大缺口、陈旧记录、风险、负责人、截止日期 | Drill-through evidence and workflow link下钻证据和工作流链接 |
Template rule: a KPI card needs a value, definition, comparison, variance, status rule, and drill path. A large number without these elements is decoration, not a decision control.
模板规则:KPI 卡片需要数值、定义、比较、偏差、状态规则和下钻路径。缺少这些元素的大号数字只是装饰,而不是决策控制。
Core Sales Dashboard KPIs and Formulas销售仪表板核心 KPI 与公式
Select a small set that covers outcomes, target progress, pipeline capacity, conversion, and timing. The following definitions are common starting points, not universal contracts. Record grain, filters, source, time basis, currency, owner, and exception handling for every measure.
选择一组精简指标,覆盖结果、目标进度、管道产能、转化和时点。以下定义是常见起点,而不是通用契约。每项指标都应记录粒度、筛选、数据源、时间依据、币种、负责人和异常处理。
| KPIKPI | Example calculation示例计算 | Control question控制问题 |
|---|---|---|
| Revenue收入 | Sum of eligible booked or recognized revenue符合口径的签约或确认收入之和 | Are bookings and recognized revenue separated?签约收入与确认收入是否分开? |
| Quota attainment配额达成率 | Credited actual ÷ assigned quota × 100计入业绩 ÷ 分配配额 × 100 | Are territory and ramp changes time-aware?区域与入职爬坡变化是否按时间处理? |
| Win rate赢率 | Won ÷ (won + lost eligible opportunities) × 100成交 ÷(成交 + 失败合格商机)× 100 | Are open opportunities excluded and cohorts comparable?未关闭商机是否排除,Cohort 是否可比? |
| Average deal value平均交易金额 | Closed-won value ÷ won deals成交金额 ÷ 成交单数 | Are currency and outliers handled?币种和异常值是否处理? |
| Pipeline coverage管道覆盖率 | Eligible pipeline value ÷ remaining target合格管道金额 ÷ 剩余目标 | Can value close inside the target window?金额能否在目标时间窗内成交? |
| Sales cycle length销售周期 | Defined close event − defined start event规定关闭事件 − 规定起始事件 | Are start events and unresolved deals explicit?起始事件和未决交易是否明确? |
| Forecast variance预测偏差 | Actual − frozen forecast, with signed percentage实际值 − 冻结预测值,并保留方向百分比 | Is forecast history preserved?是否保留历史预测版本? |
Sales Dashboard Data Fields Template销售仪表板数据字段模板
For opportunity-led sales, keep one opportunity table plus event-level stage history, targets, ownership history, and a calendar. Add billing or order data when the dashboard must reconcile pipeline outcomes with authoritative revenue. Avoid joining activity, product, and invoice rows directly to opportunities before aggregation; one-to-many joins can multiply values.
对于商机驱动的销售,应保留一张商机表,并配套事件级阶段历史、目标、负责人历史和日历。当仪表板需要把管道结果与权威收入核对时,再加入账单或订单数据。不要在聚合前把活动、产品和发票行直接连接到商机,否则一对多连接可能放大数值。
Opportunity ID, account, owner, territory, source, product, stage, amount, currency, created, expected close, actual close, outcome, and loss reason.
商机 ID、客户、负责人、区域、来源、产品、阶段、金额、币种、创建时间、预计关闭、实际关闭、结果和失败原因。
Stage entry and exit, amount changes, forecast category, snapshot time, quota owner, effective dates, target, plan version, and credit rule.
阶段进入与退出、金额变化、预测类别、快照时间、配额负责人、生效日期、目标、计划版本和业绩归属规则。
Order or invoice ID, booked and recognized value, product, customer, currency rate, return, discount, margin, marketing source, and relevant usage signals.
订单或发票 ID、签约与确认金额、产品、客户、汇率、退货、折扣、毛利、营销来源和相关使用信号。
Source system, source timestamp, metric version, record status, data owner, quality flag, exclusion reason, refresh result, and lineage link.
数据源系统、源时间戳、指标版本、记录状态、数据负责人、质量标记、排除原因、刷新结果和血缘链接。
How to Build a Sales Performance Dashboard如何构建销售绩效仪表板
- Define the decision contract.定义决策契约。
Write audience, question, cadence, population, action, owner, due window, and what must be visible before a decision is allowed.
写明受众、问题、节奏、业务对象、行动、负责人、截止时间窗,以及决策前必须可见的内容。
- Inventory sources and grain.盘点数据源与粒度。
Identify authoritative systems, business keys, update timing, history, permissions, missing fields, and one-to-many relationships.
识别权威系统、业务主键、更新时间、历史、权限、缺失字段和一对多关系。
- Approve metric contracts.批准指标契约。
Record formula, numerator, denominator, grain, filters, cohort, currency, time zone, owner, target version, and exceptions.
记录公式、分子、分母、粒度、筛选、Cohort、币种、时区、负责人、目标版本和异常。
- Create a low-fidelity layout.创建低保真版式。
Place scope, outcomes, trend, pipeline mechanics, segment breakdown, and exceptions before styling. Remove components without decisions.
在视觉设计前放置范围、结果、趋势、管道机制、分群拆解和异常,并删除不服务决策的组件。
- Model and reconcile.建模并核对。
Deduplicate keys, normalize currency, preserve history, test joins, calculate measures, and compare totals with CRM and finance controls.
去重主键、统一币种、保留历史、检验连接、计算指标,并与 CRM 和财务控制总数核对。
- Test with real review scenarios.使用真实复盘场景测试。
Ask intended users to locate a material gap, explain it, drill to records, assign an action, and recover from a failed refresh or filter.
让目标用户定位重大缺口、解释原因、下钻记录、分配行动,并从刷新或筛选失败中恢复。
- Operate and improve.运行并改进。
Monitor freshness, quality, usage, decision outcomes, metric changes, access, and unresolved exceptions. Retire views that no longer serve a decision.
监控新鲜度、质量、使用、决策结果、指标变化、访问和未解决异常,并停用不再服务决策的视图。
Sales Dashboard Examples by Use Case按使用场景划分的销售仪表板示例
Revenue versus plan, forecast and variance, pipeline coverage, segment contribution, major risks, confidence, and decisions required. Keep operational activity off the first page.
展示收入与计划、预测与偏差、管道覆盖、分群贡献、重大风险、置信程度和所需决策;首页不放运营活动明细。
Quota progress, coverage, stage movement, win rate, cycle, slippage, aging, forecast changes, representative segments, and coaching exceptions.
展示配额进度、覆盖、阶段流转、赢率、周期、延期、老化、预测变化、销售人员分群和辅导异常。
Personal target progress, open opportunities, next steps, stale records, close timing, risk evidence, activities due, and controllable actions.
展示个人目标进度、未关闭商机、下一步、陈旧记录、成交时点、风险证据、到期活动和可控行动。
Source freshness, missing owners or dates, stage reversals, duplicates, reopened deals, forecast versions, target assignments, exclusions, and reconciliation gaps.
展示数据源新鲜度、缺失负责人或日期、阶段回退、重复、重开交易、预测版本、目标分配、排除项和核对差异。
Choose the Right Sales Dashboard Tool选择合适的销售仪表板工具
Choose from the operating requirement, not chart count. Evaluate connection depth, historical snapshots, semantic modeling, row-level security, refresh, drill-through, collaboration, export, version control, administration, accessibility, total cost, and exit options.
应从运行需求出发,而不是按图表数量选型。评估连接深度、历史快照、语义建模、行级安全、刷新、下钻、协作、导出、版本控制、管理、无障碍、总成本和退出选项。
| Approach方式 | Best fit适合场景 | Main strength主要优势 | Boundary边界 |
|---|---|---|---|
| Spreadsheet template电子表格模板 | Small exports, prototypes, and manual reviews小型导出、原型和手工复盘 | Flexible and inspectable灵活且易检查 | Refresh, access, lineage, and version drift刷新、访问、血缘和版本漂移 |
| CRM-native dashboardCRM 原生仪表板 | Operational reviews using one CRM使用单一 CRM 的运营复盘 | Close to workflow and records贴近工作流和记录 | Cross-source and financial context跨源与财务背景 |
| BI platformBI 平台 | Governed recurring dashboards across sources跨源且受治理的周期性仪表板 | Reusable models, permissions, and distribution可复用模型、权限和分发 | Modeling, maintenance, and analyst capacity建模、维护和分析师产能 |
| Cross-source AI analysis layer跨源 AI 分析层 | Iterative questions across databases, warehouses, and files跨数据库、数据仓库和文件的迭代问题 | Natural-language exploration and flexible analysis自然语言探索和灵活分析 | Outputs still need governance and validation输出仍需要治理和验证 |
Design the Dashboard for Accurate Interpretation为准确解读设计仪表板
- Show comparisons: place actual beside target or a truly comparable prior period; show the signed variance and unit.展示比较:把实际值与目标或真正可比的历史期间并列,并展示带方向的偏差和单位。
- Match chart to question: use lines for time, bars for category comparison, tables for exact exceptions, and funnels only for valid stage cohorts.图表匹配问题:时间使用折线,类别比较使用条形,精确异常使用表格,漏斗只用于有效阶段 Cohort。
- Do not rely on color: pair status color with labels, symbols, variance values, or patterns. Use consistent direction so “good” is not sometimes up and sometimes down without explanation.不要只依赖颜色:状态颜色应配合标签、符号、偏差数值或纹理。保持方向一致,避免“向上为好”和“向下为好”在无解释时混用。
- Keep scope visible: display active filters, time zone, currency, refresh timestamp, target version, and excluded population.保持范围可见:展示当前筛选、时区、币种、刷新时间戳、目标版本和排除对象。
- Support details on demand: users should move from headline to segment to record while preserving filter context and a clear path back.按需提供细节:用户应能从总体指标进入分群和记录,并保留筛选背景和清晰返回路径。
For a broader set of dashboard design principles, see the InfiniSynapse guide to a decision-focused data dashboard.
关于更完整的仪表板设计原则,可参阅 InfiniSynapse 的面向决策的数据仪表板指南。
Worked Sales Dashboard Review Example销售仪表板复盘示例
Hypothetical example: a manager sees quarterly attainment below plan while closed opportunity win rate remains stable. The dashboard shows adequate total pipeline value, but the amount expected to close inside the quarter is concentrated in a few large, late-stage opportunities. Stage history shows increased slippage, and the exception table identifies missing next steps on two material deals.
假设示例:某经理发现季度达成低于计划,但已关闭商机赢率保持稳定。仪表板显示总体管道金额足够,但预计在季度内成交的金额集中在少数大型后期商机。阶段历史显示延期增加,异常表还识别出两笔重大交易缺少下一步。
The observed facts are attainment gap, concentration, slippage, and missing records. “Buyer engagement weakened” is only a hypothesis until supported by interaction or stakeholder evidence. The action may be to review the named deals, validate close criteria, correct missing data, and run a downside forecast. The next review should check whether close evidence changed—not merely whether the dashboard was opened.
已观察事实是达成缺口、集中度、延期和缺失记录。“买方互动减弱”仍只是假设,除非互动或利益相关者证据支持它。行动可以是复核指定交易、验证成交标准、纠正缺失数据并运行下行情景预测。下一次复盘应检查成交证据是否变化,而不只是仪表板是否被打开。
Validate the Dashboard Before Sharing It分享前验证销售仪表板
- Reconcile totals: match opportunities with CRM controls and booked or recognized revenue with the authoritative finance source.核对总数:将商机与 CRM 控制核对,将签约或确认收入与权威财务数据源核对。
- Test joins: compare row and distinct-key counts before and after stage, activity, product, account, order, and invoice joins.检验连接:比较连接阶段、活动、产品、客户、订单和发票前后的行数与去重主键数。
- Inspect exclusions: quantify deleted, duplicate, reopened, zero-value, missing-owner, test, and unresolved records.检查排除项:量化删除、重复、重开、零金额、缺负责人、测试和未决记录。
- Test time travel: verify that historical stage, amount, owner, quota, target, and forecast views do not silently use current values.检验历史时点:确保历史阶段、金额、负责人、配额、目标和预测视图不会静默使用当前值。
- Test access and usability: verify row-level permissions, keyboard use, contrast, labels, table scrolling, export, filter reset, and failed-refresh behavior.检验访问与可用性:验证行级权限、键盘使用、对比度、标签、表格滚动、导出、筛选重置和刷新失败行为。
- Preserve evidence: retain source timestamps, metric versions, query or model versions, refresh logs, approvals, and next review dates.保留证据:保留数据源时间戳、指标版本、查询或模型版本、刷新日志、批准和下次复核日期。
Analyze Sales Performance With InfiniSynapse使用 InfiniSynapse 分析销售绩效
When dashboard evidence is distributed across connected databases, warehouses, and files, InfiniSynapse can support iterative analysis over governed sources. Prepare the decision question, table owners, business keys, metric contracts, permissions, expected totals, time zone, currency rules, and validation criteria before beginning.
当仪表板证据分散在已连接数据库、数据仓库和文件中时,InfiniSynapse 可以支持基于受治理数据源的迭代分析。开始前应准备决策问题、表负责人、业务主键、指标契约、权限、预期总数、时区、币种规则和验证标准。
Use natural language to investigate outcomes, targets, pipeline mechanics, and segments across connected sources, then validate fields, joins, filters, formulas, exclusions, and outputs before acting. InfiniSynapse is not a CRM, dashboard distribution system, or sales execution platform and does not update opportunity stages or assign work.
使用自然语言跨已连接数据源调查结果、目标、管道机制和分群,并在行动前验证字段、连接、筛选、公式、排除项和输出。InfiniSynapse 不是 CRM、仪表板分发系统或销售执行平台,也不更新商机阶段或分配工作。
Try cross-source sales analysis体验跨源销售分析Common Sales Dashboard Mistakes常见销售仪表板错误
Every available metric is placed on one page, so hierarchy and required decisions disappear.
把所有可用指标放在一页,导致层级和所需决策消失。
Stage, revenue, target, quota, or win-rate rules change between periods without versioning.
阶段、收入、目标、配额或赢率规则在期间间变化,却没有版本记录。
Current owner, amount, stage, and forecast are used to reconstruct past performance after values were overwritten.
数值被覆盖后,仍使用当前负责人、金额、阶段和预测重建历史表现。
Color and rankings imply judgment without a target, confidence, sample size, explanation, or action rule.
颜色和排名在缺少目标、置信程度、样本量、解释或行动规则时暗示判断。
Sales Performance Dashboard FAQ销售绩效仪表板常见问题
It is a governed visual workspace that compares sales outcomes and leading indicators with targets, prior periods, and segments so a defined audience can review exceptions and make repeated decisions.
它是一个受治理的可视化工作区,把销售结果和领先指标与目标、历史期间及分群比较,帮助明确受众复核异常并进行反复决策。
Start with revenue, target or quota attainment, forecast variance, win rate, average deal value, pipeline coverage, and sales cycle, then keep only the measures required for the audience's decision.
可从收入、目标或配额达成、预测偏差、赢率、平均交易金额、管道覆盖率和销售周期开始,再只保留受众决策所需指标。
Include visible scope and freshness, an outcome strip, trend versus target, pipeline mechanics, relevant segments, exceptions, owners, drill-through evidence, metric definitions, and a validation or refresh status.
应包括可见范围和新鲜度、结果指标条、趋势与目标、管道机制、相关分群、异常、负责人、下钻证据、指标定义以及验证或刷新状态。
Refresh should match the decision and source latency. Daily operational views may need frequent updates, while monthly finance-aligned performance should prioritize reconciled and frozen data over speed. Always show the source timestamp.
刷新频率应匹配决策与数据源延迟。每日运营视图可能需要频繁更新,而与财务一致的月度绩效应优先使用已核对和冻结的数据,而不是追求速度。必须展示数据源时间戳。
Usually not as one overloaded page. Use a shared metric layer with role-specific views and drill paths so definitions remain consistent while decision depth, access, and cadence differ.
通常不应放在一个过度拥挤的页面中。应使用共享指标层配合角色化视图和下钻路径,使定义保持一致,同时允许决策深度、访问和节奏不同。
No universal replacement claim should be made. InfiniSynapse supports analysis across connected databases, warehouses, and files, but it does not replace CRM execution or the governance, distribution, and operational functions of a dedicated dashboard platform.
不能一概而论。InfiniSynapse 支持跨已连接数据库、数据仓库和文件的分析,但不替代 CRM 执行,也不替代专用仪表板平台的治理、分发和运营功能。