Microsoft Office Excel Data Analysis: 2026 Walkthrough
By the InfiniSynapse Data Team · Last updated: 2026-07-08 · We build an AI-native data analysis platform and work with Office-based teams constantly; this walkthrough reflects the features people actually use, not a manual.

Table of Contents
- TL;DR
- The Office Excel Analysis Toolkit
- Power Query for Data Preparation
- Power Pivot and the Data Model
- Analyze Data and Built-In Intelligence
- Where Office Excel Reaches Its Limit
- Extending Beyond Office Excel
- Building a Repeatable Office Analysis Process
- Selection Scorecard
- Failure Modes
- Frequently Asked Questions
- Conclusion
TL;DR
Direct answer: microsoft office excel data analysis goes well beyond basic formulas thanks to Power Query for preparation, Power Pivot for modeling larger data, and Analyze Data for automatic insights. These built-in features handle far more than most users realize, though scale, multi-source governance, and recurring automation still favor an AI-native agent.
Who this is for: Office users who want to push microsoft office excel data analysis further than pivot tables.
What you'll learn: the modern Office analysis toolkit, how Power Query and Power Pivot extend Excel, what Analyze Data offers, where the limit sits, and how to extend beyond it.
This walkthrough sits within the data analysis tools hub; for Excel's core workflow, see Excel data analysis: complete how-to.
For related depth in this pillar, see Microsoft Excel Data Analysis Tool in 2026.
The Office Excel Analysis Toolkit
Most people underuse microsoft office excel data analysis because they never move past formulas and basic pivots. Modern Office Excel includes a genuinely capable analysis stack that many users have installed but never opened. Understanding what is available changes how far the tool can take you before you need anything else, and it often defers the jump to heavier software by a year or more.
The core of modern microsoft office excel data analysis rests on three pillars: Power Query for connecting and cleaning data, Power Pivot for modeling larger datasets than a normal sheet allows, and Analyze Data for automatically surfacing patterns. Together with traditional pivots and formulas, these turn Excel from a calculator into a compact analysis environment. Microsoft's Excel support documentation details each feature, and learning even two of them meaningfully raises the ceiling of what you can accomplish inside Office without leaving the familiar grid.
Power Query for Data Preparation
Power Query is the most transformative and most overlooked part of microsoft office excel data analysis. It provides a repeatable way to connect to sources, clean columns, split and merge fields, and reshape data, all recorded as steps that rerun automatically when the source refreshes. This turns the tedious, error-prone manual cleaning that plagues ordinary spreadsheet work into a documented, repeatable process.
The significance for microsoft office excel data analysis is that Power Query addresses the preparation layer Excel was historically weakest at. Instead of copy-pasting and hand-editing every month, you build the transformation once and refresh it, which both saves time and removes a major source of error. For anyone who repeats the same import-and-clean routine, learning Power Query is the single highest-leverage investment in Office analysis, because it converts a recurring manual chore into a button press while keeping the whole process transparent and auditable.
Power Pivot and the Data Model
Power Pivot extends microsoft office excel data analysis past the row limits and performance walls of an ordinary sheet. By loading data into an in-memory model rather than cells, it handles millions of rows and lets you build relationships between tables, so you can analyze related datasets together without fragile lookup formulas. Its DAX formula language adds powerful measures that go beyond what standard pivots express.
For teams whose data has outgrown a single sheet but not yet justified a warehouse, Power Pivot is a meaningful step up within microsoft office excel data analysis. It brings a taste of database-style modeling into the familiar Excel environment, letting analysts work with larger, related data while staying in the tool they know. The trade-off is a steeper learning curve and the fact that the model still lives inside a workbook, which limits governance and collaboration compared with a proper platform. Still, for the middle ground between simple spreadsheets and enterprise systems, it is a valuable capability many Office users never discover. Scripted analysis should follow Python documentation conventions for reproducibility and testable pipelines.
Analyze Data and Built-In Intelligence
The Analyze Data feature brings a layer of automation to microsoft office excel data analysis by scanning a table and suggesting patterns, trends, and charts automatically. A user selects a range, and Excel proposes insights and ready-made visualizations, which can be a helpful starting point for exploration, especially for those unsure where to begin. It represents Microsoft's move to embed lightweight intelligence directly into the grid.
Useful as it is, Analyze Data has clear boundaries within microsoft office excel data analysis. It works on the data already in the sheet, offers suggestions rather than autonomous multi-step analysis, and does not connect across many sources or remember prior work. It is best understood as a helpful assistant for the current worksheet rather than an analyst that runs a whole investigation. The Stanford HAI AI Index documents how much further autonomous agents have advanced beyond this kind of in-app suggestion feature, which frames where Excel's built-in intelligence sits on the spectrum.
Where Office Excel Reaches Its Limit
Even with Power Query, Power Pivot, and Analyze Data, microsoft office excel data analysis eventually meets the same fundamental limits as any spreadsheet-based approach. Data at true warehouse scale strains even the data model, and the workbook remains a single file rather than a governed, shared platform. Collaboration is limited, version control is fragile, and heavy models can become slow and brittle.
The deeper limit is autonomy and repetition. While Power Query automates refresh, microsoft office excel data analysis still expects a human to design and drive the analysis, and complex recurring investigations across many sources remain manual to set up. When these limits bite—when the data is too big, too distributed, or the analysis too repetitive—the right move is to extend beyond Office rather than force ever-more-elaborate workbooks that grow fragile and hard to trust. Knowing this boundary is what separates confident Excel users from those who keep pushing a tool past its design.
Extending Beyond Office Excel
The natural extension for microsoft office excel data analysis at its limit is an AI-native agent that handles scale, multi-source work, and recurring automation. InfiniSynapse is built for this. It is not an NLP2SQL box or a ChatBI widget but a system that behaves like a professional data analyst, covering the layers Office Excel cannot.
With InfiniSynapse, a user connects databases and large files with one-click authorization, cleans and joins across sources, and runs multi-step analysis through InfiniSQL, then exports a tidy result back to Excel when that is where the audience expects the final output. The agent remembers finished tasks, so recurring reports become a sentence rather than a rebuilt workbook. We explain the paradigm in what AI-native data analysis means, and governance-minded teams should validate lineage the way Databricks' documentation recommends. The pairing lets people keep Office Excel for what it does well while escaping its ceiling for everything else.
Building a Repeatable Office Analysis Process
The biggest gains from microsoft office excel data analysis come not from any single feature but from stringing them into a repeatable process. A mature Office workflow connects sources through Power Query, shapes them in the data model with Power Pivot, summarizes with pivots, and presents with charts—each stage recorded so a monthly refresh is a button press rather than an afternoon of rebuilding. Teams that assemble this pipeline get far more value than those who use each feature in isolation.
The discipline that makes such a process reliable is separating raw data, transformation, and presentation, exactly as good analysis in any tool requires. In microsoft office excel data analysis, that means keeping Power Query as the single cleaning layer, the data model as the single source of relationships, and pivots and charts as the presentation, so a change flows through predictably instead of breaking a tangle of formulas. Documenting the sources and definitions inside the workbook keeps the process trustworthy when someone else inherits it.
Even a well-built Office process has honest limits, and part of a repeatable microsoft office excel data analysis practice is knowing when a report has outgrown it. When the refresh slows, the model strains, or several people need to collaborate on the same governed numbers, the repeatable process should hand its output to a platform built for scale and sharing. Treating microsoft office excel data analysis as one stage in a larger pipeline—rather than the whole pipeline—is what keeps it fast and dependable rather than fragile. The discipline follows the process described in the Wikipedia overview of data analysis.
Selection Scorecard
Decide how far microsoft office excel data analysis takes you (1 point each):
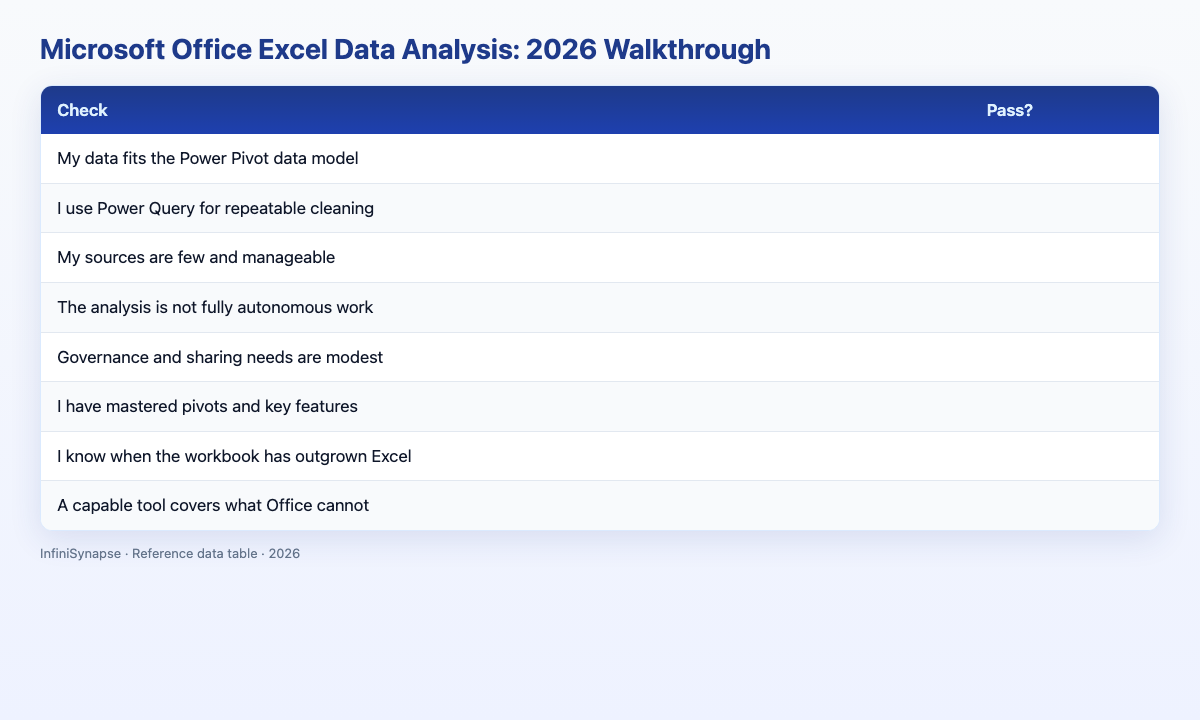
| Check | Pass? |
|---|---|
| My data fits the Power Pivot data model | |
| I use Power Query for repeatable cleaning | |
| My sources are few and manageable | |
| The analysis is not fully autonomous work | |
| Governance and sharing needs are modest | |
| I have mastered pivots and key features | |
| I know when the workbook has outgrown Excel | |
| A capable tool covers what Office cannot |
6–8: Office Excel serves you well. 3–5: fine with an extension plan. Below 3: start with an agent.
Failure Modes
Failure 1: Ignoring Power Query. Manual monthly cleaning wastes the automation microsoft office excel data analysis already offers.
Failure 2: Forcing warehouse-scale data. Even the data model strains at true scale.
Failure 3: Mistaking Analyze Data for an analyst. It suggests; it does not investigate autonomously.
Failure 4: Nursing a fragile workbook. Sprawling models grow slow and untrustworthy.
Frequently Asked Questions
What data analysis features does Microsoft Office Excel have?
Microsoft Office Excel data analysis includes Power Query for connecting and cleaning data, Power Pivot for modeling larger datasets with relationships, Analyze Data for automatic pattern suggestions, plus traditional pivot tables and formulas. Together these handle far more than most users realize before any other tool is needed.
What is Power Query in Excel used for?
Power Query is the preparation engine of Microsoft Office Excel data analysis. It connects to sources and records cleaning and reshaping steps that rerun automatically on refresh, turning tedious manual cleaning into a repeatable, auditable process—the single highest-leverage feature for anyone repeating an import-and-clean routine.
How much data can Excel handle with Power Pivot?
Power Pivot extends Microsoft Office Excel data analysis to millions of rows by loading data into an in-memory model instead of cells, and it supports relationships between tables. It suits data that has outgrown a single sheet but not yet justified a warehouse, though the model still lives inside a workbook.
Is Analyze Data in Excel the same as an AI agent?
No. Analyze Data suggests patterns and charts for the data already in your sheet, but Microsoft Office Excel data analysis stops short of autonomous, multi-step, multi-source investigation. An AI-native agent plans and runs a whole analysis across sources and remembers prior work, which Analyze Data does not.
When should I move beyond Microsoft Office Excel data analysis?
Move beyond it when data reaches warehouse scale, spans many governed sources, or the analysis repeats often enough that manual setup becomes a tax. Keep Office Excel for familiar tasks and hand the heavy, recurring, multi-source work to an AI-native agent built for it.
Conclusion
Microsoft office excel data analysis is far more capable than its reputation suggests, with Power Query, Power Pivot, and Analyze Data extending Excel well past basic formulas. Learn these features, respect the ceiling, and extend beyond Office when scale, sources, or repetition demand it.
For the work past Excel's limit, an AI-native agent is the natural extension. See how AI-native data analysis works and try the InfiniSynapse web app free on registration, no credit card required.