Microsoft Excel Data Analysis: Advanced Techniques for 2026
By the InfiniSynapse Data Team · Last updated: 2026-07-08 · We build an AI-native data analysis platform and work with power users daily; this guide reflects the advanced techniques that actually pay off, not novelty tricks.
Table of Contents
- TL;DR
- Beyond the Basics
- Dynamic Arrays and Modern Formulas
- LAMBDA and Reusable Logic
- What-If Analysis and Solver
- Automating With Macros and Power Query
- The Boundary of Advanced Excel
- Advanced Excel in Team Settings
- Selection Scorecard
- Failure Modes
- Frequently Asked Questions
- Conclusion
TL;DR
Direct answer: advanced microsoft excel data analysis uses dynamic arrays, LAMBDA functions, What-If tools, Solver, and automation via macros and Power Query to push the grid far past basic formulas. These techniques handle sophisticated modeling on modest data, but scale, multi-source governance, and autonomy still belong to an AI-native agent.
Who this is for: power users advancing their microsoft excel data analysis beyond pivots and simple formulas.
What you'll learn: the modern formula engine, LAMBDA for reusable logic, What-If and Solver for scenarios, automation options, and the boundary where advanced Excel gives way to an agent.
This guide sits within the data analysis tools hub; for the foundational workflow, see Excel data analysis: complete how-to. Scripted analysis should follow Python documentation conventions for reproducibility and testable pipelines.
For related depth in this pillar, see Microsoft Excel Data Analysis Tool in 2026.
Beyond the Basics
Most people stop learning microsoft excel data analysis at pivots and SUMIFS, yet the modern grid contains a far more powerful engine that rewards the analyst who goes further. Advanced techniques do not just save time; they enable analyses that basic formulas make impractical, from spilling calculations across ranges automatically to defining reusable custom functions. For power users, mastering these capabilities extends how far Excel can take a problem before another tool is needed.
The shift in recent years has made microsoft excel data analysis meaningfully more capable, thanks largely to dynamic arrays and new functions that change how formulas behave. Learning them repays the effort many times over, because they replace brittle, copy-pasted formulas with clean, self-adjusting logic. This guide focuses on the advanced techniques that genuinely pay off in real work, rather than novelty tricks, so the time you invest in advancing your microsoft excel data analysis translates into more reliable and more maintainable analysis.
Dynamic Arrays and Modern Formulas
Dynamic arrays are the most important recent addition to microsoft excel data analysis. Functions like FILTER, SORT, UNIQUE, and SEQUENCE return whole ranges that "spill" automatically into neighboring cells, so a single formula can produce a filtered, sorted list that adjusts as the data changes. This eliminates the fragile helper columns and manual copy-fill that used to clutter advanced workbooks.
The practical impact on microsoft excel data analysis is large. A report that once required several helper ranges and manual maintenance can now be a couple of dynamic-array formulas that update themselves. XLOOKUP, the modern replacement for VLOOKUP and INDEX/MATCH, handles lookups more robustly and reads more clearly. Adopting these modern formulas makes advanced microsoft excel data analysis both more powerful and more maintainable, because the logic is centralized in fewer, clearer formulas rather than scattered across the sheet where errors hide. IBM's augmented analytics overview tracks the fastest-moving segment of the analytics market.
LAMBDA and Reusable Logic
LAMBDA is the feature that pushes microsoft excel data analysis closest to real programming. It lets you define a custom function from other formulas, name it, and reuse it across the workbook, so complex logic is written once and applied everywhere. Combined with helper functions like MAP and REDUCE, LAMBDA brings a degree of abstraction that used to require VBA or an external language.
For serious microsoft excel data analysis, LAMBDA solves a long-standing problem: repeated complex formulas that were impossible to maintain because a fix had to be applied in dozens of places. With a named LAMBDA, the logic lives in one definition, and every use updates when you edit it. This is genuinely advanced territory, and not every analyst needs it, but for those building reusable models inside Excel, LAMBDA is the technique that most extends what the grid can express without leaving it for code.
What-If Analysis and Solver
Scenario modeling is a distinct strength of advanced microsoft excel data analysis. The What-If Analysis tools—Data Tables, Goal Seek, and Scenario Manager—let you explore how outputs change as inputs vary, which is invaluable for planning and sensitivity analysis. Goal Seek works backward from a target to find the input that achieves it, while Data Tables map a whole grid of outcomes across changing assumptions.
Solver extends this into optimization, finding the input combination that maximizes or minimizes a target subject to constraints—useful for allocation, scheduling, and resource problems. These tools give microsoft excel data analysis a modeling capability that many users never discover, letting a spreadsheet answer not just "what happened?" but "what should we do?" For modest models they are remarkably effective, though like all spreadsheet techniques they are bounded by scale and by the manual effort of setting each scenario up. Warehouse-grounded analytics should align with Databricks documentation on SQL warehouses and data governance.
Automating With Macros and Power Query
Automation is where advanced microsoft excel data analysis reclaims the most time. Power Query automates the import-and-clean stage, recording steps that rerun on refresh, while macros and VBA can automate repetitive sequences of actions across a workbook. Together they turn a manual routine into something closer to a repeatable process, which matters most for reports that run on a schedule.
Still, automation within microsoft excel data analysis has honest boundaries. Power Query automates preparation but not the analysis design; macros automate clicks but are brittle and hard to maintain as they grow. The automation keeps the work inside a single workbook rather than a governed, shared system, so it helps an individual more than it helps a team. For genuine recurring, multi-source, governed automation, the work eventually points beyond Excel toward a platform built for it, which is the boundary the next section addresses.
The Boundary of Advanced Excel
Even at their most advanced, these microsoft excel data analysis techniques share the same underlying ceiling. The data still lives in a workbook bound by Excel's scale limits, collaboration and governance remain weak, and the analysis, however clever, still depends on a human to design and drive it. Advanced techniques raise the ceiling; they do not remove it.
When the work crosses that boundary—warehouse-scale data, many governed sources, or truly autonomous recurring analysis—an AI-native agent is the natural next tool. InfiniSynapse is built for this role, not an NLP2SQL box or a ChatBI widget but a system that behaves like a professional data analyst. It connects sources with one-click authorization, cleans and joins across them, runs multi-step analysis through InfiniSQL, and remembers finished tasks, then can hand a tidy result back to Excel for final presentation. We explain the paradigm in what AI-native data analysis means, and the Stanford HAI AI Index documents how capable this option has become. Advanced Excel and the agent are complementary: master the grid, and delegate what lies beyond its boundary.
Advanced Excel in Team Settings
Advanced spreadsheet techniques were designed for individuals, and that origin shapes how they behave in a team. A brilliant workbook full of dynamic arrays and named functions can be a productivity marvel for its author and an opaque puzzle for everyone else. When advanced logic lives in one person's file, the organization inherits a single point of failure: if that person leaves, the analysis becomes unmaintainable, and no one dares change a formula they do not understand. The discipline follows the process described in the Wikipedia overview of data analysis.
The remedy in a team setting is documentation and shared conventions. Name ranges and functions clearly, keep a notes area explaining the model's logic and data sources, and agree on a house style so any analyst can pick up another's workbook. These practices do not eliminate the fundamental limitation—that a workbook is a personal artifact rather than a governed system—but they soften it considerably. Teams that skip these conventions accumulate a graveyard of clever but unreadable files that slow everyone down.
Ultimately, the more a team relies on advanced spreadsheet logic for shared, recurring work, the stronger the case for moving that work to a platform built for collaboration. A governed tool provides shared definitions, access control, and an audit trail that no workbook can match, and it removes the single-point-of-failure risk entirely. Advanced Excel remains superb for individual power and rapid prototyping; for durable team analysis, it should feed a governed system rather than serve as one.
Selection Scorecard
Judge whether advanced microsoft excel data analysis fits (1 point each):
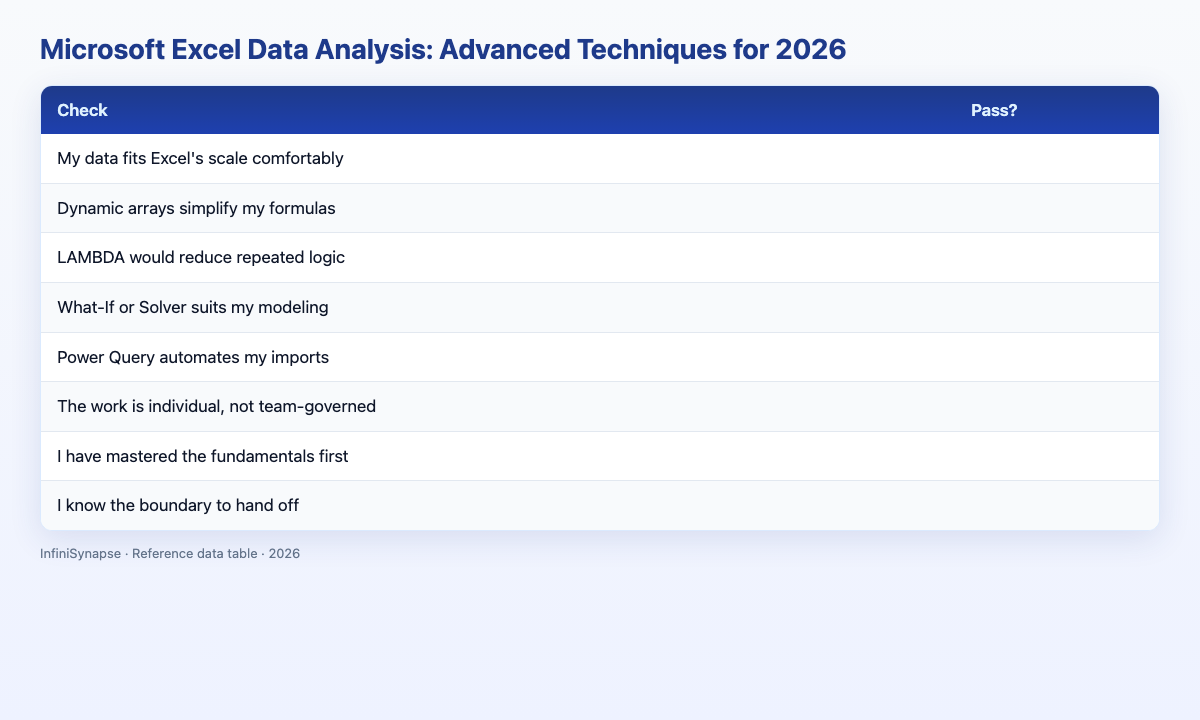
| Check | Pass? |
|---|---|
| My data fits Excel's scale comfortably | |
| Dynamic arrays simplify my formulas | |
| LAMBDA would reduce repeated logic | |
| What-If or Solver suits my modeling | |
| Power Query automates my imports | |
| The work is individual, not team-governed | |
| I have mastered the fundamentals first | |
| I know the boundary to hand off |
6–8: advanced Excel serves you. 3–5: fine with a handoff plan. Below 3: use an agent.
Failure Modes
Failure 1: Advanced tricks on dirty data. No LAMBDA fixes uncleaned input; microsoft excel data analysis still needs clean data first.
Failure 2: Overusing VBA. Sprawling macros become brittle and unmaintainable.
Failure 3: Ignoring dynamic arrays. Clinging to helper columns wastes the modern engine.
Failure 4: Pushing past the ceiling. Warehouse-scale or governed work needs a platform, not a cleverer workbook.
Frequently Asked Questions
What are advanced Microsoft Excel data analysis techniques?
Advanced microsoft excel data analysis techniques include dynamic arrays (FILTER, SORT, UNIQUE), the LAMBDA custom-function engine, What-If Analysis and Solver for scenario modeling, and automation through Power Query and macros. These push the grid far past basic formulas while staying inside Excel.
What are dynamic arrays in Excel?
Dynamic arrays are modern formulas in microsoft excel data analysis that return whole ranges which spill automatically into neighboring cells. Functions like FILTER, SORT, UNIQUE, and SEQUENCE replace fragile helper columns with self-adjusting logic, making advanced workbooks more powerful and easier to maintain.
What is LAMBDA used for in Excel?
LAMBDA lets you define a reusable custom function from other formulas and name it, so complex logic is written once and applied across the workbook. In microsoft excel data analysis it solves the maintenance problem of repeated complex formulas, bringing a degree of abstraction that once required VBA.
What is the difference between What-If Analysis and Solver?
In microsoft excel data analysis, What-If Analysis tools like Goal Seek and Data Tables explore how outputs change as inputs vary, while Solver finds the optimal input combination that maximizes or minimizes a target subject to constraints. What-If explores scenarios; Solver optimizes them.
When does advanced Excel give way to an AI-native agent?
Advanced microsoft excel data analysis gives way to an agent when data reaches warehouse scale, spans many governed sources, or requires truly autonomous recurring analysis. Advanced techniques raise Excel's ceiling but do not remove it, so an AI-native agent takes over the heavy, multi-source, repeatable work.
Conclusion
Advanced microsoft excel data analysis—dynamic arrays, LAMBDA, What-If, Solver, and automation—extends the grid far past basic formulas and rewards the power user willing to learn it. Master these techniques, but recognize the ceiling they raise rather than remove.
A final word on judgment: the point of learning advanced techniques is not to prove they can be used but to know when they should be. A dynamic-array formula that replaces a fragile helper column is a clear win; a baroque custom function that only its author understands may be a liability dressed as sophistication. The most skilled Excel users apply advanced capabilities where they genuinely simplify or strengthen the analysis, and they resist complexity for its own sake. That restraint, paired with a clear sense of where the grid's boundary lies, is what turns raw feature knowledge into dependable, maintainable analytical work that serves a team rather than merely impressing it.
For work beyond that boundary, an AI-native agent is the complementary next step. See how AI-native data analysis works and try the InfiniSynapse web app free on registration, no credit card required.