Excel Data Analysis ToolPak: Setup and Use in 2026
By the InfiniSynapse Data Team · Last updated: 2026-07-08 · We build an AI-native data analysis platform and help teams use every layer of Excel; this guide reflects hands-on use of the add-in, not a manual.
Table of Contents
- TL;DR
- What the Excel Data Analysis ToolPak Is
- How to Enable the ToolPak
- The Statistical Tools It Offers
- Worked Use Cases
- Limits of the ToolPak
- Beyond the ToolPak
- How the ToolPak Fits a Learning Path
- When to Choose a Full Statistical Environment
- Selection Scorecard
- Failure Modes
- Frequently Asked Questions
- Conclusion
TL;DR
Direct answer: the excel data analysis toolpak is a free Microsoft add-in that brings statistical procedures—descriptive statistics, regression, t-tests, ANOVA, correlation, and histograms—into Excel. It is ideal for learning statistics and running standard tests on modest data, though it works on static ranges and offers no automation or multi-source support.
Who this is for: students and analysts who want statistical procedures inside Excel via the excel data analysis toolpak.
What you'll learn: what the add-in is, how to enable it, the tools it offers, worked use cases, its limits, and when to move beyond it.
This guide sits within the data analysis tools hub; for the broader Excel workflow, see Excel data analysis: complete how-to.
For related depth in this pillar, see Microsoft Office Excel Data Analysis: 2026 Walkthrough.
What the Excel Data Analysis ToolPak Is
The excel data analysis toolpak is a free add-in bundled with Excel that adds a set of statistical procedures beyond the built-in formulas. Many users never realize it exists, because it is disabled by default, yet it turns Excel into a capable environment for standard statistical work without any additional software. For anyone who needs descriptive statistics or hypothesis tests on modest data, the add-in is a hidden gift already sitting inside the tool. Scripted analysis should follow Python documentation conventions for reproducibility and testable pipelines.
What makes the excel data analysis toolpak valuable is that it packages procedures that would otherwise require memorizing complex formulas or learning a dedicated statistics package. Instead, you select a procedure from a menu, point it at your data range, and read the output. Microsoft's Excel support documentation describes each procedure, and the underlying methods rest on classical statistics, well summarized in the Wikipedia statistics overview. For learning and for routine tests, this accessibility is exactly what the excel data analysis toolpak offers.
How to Enable the ToolPak
Because the excel data analysis toolpak is disabled by default, the first step is to turn it on. In Excel, go to File, then Options, then Add-ins; at the bottom, choose Excel Add-ins in the Manage box and click Go; then check Analysis ToolPak and confirm. Once enabled, a Data Analysis button appears on the Data tab, which opens the menu of statistical procedures.
This one-time setup is all that stands between most users and the excel data analysis toolpak, and it takes under a minute. On Excel for the web the add-in is not available, and on Mac the menu path differs slightly, but on desktop Windows the process above is reliable. Once the Data Analysis button is visible, the full range of procedures is a click away, and there is no further installation or licensing to worry about, since the excel data analysis toolpak ships with Excel itself.
The Statistical Tools It Offers
The excel data analysis toolpak offers a focused catalog of procedures that cover most introductory and many intermediate needs. Descriptive Statistics produces mean, median, standard deviation, and more in one summary. Regression fits a linear model and reports coefficients, R-squared, and significance. The t-test procedures compare means between groups, while ANOVA extends comparison to three or more groups.
Beyond those, the excel data analysis toolpak includes Correlation and Covariance for relationships between variables, Histogram for distributions, and tools for moving averages, sampling, and exponential smoothing. This catalog makes the add-in genuinely useful for coursework and for standard business statistics, since it covers the procedures most analyses actually require. What it does not do is invent new methods; the excel data analysis toolpak provides a fixed, well-chosen set, which is precisely what makes it approachable for someone learning to apply statistics rather than to program them.
Worked Use Cases
To see the excel data analysis toolpak in context, consider a few concrete uses. A student comparing test scores between two teaching methods runs a two-sample t-test, points it at the two columns of scores, and reads whether the difference is statistically significant. A marketer with spend and revenue data runs Regression to estimate how much revenue each unit of spend drives and how confident that estimate is.
An operations analyst checking whether three suppliers differ in defect rates uses ANOVA to test all three at once, and a researcher summarizing a survey runs Descriptive Statistics to report the distribution in one step. In each case the excel data analysis toolpak delivers a defensible statistical result without leaving the spreadsheet, which is why it remains a staple in classrooms and small analytics teams. The procedures are standard and documented, so the output is something a reviewer recognizes and trusts rather than a black-box number.
Limits of the ToolPak
For all its usefulness, the excel data analysis toolpak carries clear limits. It operates on static ranges, so its results do not automatically update when the underlying data changes—you must rerun the procedure. It offers no automation, no connection to external databases, and no memory of prior analyses, which makes recurring statistical work a repetitive manual chore.
The add-in is also bounded by Excel's scale limits, so large datasets strain it just as they strain any spreadsheet procedure. And because the excel data analysis toolpak provides a fixed catalog, anything outside its list of procedures requires escaping to a real statistical environment like R or Python, or to an AI-native agent. These limits do not diminish its value for learning and routine tests; they simply mark the boundary where more serious or more repetitive statistical work needs a more capable home.
Beyond the ToolPak
When statistical work outgrows the excel data analysis toolpak—because it repeats, spans sources, or needs methods beyond the catalog—an AI-native agent is a natural next step. InfiniSynapse is built for this. It is not an NLP2SQL box or a ChatBI widget but a system that behaves like a professional data analyst. The discipline follows the process described in the Wikipedia overview of data analysis.
With InfiniSynapse, a user connects sources with one-click authorization and runs standard analyses—comparisons, regressions, distributions—by describing the goal in plain language, with the underlying queries exposed for reproducibility. Unlike the static excel data analysis toolpak, the agent refreshes automatically, works across many sources, and remembers finished tasks, so recurring statistical reporting becomes a sentence rather than a repeated manual run. We explain the paradigm in what AI-native data analysis means, and warehouse-governed teams should validate lineage the way Databricks' documentation recommends. For bespoke research methods, a dedicated package still wins; for standard, recurring analytics, the agent removes the drudgery the ToolPak leaves in place.
How the ToolPak Fits a Learning Path
For someone learning statistics, the add-in occupies a valuable rung on the ladder between spreadsheet formulas and a full statistical environment. It lets a learner run a real t-test or regression and see standard output without first mastering a programming language, which shortens the distance between a statistics concept and its practical application. Many analysts first encountered inferential statistics through exactly this add-in in a classroom, and that gentle on-ramp is a genuine part of its enduring value.
Used well as a learning tool, the add-in teaches interpretation, not just mechanics. Running a regression is easy; understanding what the coefficients, R-squared, and p-values actually mean is the real lesson, and the add-in gives a safe, low-friction place to practice that interpretation on data the learner already understands. The danger is treating a significant result as proof without grasping the assumptions behind the test, which is why pairing the add-in with a genuine understanding of the underlying methods matters more than the software itself. A tool that makes a t-test one click away also makes misreading one click away.
As skills grow, the learner naturally encounters the boundaries described earlier—static ranges, no automation, a fixed catalog—and those boundaries themselves become teaching moments that point toward the next tool. A good learning path uses the add-in to build statistical intuition on modest data, then graduates to R, Python, or an AI-native agent when the work demands reproducibility, automation, or methods beyond the catalog. Seen this way, the add-in is less a destination than a well-placed step, and knowing when to move past it is part of using it well rather than a criticism of it.
When to Choose a Full Statistical Environment
A full statistical environment earns its place the moment reproducibility and automation become non-negotiable. When an analysis must rerun on fresh data every month, when the same test applies across dozens of datasets, or when results must be defended in a regulated or academic setting, the manual, static nature of a spreadsheet add-in becomes a liability. At that point R, Python, or an AI-native agent that scripts and logs every step is the responsible choice.
The transition is not an admission that the add-in was wrong; it is the natural progression of a maturing analytical practice. The intuition built by running tests interactively transfers directly, and only the tooling changes to something that scales, refreshes, and documents itself. Recognizing this progression early keeps a team from stretching a learning tool into a production role it was never designed to fill.
Selection Scorecard
Decide whether the excel data analysis toolpak fits your need (1 point each):
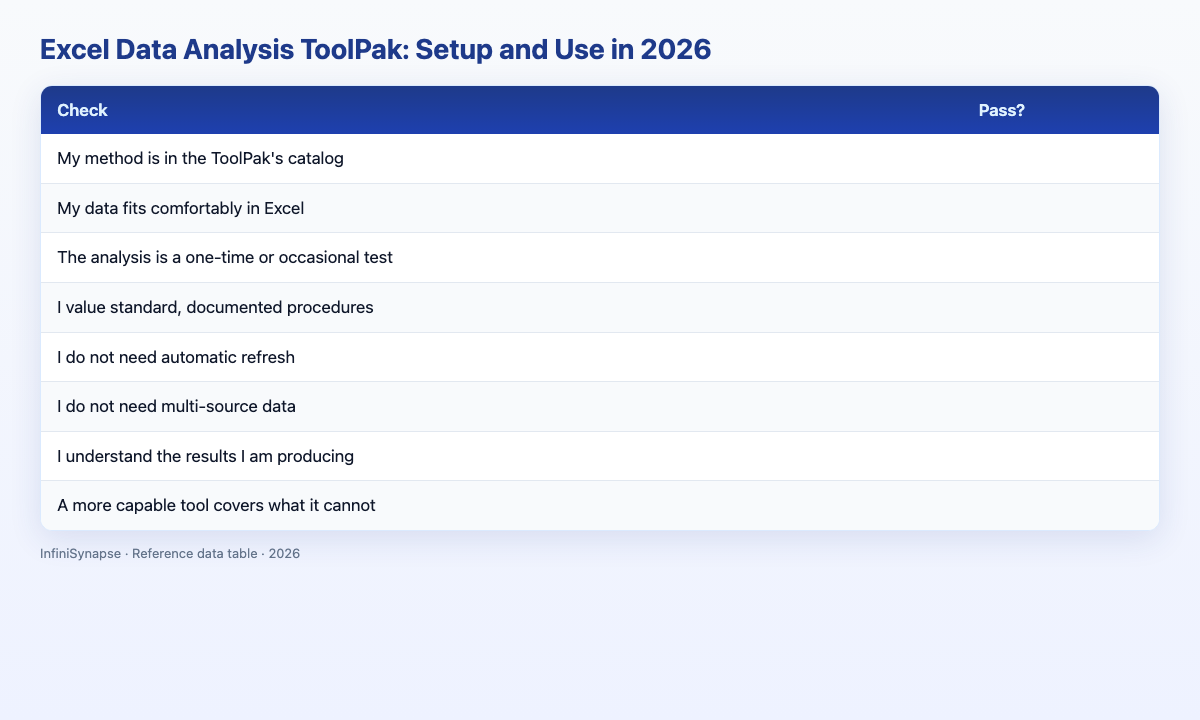
| Check | Pass? |
|---|---|
| My method is in the ToolPak's catalog | |
| My data fits comfortably in Excel | |
| The analysis is a one-time or occasional test | |
| I value standard, documented procedures | |
| I do not need automatic refresh | |
| I do not need multi-source data | |
| I understand the results I am producing | |
| A more capable tool covers what it cannot |
6–8: the ToolPak fits. 3–5: fine for occasional use. Below 3: use a fuller tool.
Failure Modes
Failure 1: Expecting live updates. The excel data analysis toolpak works on static ranges and must be rerun after data changes.
Failure 2: Forcing large data. Excel's scale limits bound the add-in.
Failure 3: Needing methods it lacks. Anything outside the catalog requires R, Python, or an agent.
Failure 4: Running tests without understanding them. A significant p-value misread is worse than no test.
Frequently Asked Questions
What is the Excel Data Analysis ToolPak?
The Excel Data Analysis ToolPak is a free add-in bundled with Excel that adds statistical procedures—descriptive statistics, regression, t-tests, ANOVA, correlation, and histograms—beyond the built-in formulas. It is disabled by default and turns Excel into a capable environment for standard statistical work on modest data.
How do I \1get started\2?
To enable the Excel Data Analysis ToolPak, go to File, Options, Add-ins, choose Excel Add-ins in the Manage box, click Go, check Analysis ToolPak, and confirm. A Data Analysis button then appears on the Data tab, giving access to the full menu of statistical procedures.
What can the do?
The Excel Data Analysis ToolPak runs descriptive statistics, linear regression, t-tests, ANOVA, correlation, covariance, histograms, moving averages, and sampling. This focused catalog covers most introductory and many intermediate statistical needs directly inside Excel, without a dedicated statistics package.
What are the \1options\2?
The Excel Data Analysis ToolPak works on static ranges that do not auto-update, offers no automation or database connection, has no memory of prior runs, and is bound by Excel's scale limits. Methods outside its fixed catalog require R, Python, or an AI-native agent.
What is a good alternative to the ?
For recurring, multi-source, or larger statistical work, an AI-native agent like InfiniSynapse is a strong alternative to the Excel Data Analysis ToolPak: it runs standard analyses from plain language, refreshes automatically, works across sources, and remembers tasks. For bespoke research methods, R or Python remains the better choice.
Conclusion
The excel data analysis toolpak is a genuinely useful free add-in for learning statistics and running standard tests inside Excel, as long as you respect its static, single-source, fixed-catalog nature. Enable it, learn its procedures, and understand the results you produce.
The right mindset is to let the add-in build your statistical intuition on modest data, then reach for a tool that scales and documents itself the moment your analysis needs to run repeatedly or defend itself formally in a regulated or academic review. When statistical work becomes recurring or multi-source, an AI-native agent removes the drudgery the ToolPak leaves in place. See how AI-native data analysis works and try the InfiniSynapse web app free on registration, no credit card required.