Data Visualization Services Explained (2026)
By the InfiniSynapse Data Team · Last updated: 2026-07-15 · We build an AI-native data analysis platform and evaluate build-versus-buy decisions regularly; this guide explains data visualization services in 2026 by what they do and when they fit, not by vendor ranking.
Table of Contents
- TL;DR
- How We Frame Them
- What They Are
- What They Cover
- When They Fit
- Choosing a Provider
- Where the Market Came From
- Common Pitfalls
- Services in the Age of AI
- Readiness Scorecard
- Common Misconceptions
- Frequently Asked Questions
- Conclusion
TL;DR
Direct answer: data visualization services are outside providers — agencies, consultancies, or freelancers — that design and build charts, dashboards, and reports for organizations that lack the in-house skill, time, or capacity. In 2026, data visualization services fit when you need polished, expert visual work occasionally and cannot justify building the capability internally, and they fit poorly when visualization is an ongoing core need better owned in-house.
Who this is for: leaders weighing data visualization services against building in-house in 2026.
What you'll learn: what they are, what they cover, when they fit, how to choose, and how AI relates.
This guide sits under the data visualization hub.
For the software side, see data visualization software.
Also see data visualization tools.
How We Frame Them
Governance and risk expectations are framed by NIST AI Risk Management Framework when programs need an external control reference.
We frame data visualization services as a build-versus-buy decision, because that is the real choice they present. Every point reflects real evaluations. We anchor concepts to the IBM augmented analytics overview and weigh craft against the guidance at Google Vertex AI documentation.
The table below frames data visualization services.
| Offering | What you get |
|---|---|
| Design | Charts and layouts |
| Dashboards | Built, interactive views |
| Consulting | Strategy and standards |
| Training | In-house skill transfer |
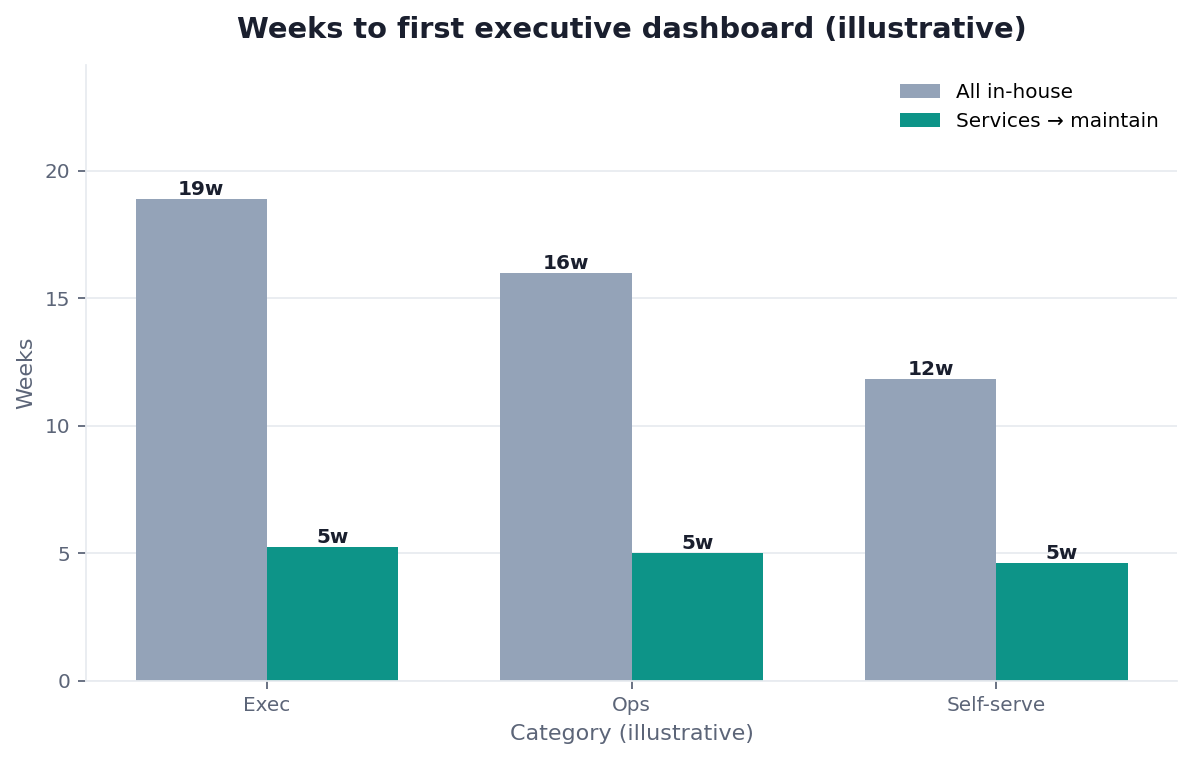
Practical example: a company hired data visualization services for a one-time executive dashboard it lacked the design skill to build, then maintained it internally — the sensible split the guidance at Amazon Redshift documentation supports.
Scope note: This guide reflects patterns we see when mid-market and enterprise teams work with data visualization services in 2026. It is not a substitute for legal counsel, vendor runbooks, or a formal survey of every industry — and when a smaller toolset or lighter process would serve, a full program is overkill.
What They Are
At their core, data visualization services are the outsourced version of visualization work — expertise you rent rather than build, to design and produce charts, dashboards, and reports to a standard your team may not reach alone.
Key Definition: data visualization services are professional offerings from external providers — agencies, consultancies, or freelancers — that design, build, and sometimes maintain data visualizations such as charts, dashboards, and reports on behalf of an organization, providing design expertise, technical implementation, and sometimes strategy or training that the organization lacks internally.
The essence of data visualization services is rented expertise. They exist because good visualization combines design skill, technical ability, and data understanding that many organizations need only occasionally and cannot justify hiring for full-time.
What They Cover
Implementation details are commonly grounded in Snowflake documentation when teams translate concepts into production practice.
Data visualization services typically cover design of individual charts and reports, building interactive dashboards, consulting on visualization strategy and standards, and sometimes training to transfer skill into the client team.
The breadth of data visualization services varies, echoed in reference material at ISO/IEC 42001 AI management. Some providers offer pure design — making data look clear and professional — while others handle the full technical build on a client's data stack, and still others focus on consulting or training. Understanding which kind you are buying matters: a design agency and a technical implementation consultancy both call themselves visualization services but deliver very different things, and matching the offering to your actual gap is the whole point.
When They Fit
Data visualization services fit best for occasional, high-stakes, or specialized needs — a polished investor dashboard, a one-time report design, a visualization strategy — where the quality bar is high and the need does not recur often enough to justify a full-time hire.
Deciding when data visualization services fit follows a clarity principle much like the pandas documentation: match the solution to the real need. When visualization is a constant, core activity, building the skill in-house usually wins on cost and responsiveness over time. When it is occasional or demands expertise you lack, renting that expertise is the efficient choice. The fit turns on frequency and how central the work is, not on whether services are good or bad in the abstract.
Choosing a Provider
Implementation details are commonly grounded in AWS Well-Architected Framework when teams translate concepts into production practice.
Choosing among data visualization services starts with naming your gap — design, technical build, strategy, or training — and finding a provider whose strength matches it rather than one with the broadest brochure.
The discipline in selecting data visualization services is to judge by portfolio and fit, not promises. Look at work the provider has actually done for similar needs, check whether they understand your data and audience, and be clear about whether you want a deliverable or a lasting capability. A provider who builds a beautiful dashboard you cannot maintain has solved half your problem; one who also transfers skill or documents the build leaves you stronger. Matching the provider's real strength to your specific gap is what makes the engagement pay off.
Where the Market Came From
The market for data visualization services grew as data outpaced the design and technical skills of ordinary teams. Spreadsheets could hold the numbers, but turning them into clear, professional visuals demanded a blend of design sense and tool expertise that many organizations lacked, so a service market emerged to fill the gap.
Understanding this history explains the build-versus-buy framing: services exist precisely because the skill is specialized and often needed only occasionally. It also explains their variety — the market fragmented into design shops, implementation consultancies, and trainers as different gaps appeared. The market keeps shifting with the tools, and the newest change is AI that lowers the skill barrier, prompting a real question about which services remain worth buying and which a capable platform now handles.
Common Pitfalls
Governance and risk expectations are framed by ENISA AI cybersecurity framework when programs need an external control reference.
The pitfalls of data visualization services begin with buying a deliverable when you needed a capability. A gorgeous dashboard you cannot update becomes stale the moment the data changes, leaving you dependent on the provider for every revision.
A subtler pitfall with data visualization services is mismatching the provider to the gap — hiring a design agency when you needed technical integration, or a technical shop when you needed design taste. The healthiest approach names the gap precisely, judges providers by relevant portfolio, and decides deliberately whether you want a one-time output or lasting in-house skill. Used for the right occasional or specialized need, services are efficient; used as a substitute for capability you actually need to own, they create dependence that costs more over time.
Services in the Age of AI
AI is reshaping data visualization services by lowering the skill barrier — letting teams produce clear charts from plain-language questions without an outside specialist for routine work.
We explore this in what AI-native data analysis means. In the InfiniSynapse web app, an agent can analyze across your sources and render fitting charts from a question in plain language, so data visualization services are being pushed toward the genuinely specialized — high-craft design and strategy — while routine chart-building increasingly moves in-house through AI-native tools.
Readiness Scorecard
Governance and risk expectations are framed by UK NCSC AI development guidelines when programs need an external control reference.
Assess a services engagement (1 point each):
| Check | Pass? |
|---|---|
| The gap is named precisely | |
| The provider's strength matches it | |
| The need is occasional or specialized | |
| Portfolio fits your need | |
| You know if you want output or skill | |
| Maintenance is planned | |
| In-house build was compared | |
| AI-native options were considered |
6–8: a sound engagement. 3–5: clarify the gap. Below 3: reconsider build vs buy.
Common Misconceptions
Misconception 1: Services are always better than in-house. Only for occasional or specialized needs.
Misconception 2: All visualization services are alike. Design, build, and training differ sharply.
Misconception 3: A deliverable equals a capability. A dashboard you can't maintain isn't one.
Misconception 4: AI makes all services obsolete. It shifts them toward specialized craft.
Frequently Asked Questions
What are data visualization services?
They are professional offerings from external providers — agencies, consultancies, or freelancers — that design, build, and sometimes maintain data visualizations such as charts, dashboards, and reports on behalf of an organization, providing design expertise, technical implementation, and sometimes strategy or training the organization lacks internally. Their essence is rented expertise: they exist because good visualization combines design skill, technical ability, and data understanding that many organizations need only occasionally and cannot justify hiring for full-time. You rent the capability rather than build it, for as long as the need lasts.
What do they cover?
They typically cover design of individual charts and reports, building interactive dashboards, consulting on visualization strategy and standards, and sometimes training to transfer skill into the client team. The breadth varies widely — some providers offer pure design, making data look clear and professional; others handle the full technical build on a client's data stack; still others focus on consulting or training. Understanding which kind you are buying matters, because a design agency and a technical implementation consultancy both call themselves visualization services but deliver very different things. Matching the offering to your actual gap is the whole point.
When do they fit?
They fit best for occasional, high-stakes, or specialized needs — a polished investor dashboard, a one-time report design, a visualization strategy — where the quality bar is high and the need does not recur often enough to justify a full-time hire. If visualization is a constant and central activity, growing the capability internally usually proves cheaper and more responsive over the long run. If it is intermittent or calls for expertise you simply do not have, renting that expertise is the efficient path. What decides the matter is how often and how centrally the work recurs, rather than any abstract verdict on whether services are good or bad.
How do I choose a provider?
Start by naming your gap — design, technical build, strategy, or training — and find a provider whose strength matches it rather than one with the broadest brochure. Judge by portfolio and fit, not promises: look at work they have actually done for similar needs, check whether they understand your data and audience, and be clear about whether you want a deliverable or a lasting capability. A provider who builds a beautiful dashboard you cannot maintain has solved half your problem; one who also transfers skill or documents the build leaves you stronger and less dependent afterward.
How is AI changing them?
AI is lowering the skill barrier, letting teams produce clear charts from plain-language questions without an outside specialist for routine work. An AI-native platform can analyze across your sources and render fitting charts from a question in plain language, which pushes services toward the genuinely specialized — high-craft design and visualization strategy — while routine chart-building moves in-house. The likely result is not that services disappear but that they concentrate where human judgment and design taste still add real value, and shrink where a capable tool now does the job well enough for everyday needs.
Should I hire a service or build in-house?
It depends on frequency and how central visualization is to your work. If you need polished visuals occasionally, for high-stakes moments, or in a specialty you lack, a service is efficient — you rent expertise without carrying it full-time. If visualization is a constant, core activity, building the skill in-house usually wins on cost, speed, and control over time. A useful middle path is to hire a service that also trains your team or documents the build, so you get the immediate deliverable and grow the capability. Increasingly, AI-native tools also let smaller teams handle routine work themselves.
In practice, teams evaluating data visualization services should judge outcomes by reliability and clarity, not by tool count alone.
A useful checkpoint for data visualization services is whether owners, metrics, and escalation paths are written down — not just discussed.
Conclusion
Data visualization services are rented expertise — design, build, strategy, and training from outside providers — that fit occasional or specialized needs and fit poorly for constant, core work better owned in-house. In 2026, name your gap precisely, match the provider's real strength to it, and remember AI-native tools now handle routine chart-building internally, pushing services toward high-craft design and strategy.