Top Data Analysis Platforms Compared in 2026
By the InfiniSynapse Data Team · Last updated: 2026-07-08 · We build an AI-native data analysis platform and benchmark rival systems on real customer workloads; this comparison reflects hands-on testing, not sponsored placement.
Table of Contents
- TL;DR
- How We Compare Data Analysis Platforms
- BI Platforms: Tableau, Power BI, Looker
- Warehouse-Centric Platforms
- AI-Native Platforms
- Side-by-Side Comparison
- Which Platform for Which Team
- How the Platforms Handle Preparation
- Pricing Models Across Data Analysis Platforms
- A Realistic Multi-Platform Stack
- Scorecard
- How to Run a Platform Bake-Off
- Failure Modes
- Frequently Asked Questions
- Conclusion
TL;DR
Direct answer: the leading data analysis platforms in 2026 fall into three families—BI platforms (Tableau, Power BI, Looker) for shared dashboards, warehouse-centric platforms for scale, and AI-native platforms for autonomous multi-source analysis. The right one depends on whether your bottleneck is sharing, scale, or repetition.
Who this is for: teams comparing data analysis platforms and wanting a scored, use-case-aware view.
What you'll learn: the comparison criteria, the three platform families and their standouts, a side-by-side table, which platform fits which team, and a selection scorecard.
This is the head-to-head companion to what a data analysis platform is and sits under the data analysis tools hub.
For related depth in this pillar, see Best Data Analysis Software in 2026: Free and Paid.
How We Compare Data Analysis Platforms
We score data analysis platforms on five dimensions that predict whether a platform survives a year: connection breadth, preparation power, analysis depth, sharing and governance, and autonomy. The first four are familiar; the fifth—autonomy—barely existed before 2026, which is why the Stanford HAI AI Index treats it as the fastest-moving axis in the category.
The general activity these platforms support is the same, as the Wikipedia data analysis overview describes; the differences are in which layers each platform makes effortless.
BI Platforms: Tableau, Power BI, Looker
BI platforms are the most recognized data analysis platforms. Their strength is the sharing layer: build a governed dashboard once, distribute it to many viewers. Tableau leads on visual flexibility, Power BI on Microsoft-ecosystem integration and price, Looker on modeled, governed metrics.
Their shared weakness is preparation. A BI platform presents modeled data; it does not clean messy sources on its own, so teams pair it with a preparation layer. See Tableau as a data analysis tool for the practical edges, and note that IBM's augmented analytics overview tracks how these vendors are bolting on AI to close the preparation gap.
Warehouse-Centric Platforms
Warehouse-centric data analysis platforms put scale first. Built around cloud warehouses, they query billions of rows and govern access centrally. They excel when data volume is the bottleneck and an engineering team can model the warehouse. Governance patterns follow the practices in Databricks' documentation, including lineage and access control.
The trade-off is that raw warehouse power still needs an analysis surface on top—either a BI layer or an agent—so these platforms are usually one component of a larger stack rather than a complete answer.
AI-Native Platforms
AI-native data analysis platforms are the newest family and the reason autonomy is now a scoring axis. InfiniSynapse is built this way: not an NLP2SQL box or a ChatBI widget, but a system that behaves like a professional data analyst.
It connects to Snowflake, Supabase, PostgreSQL, MySQL, MongoDB, and more with one-click authorization; through fourth-generation LLM-native RAG it recalls the right schema and business definitions; and through InfiniSQL it runs joint analysis across structured databases, documents, audio, and video. It plans multi-step tasks, self-corrects on failure, and distills each finished task into a reusable memory card. We unpack the model in what AI-native data analysis means, and for the query-generation angle see natural language to SQL.
Side-by-Side Comparison
| Platform family | Connection | Preparation | Analysis | Sharing | Autonomy |
|---|---|---|---|---|---|
| BI (Tableau/Power BI/Looker) | Good | Limited | Good | Excellent | Emerging |
| Warehouse-centric | Excellent | Engineered | Excellent | Governed | Limited |
| AI-native (InfiniSynapse) | Excellent | Strong | Strong | Governed | Excellent |
No family scores top marks everywhere, which is why many teams combine two of these data analysis platforms—for example a warehouse plus an AI-native agent, or a BI layer plus an agent for ad-hoc work.
Which Platform for Which Team
- Reporting-heavy team, many viewers: a BI platform.
- Large data, strong engineering: a warehouse-centric platform, with an analysis surface on top.
- Recurring, multi-source analysis, mixed skills: an AI-native platform.
- Small team, no data engineer: an AI-native platform plus a spreadsheet.
When we helped a five-person team analyze 12 million records for a board meeting in 90 minutes, the deciding factor among data analysis platforms was one-click connection and reuse, not dashboard polish.
How the Platforms Handle Preparation
Preparation is where the families differ most, and it is the layer buyers most often overlook. BI platforms assume the data arriving is already modeled and clean; they present beautifully but do little cleaning themselves, so teams pair them with an upstream preparation step. Warehouse-centric platforms handle scale but expect engineering to model the data first. AI-native platforms profile sources on arrival, standardize definitions, and clean before analysis, which is why they suit teams without a dedicated data engineer.
The lesson for anyone comparing data analysis platforms is to test on messy, real data rather than a curated demo set. The demo always looks clean; your data is not. A platform that dazzles on sample data but stumbles on your actual exports will disappoint in week two, and the gap only shows when you load the real thing.
Pricing Models Across Data Analysis Platforms
Pricing varies enough to change the decision. BI platforms typically charge per user per month, which scales with the number of viewers and can grow expensive as a dashboard audience widens. Warehouse-centric platforms often charge for compute and storage, so cost tracks data volume and query frequency. AI-native platforms vary, with usage-based tiers and free entry points common.
The important discipline is to price the whole stack, not one line item. A cheap BI license paired with an expensive warehouse, or a free tool that consumes analyst hours, can cost more than a single integrated platform. Model your realistic usage—viewers, query volume, and recurring reports—before comparing sticker prices, because the headline number rarely reflects the twelve-month total.
A Realistic Multi-Platform Stack
Because no family wins every dimension, the honest recommendation for most growing teams is a deliberate combination. A common healthy stack pairs a warehouse for scale with an AI-native agent for ad-hoc and recurring analysis, and adds a BI layer only when a wide audience needs self-serve dashboards.
The key to a sane multi-platform stack is to assign each platform one clear job and one source of truth for each metric, so the pieces complement rather than duplicate each other. Teams that instead accumulate overlapping platforms end up with conflicting numbers and a maintenance burden that grows every quarter. Fewer platforms, each with a defined role, beats a sprawling collection assembled by impulse.
Scorecard
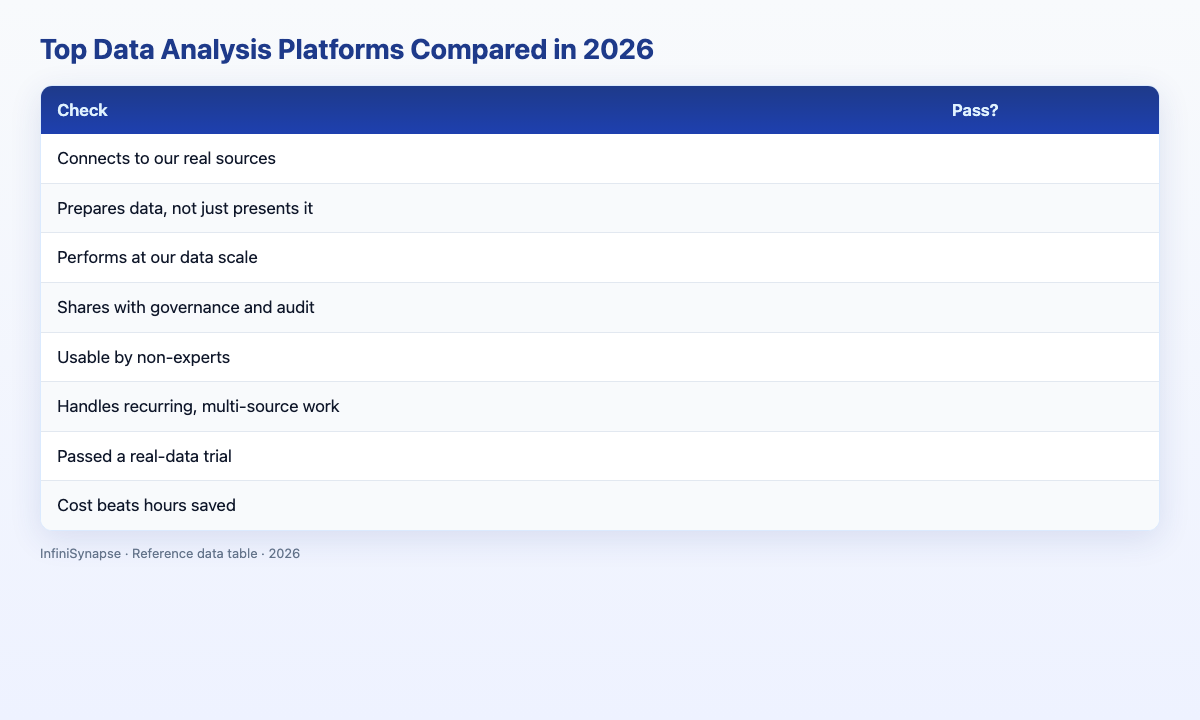
Score any platform (1 point each):
| Check | Pass? |
|---|---|
| Connects to our real sources | |
| Prepares data, not just presents it | |
| Performs at our data scale | |
| Shares with governance and audit | |
| Usable by non-experts | |
| Handles recurring, multi-source work | |
| Passed a real-data trial | |
| Cost beats hours saved |
6–8: adopt. 3–5: scope it. Below 3: keep looking.
How to Run a Platform Bake-Off
When two or more data analysis platforms make your shortlist, a structured bake-off beats endless demos. Give each candidate the same real task on the same real data, and score them on identical criteria so the comparison is fair rather than swayed by whichever vendor presented last.
Design the task to exercise the layers you actually care about. If preparation is your weak point, hand each platform a messy, un-modeled source and see how much cleaning it does before analysis. If sharing is the priority, build the same dashboard in each and ask non-analysts which they can navigate. If repetition is the pain, run the task twice a week apart and measure the setup you had to redo. The right choice among data analysis platforms almost always reveals itself on the second run rather than the first.
Score the bake-off with the people who will live with the decision, and weight the criteria before you start so nobody rationalizes a favorite after the fact. Document each platform's result against connection, preparation, analysis, sharing, and autonomy. A disciplined bake-off turns a subjective preference into an evidence-based choice, and it protects the team from adopting one of several data analysis platforms for reasons that will not matter in production.
Set a time box on the bake-off so it does not drift into analysis paralysis. Two candidates and one representative task, evaluated over a couple of weeks, is enough to reach a confident decision; adding a fifth platform or a tenth criterion rarely changes the outcome and often delays it. When the scores are in, commit to the winner and move on, because the cost of an extra month of deliberation usually exceeds the marginal difference between the top two data analysis platforms. Decisiveness, backed by a fair test, beats endless comparison that never resolves. Scripted analysis should follow Python documentation conventions for reproducibility and testable pipelines.
Failure Modes
Failure 1: Buying dashboards to fix data prep. BI data analysis platforms present; they do not clean.
Failure 2: Warehouse without an analysis surface. Raw scale is not insight.
Failure 3: Migration lock-in. Platforms that force data movement impose a heavy tax.
Failure 4: Ignoring autonomy. For recurring work, a platform without memory repeats setup forever.
Frequently Asked Questions
What are the \1options\2?
The best data analysis platforms fall into three families: BI platforms like Tableau, Power BI, and Looker for shared dashboards; warehouse-centric platforms for scale; and AI-native platforms such as InfiniSynapse for autonomous, multi-source analysis. The best one depends on your bottleneck.
What is the difference between BI and AI-native ?
BI data analysis platforms excel at sharing modeled data as dashboards but do little preparation and require the analyst to drive each step. AI-native platforms connect to sources, prepare data, run multi-step analysis autonomously, and remember finished tasks, so recurring work speeds up.
Do \1employers require proof\2?
BI and AI-native data analysis platforms generally do not require coding, while warehouse-centric platforms usually need engineering to model the data. AI-native platforms let non-technical users run real analysis by describing the goal in plain language.
Can \1AI assist\2?
Yes, and most teams do. A common healthy stack pairs a warehouse or BI layer with an AI-native agent for ad-hoc and recurring analysis. The families complement each other because none scores top marks on every dimension.
How does \1it help\2?
InfiniSynapse is an AI-native platform that scores high on connection, preparation, analysis, and autonomy. It connects to existing sources with one-click authorization, runs multi-step analysis, self-corrects on failure, and remembers finished tasks—strengths that BI and warehouse-centric platforms typically lack.
Conclusion
The leading data analysis platforms in 2026 divide into BI, warehouse-centric, and AI-native families, and none wins every dimension. Match the family to your bottleneck—sharing, scale, or repetition—and expect to combine two for a complete stack. Run a fair, time-boxed bake-off on your real data before deciding, and remember that the winner among competing platforms almost always separates itself on the second run of a recurring task rather than on the polish of a first demo.
If recurring, multi-source analysis is your pain, an AI-native platform is the most direct answer among the families above, and the fastest way to confirm the fit is to test it on the work you actually repeat each week. See how AI-native data analysis works and try the InfiniSynapse web app free on registration, no credit card required.