Augmented Analytics: Definition + 4 Pillars
Augmented analytics is the use of machine learning and natural language to automate data prep, insight discovery, query generation, and narrative drafts—while a human analyst still approves what gets published. It sits between static BI and fully autonomous agents. This page gives the definition, the four pillars, a tools and vendors map, and three use cases. It is not a price list and not a market-size report. Category framing still matches IBM's overview.
By the InfiniSynapse Data Team — analytics engineering, data platform, and LLM-security reviewers who run these pilots on production warehouses. Published: 2026-06-23 · Last updated: 2026-09-15 · Next review: 2026-12-15 Drafted by an analytics engineer (semantic layers / metric contracts on Postgres, Snowflake, BigQuery); scorecard reviewed by a data platform engineer; governance by an LLM-security reviewer. Roles, corrections policy, re-run log: editorial standards. The 0–2 buyer scorecard is published with pass criteria and a blank scoring sheet (CC BY 4.0) so you can score any vendor—including us—without our product.
Editorial independence: no paid placement, no affiliate links, no sponsored vendor seats. Capability claims link to vendor docs or independent review platforms.
External validation status. Third-party endorsements / research (not our pilot numbers): Gartner Peer Insights, G2 BI, BARC research, IBM overview. Standards: NIST AI RMF, OWASP LLM Top 10. Public HTTPS assets: blank scorecard CSV, hero, pillars chart, scorecard heatmap, rollout timeline. First-party pilots below are de-identified and unaudited—treat magnitudes as hypotheses (Independent Signals).

Disclosure: InfiniSynapse publishes this guide and sells an AI-native Data Agent in the AI-native archetype below. No vendor paid for inclusion or wording; no vendor reviewed this draft. Criteria apply to us as well as Power BI, Tableau, ThoughtSpot, Snowflake, or Databricks. Where a copilot or warehouse-native tool is the better fit, this page says so.
Table of Contents
- TL;DR
- What is augmented analytics? (definition)
- Related Categories
- Augmented vs AI-Native
- Four Pillars and Capabilities
- Buyer Scorecard
- Independent Signals
- Tools and vendors
- Use cases
- 30 / 60 / 90-Day Rollout
- Governance and Failure Modes
- FAQ
- References
- Conclusion
TL;DR
Canonical answer: Augmented analytics uses machine learning and natural language to automate insight discovery, query generation, and narrative explanation—while keeping a human analyst in the loop for review and sign-off. It sits between static BI dashboards and fully autonomous Data Agents. The platform layer for that autonomous path is an ai native data platform.
Who this is for: BI leaders, analytics managers, and procurement evaluating these platforms in 2026.
What you'll learn: the augmented analytics definition; the four pillars; how tools and vendors map; three use cases; when analyst-assist beats full autonomy; a 30/60/90 rollout with governance checkpoints.
Hands-on basis: We build InfiniSynapse and run the same pilots on production warehouses; competitor scores come from public vendor docs plus the same six-dimension sheet. Analyst framing such as IBM's overview still holds: NL access to executive metrics fails when queries compile against raw schemas instead of shared metric contracts. Cluster hub: AI for Data Analysis.
What is augmented analytics? (definition)
Citable definition: Augmented analytics applies ML and NLP to automate data preparation, insight discovery, query generation, and narrative explanation—while preserving human review, metric governance, and auditability for production decisions. That is the definition this page uses in every later section.
Four non-negotiable properties:
| Property | Meaning |
|---|---|
| Automation | ML surfaces patterns, anomalies, suggested queries |
| Natural language | Users ask in business vocabulary |
| Human-in-the-loop | Analysts approve, edit, or reject before publication |
| Governance | Metrics, access, and lineage remain enforceable |
Augmented analytics is not autonomous analytics. Augmentation accelerates analyst work; autonomy executes multi-step plans with minimal per-step prompting. See AI-Native vs Augmented analytics.
Why buyers care in 2026: three forces pushed augmented analytics from curiosity to procurement—self-serve demand without ticket queues; LLMs make SQL/narratives plausible so the bottleneck is governance; teams need vocabulary to separate copilots from a data agent.
| Symptom without augmentation | What breaks |
|---|---|
| Analysts buried in ad-hoc SQL | Strategic work stalls |
| Executives distrust black-box answers | NL pilots never leave demo |
| Same metric, three definitions | AI amplifies confusion |
| No audit trail on AI queries | Compliance blocks production |
Terms this page uses: metric contract = versioned named metric (grain, filters, owner) NL compiles against; semantic layer = shared modelling tier for contracts, joins, access; analyst approval gate = tooling that blocks publish until a named reviewer signs off (policy alone is not a gate).
Related Categories
| Category | Primary problem | Relationship |
|---|---|---|
| Traditional BI | Governed reporting of known questions | Consumption layer augmentation sits on |
| Self-service analytics | Access without a ticket | Organisational goal; augmentation is one safe path |
| Augmented analytics | Speed/coverage of ad-hoc analysis under review | This page's subject |
| Data mesh | Domain ownership of data products | Supplies governed products NL compiles against |
Practical read for buyers: mesh decides who owns data, semantic layer what a metric means, this category how fast a reviewed answer appears, BI where executives read it. Skip the middle two and board packs disagree.
Augmented vs AI-Native
| Dimension | Augmented analytics | AI-native analytics |
|---|---|---|
| Trigger | User asks; system assists | User states goal; agent plans |
| Memory | Session or project context | Durable workflow memory |
| Failure handling | Returns draft; waits | Reroutes and self-corrects |
| Audit | Often final artifact only | Full SQL and reasoning trail |
| Best fit | Analyst-heavy, governed BI | Recurring operational reporting |
Choose augmented analytics when analysts must approve every number, the stack is BI-centric with strong semantic models, and change management must stay low. Move AI-native when the same weekly questions consume analyst hours and reviewers need replayable logs.
Four Pillars and Capabilities
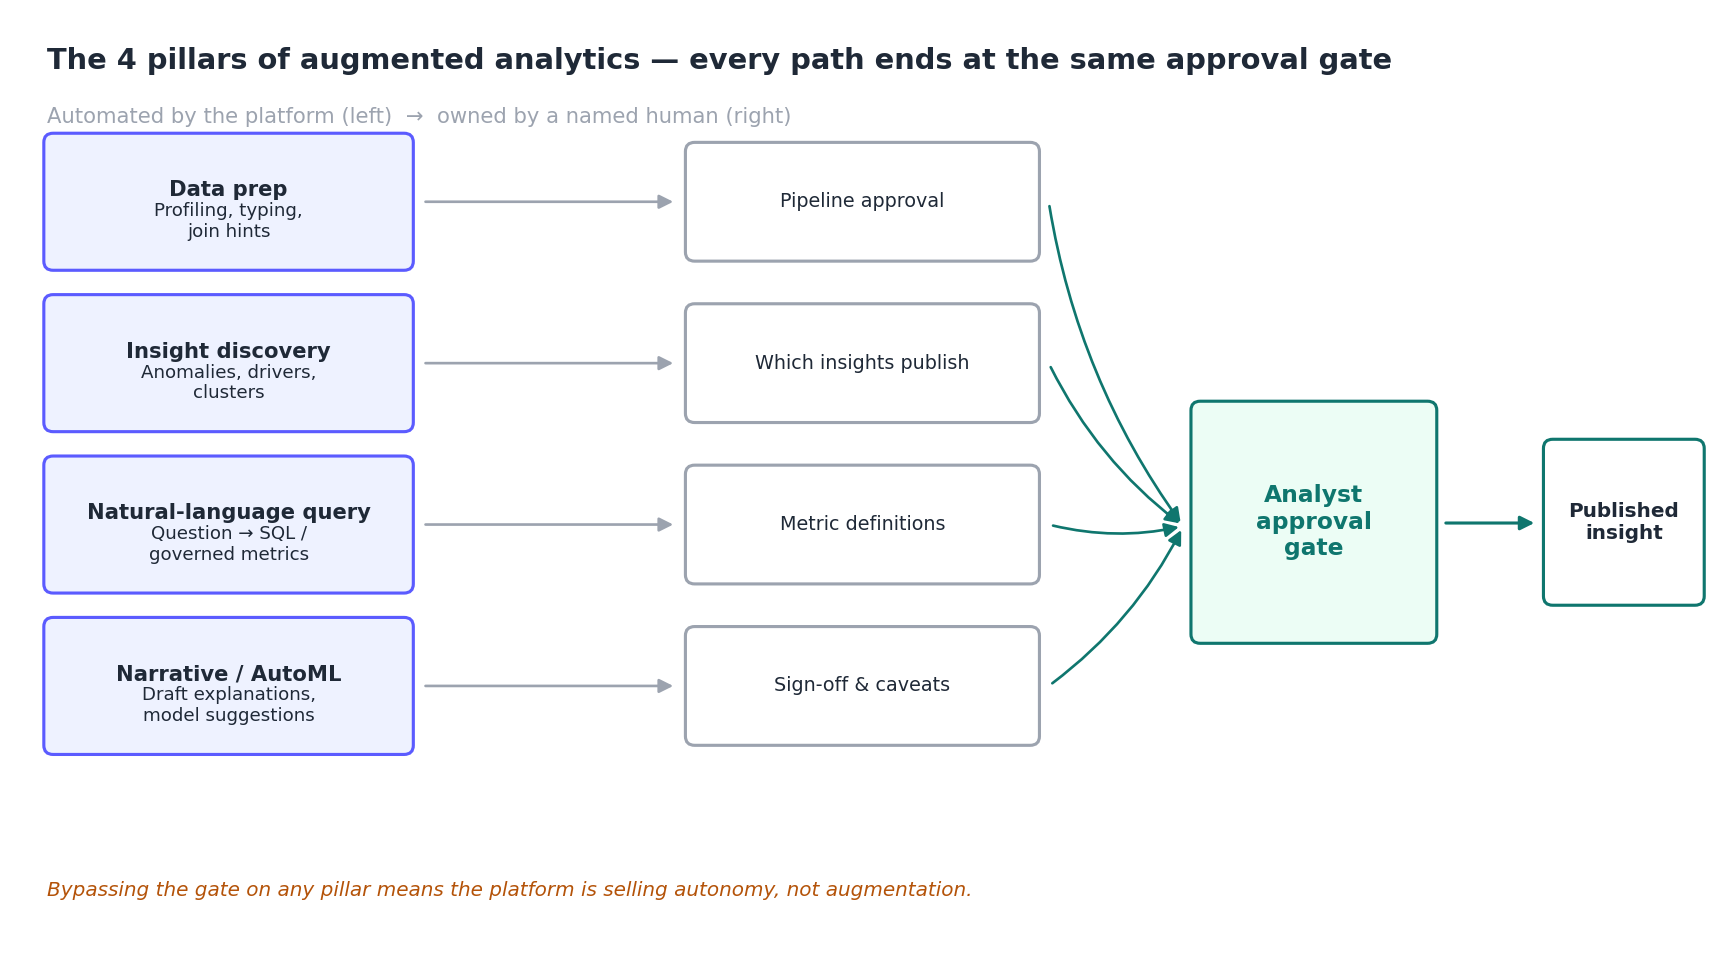
Canonical answer: Augmented analytics combines four automations—data prep, insight discovery, NL query, and narrative/AutoML assists—while humans stay accountable for publication.

Figure 1 — All four pillars terminate at the same analyst approval gate. A platform that bypasses that gate is selling autonomy, not augmentation.
| Pillar | Automates | Human still owns |
|---|---|---|
| Data prep | Profiling, typing, join hints | Pipeline approval |
| Insight discovery | Anomalies, drivers, clusters | Which insights publish |
| NLQ | Question → SQL/metrics | Metric definitions |
| Narrative / AutoML | Draft explanations, model suggestions | Sign-off & caveats |
Treat “Gartner-aligned” claims as marketing unless they map to these pillars with audit evidence. Agentic end-state: Agentic analytics.
Six capability areas to score: automated insight discovery; natural-language query with explain metadata; smart data prep (human validates before pipelines); narrative generation (edit before regulated distribution); embedded recommendations; collaboration and lineage. Align production rollouts with the NIST AI Risk Management Framework. When a vendor calls the same pattern self-service, use the self-service analytics platform comparison on your metrics before you treat the demo as proof. Lakehouse grounding: Databricks docs.
Buyer Scorecard (published protocol)
Score each dimension 0–2 when evaluating vendors. We publish criteria so you can reach a different conclusion than we did using our own protocol.
| Dimension | Pass signal | Fail signal |
|---|---|---|
| Metric grounding | Compiles against governed definitions | Raw schema dump only |
| Explainability | Shows SQL + reasoning | Black-box paragraph |
| Human workflow | Draft → review → publish | Auto-send to executives |
| Access control | Role rules at query time | Post-hoc filtering |
| Integration | Works with existing BI/warehouse | Rip-and-replace required |
| Audit trail | Replay any AI-generated query | No logs after session |
| Score | Meaning |
|---|---|
| 0 | Absent, or services-only |
| 1 | Partial—works on modelled data, breaks on your ad-hoc case |
| 2 | Works unattended on your schema; evidence inspectable on screen |
Run three questions on your data: one governed executive metric, one ad-hoc cut across an unmodelled join, and the governed metric re-asked two weeks later. Below 8/12 usually means heavy custom modelling before production trust.

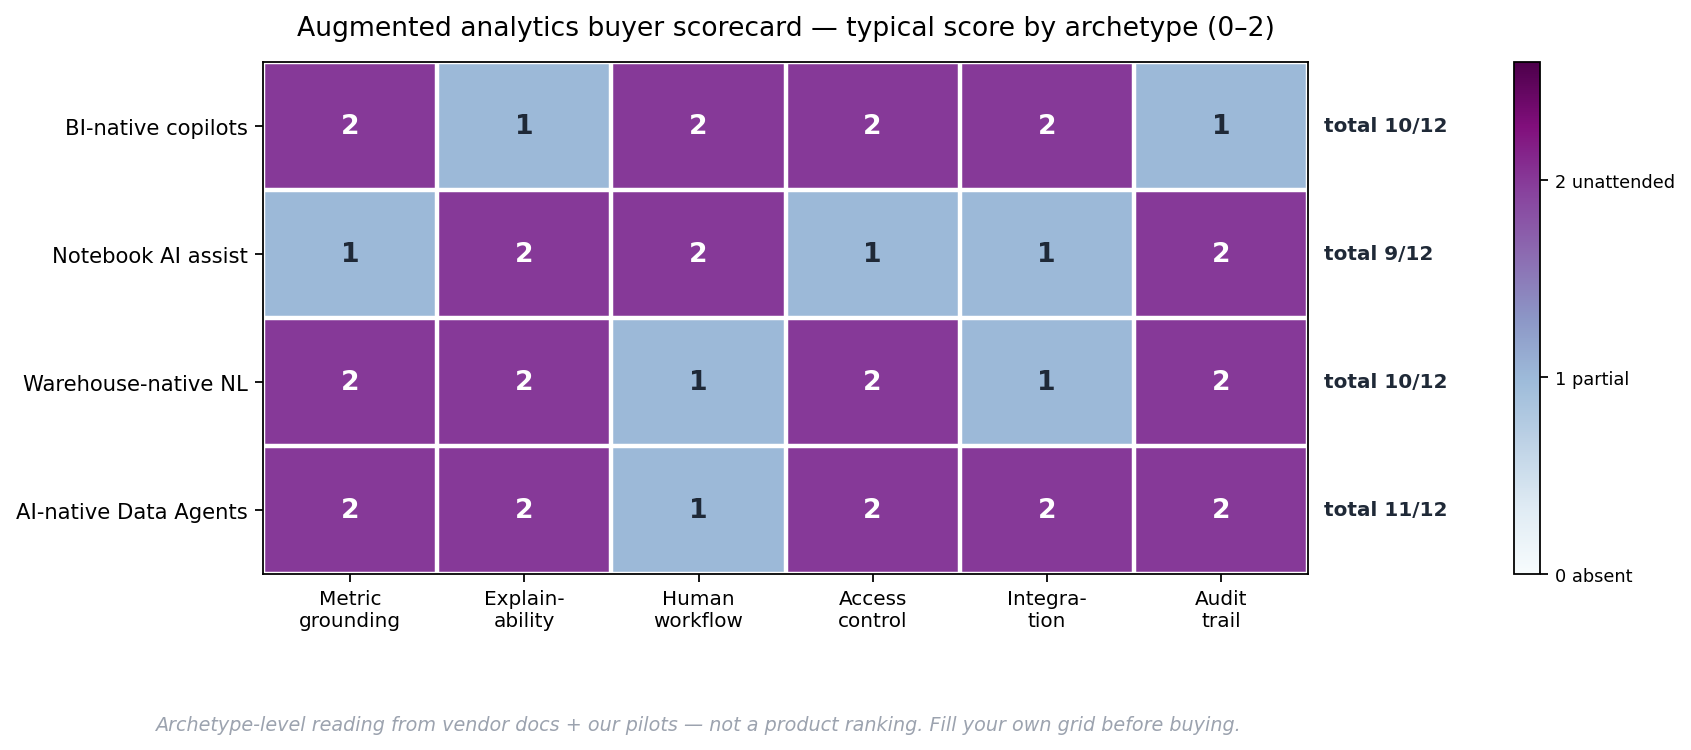
Figure 2 — Typical augmented analytics scores by archetype from public docs plus our pilots—not a product ranking. A well-modelled BI copilot beats a badly configured agent on every row.
| Archetype | Grounding | Explain | Human | Access | Integration | Audit | Total |
|---|---|---|---|---|---|---|---|
| BI-native copilots | 2 | 1 | 2 | 2 | 2 | 1 | 10 |
| Notebook AI assist | 1 | 2 | 2 | 1 | 1 | 2 | 9 |
| Warehouse-native NL | 2 | 2 | 1 | 2 | 1 | 2 | 10 |
| AI-native Data Agents | 2 | 2 | 1 | 2 | 2 | 2 | 11 |
Caveats: grounding assumes a semantic model/catalog already exists; the AI-native row includes our product class—your filled sheet matters more than our totals.
Download: augmented-analytics-buyer-scorecard.csv — dimensions, 0/1/2 criteria, blank finalist rows, 30/60/90 checklist. CC BY 4.0.
Independent Signals
A vendor scoring its own category is weak evidence. For Authority, balance our scorecard and pilot patterns with sources InfiniSynapse does not control:
| Signal | Good for | Where |
|---|---|---|
| Peer reviews | Ease of use, support, renewal (sample-size sensitive) | Gartner Peer Insights, G2 BI |
| Analyst research | Category definitions you did not write | BARC research, IBM overview |
| Security baselines | Defensible NL on production schemas | OWASP LLM Top 10, NIST AI RMF |
| Vendor primary docs | Limits and licensing tiers | Power BI Copilot, Snowflake Cortex Analyst, Databricks |
| Public protocol | Re-score any vendor without our product | Blank scorecard CSV (HTTPS) |
Snapshot review platforms on your evaluation date; record count alongside the score. We do not reprint scraped star ratings.
Gap we could not close: pilot outcomes and archetype totals are first-party and unaudited—no commissioned independent audit of our filled sheet. That is why the blank CSV and third-party signals sit above any InfiniSynapse number.
Augmented analytics tools and vendors
Augmented analytics tools, software, and platforms are the same four archetypes—not a single ranked list. Software is the product you license; a platform is that product plus the BI or warehouse it sits on. The market spans these families (primary docs linked):
| Archetype | Examples | Strength | Limit |
|---|---|---|---|
| BI-native copilots | Power BI Copilot, Tableau Pulse, Looker Gemini | Low adoption friction | Bounded to vendor stack |
| Notebook AI assist | Hex, Mode, Databricks notebooks | SQL + Python flexibility | Weak executive self-serve outside notebooks |
| Warehouse-native NL | Snowflake Cortex Analyst, Databricks Genie, BigQuery | Data gravity | Single-platform scope |
| AI-native Data Agents | InfiniSynapse and peers | Recurring operational workflows | Needs metric governance upfront — our archetype; treat as hypothesis |
Side-by-side tool map: Best AI Tools for Data Analysis.
Augmented analytics use cases
These augmented analytics use cases are de-identified patterns from engagements we ran in 2026—not audited case studies and not vendor demo scripts. Customer names and schemas never appear publicly (editorial standards).
| Team | Starting pain | Intervention | 60-day outcome |
|---|---|---|---|
| B2B SaaS finance | 3 conflicting “ARR” definitions | 12-metric contract + NL on semantic layer | Board pack ARR variance → 0; ad-hoc SQL tickets −34% |
| Retail ops | Promo postmortems: 2 analysts × 1.5 days | Anomaly scan + narrative drafts with approval gate | Median first reviewed insight 22 → 9 minutes |
| Healthcare analytics | NL pilot blocked by compliance | Audit log + RLS at compile | Pilot unblocked; 100% published answers had SQL evidence |
Sample sizes are small (single-digit engagements per pattern), first-party, and unaudited. Treat direction as informative; magnitude as hypothesis. Reproduce on your stack: before you turn any feature on, baseline for 30 days (ticket count, median time-to-reviewed-insight, BI vs NL variance on five executive metrics, share of answers with inspectable SQL); re-measure at day 60. Contradicting data: zhuhl@infinisynapse.com—logged on editorial standards.
Augmented analytics ROI is usually time recovered plus fewer executive rework cycles—not “AI magic.”
Implementation: 30 / 60 / 90-Day Plan

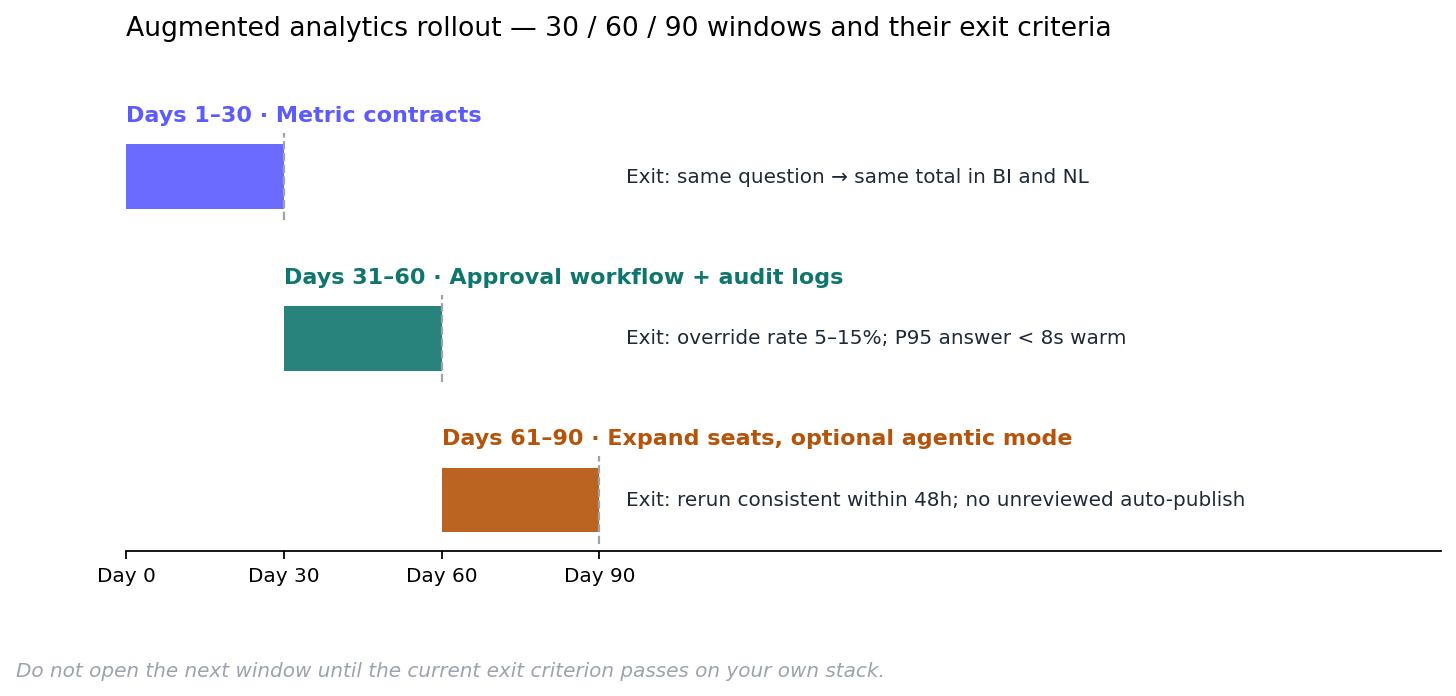
Figure 3 — One measurable exit criterion per window. Do not start the next until the current passes.
| Window | Focus | Exit criteria |
|---|---|---|
| Days 1–30 | 5–10 executive metrics; NL wired to governed definitions | Same question → same total in BI and NL |
| Days 31–60 | Analyst approval workflow; audit logs on | Override rate 5–15%; P95 answer < 8s on warm cache |
| Days 61–90 | Expand seats; optional agentic mode for recurring jobs | Rerun consistency within 48h; no unreviewed auto-publish |
Pattern A — BI copilot first: fastest path when semantic models are mature. Pattern B — Hybrid: analysts explore with augmentation; ops use Data Agents for scheduled reporting—shared metric definitions prevent divergent numbers. Before buy: three executive metrics, same question via BI and vendor NL, diff SQL/totals (zero variance on governed metrics), rename one column to confirm loud failure. Account for OWASP LLM Top 10 risks when connectors expose production schemas.
Governance and Failure Modes
| Risk | Mitigation |
|---|---|
| Wrong metric compiled | Bind NL to semantic layer |
| Prompt injection | Sandboxed execution, allow-listed tables |
| Data exfiltration | Row-level security at compile time |
| Unreviewed AI narratives | Mandatory analyst approval gate |
| Model drift | Version prompts; track accuracy weekly |
Common failures: demo on clean schema → benchmark real SCD tables; no metric council → govern ten executive metrics first; skipping analyst workflow → enforce draft → approve → publish in tooling; P95 latency > 8s → cache compiled metrics; treating augmentation as autonomy → no auto-publish before review gates; single-vendor lock-in → evaluate shared compile APIs/semantic layers.
InfiniSynapse note (vendor description): In our production pilots we span augmented and AI-native modes—analyst review every SQL/narrative, optional multi-step InfiniAgent, durable metric memory, full workflow audit. Customers often start with augmented analytics and graduate once governance stabilizes. Architecture depth: Data agent architecture. Hold us to your baseline numbers, not ours.
Frequently Asked Questions
What is augmented analytics?
Augmented analytics is software that uses AI to suggest insights, write queries, and draft explanations—while a human analyst approves what gets published. It sits between static BI and fully autonomous Data Agents.
What is the augmented analytics definition?
The augmented analytics definition is ML plus natural language that automates prep, insight discovery, query generation, and narrative drafts, with a human still signing off. Automation without that approval gate is autonomy, not augmentation.
What are augmented analytics tools, software, or platforms?
They fall into four archetypes: BI-native copilots, notebook AI assist, warehouse-native NL, and AI-native data agents. “Software” is the licensed product; a “platform” is that product plus the BI or warehouse it sits on. Score the sheet rather than picking a category slogan.
Who are the main augmented analytics vendors?
Typical names by archetype: Power BI Copilot, Tableau Pulse, and Looker Gemini; Hex and Databricks notebooks; Snowflake Cortex Analyst and BigQuery; plus agent vendors including us. Primary docs are linked in the tools section. This is a map, not a ranked league table.
What are augmented analytics use cases?
Three patterns we see: finance teams locking one ARR definition before NL; retail ops drafting promo postmortems with an approval gate; healthcare analytics unblocking an NL pilot with compile-time audit and RLS. Reproduce the baseline on your stack before treating magnitudes as targets.
How much does augmented analytics cost?
This page does not publish list prices. Seat, capacity, and copilot add-ons vary by vendor and are not comparable as a single number. Use the blank scorecard to compare TCO after a POC—not a homepage price tile.
What is augmented BI?
Augmented BI is augmented analytics sitting on the traditional BI consumption layer: the dashboard still exists; ML and NL draft the next question. BI remains where executives read the number. See AI-native vs augmented analytics if the pitch is full autonomy.
How is it different from AI-native or agentic analytics?
Augmented analytics keeps an analyst in the loop for every publish. AI-native/agentic systems plan multi-step work with durable memory and fuller audit trails. Chat-over-one-model tools sit closer to ChatBI than to agents.
Do I need a semantic layer?
For demos, no. For recurring executive metrics, yes—otherwise NL compiles against raw schema names and joins drift.
Can these tools replace data analysts?
No—they cut repetitive SQL and charting so analysts focus on interpretation and governance. See Will AI Replace Data Analysts?.
How do I run a fair POC?
One scenario, same schema, no coaching. One governed metric, one unmodelled ad-hoc cut, re-ask the governed metric two weeks later. Score finalists on the blank scorecard; refuse tuned demos vs untuned trials.
What security evidence should I require?
SOC 2 Type II or ISO/IEC 27001 plus contractual residency. Also: RLS at compile time, exportable audit logs tying numbers to queries, and a documented position on prompt injection mapped to OWASP LLM Top 10. Align with NIST AI RMF.
Does InfiniSynapse have a conflict of interest?
Yes. We publish this guide and sell an AI-native Data Agent. We publish scoring criteria rather than a verdict, name cases where BI copilots and warehouse NL win, and ship a blank scorecard. Prefer your filled sheet.
References
- [Standard] NIST. AI Risk Management Framework.
- [Standard] OWASP. Top 10 for LLM Applications.
- [Independent] Gartner Peer Insights. Analytics & BI Platforms.
- [Independent] G2. Business Intelligence.
- [Independent] BARC. Research.
- [Reference] IBM. What is augmented analytics?.
- [Vendor] Microsoft. Copilot in Power BI.
- [Vendor] Snowflake. Cortex Analyst.
- [Vendor] Databricks. Documentation.
- [Vendor] Hex. Documentation.
Authorship / corrections. Team byline (four reviewers). Category framing and the four-pillar augmented analytics model come from public analyst work plus our hands-on pilots. Archetype scores = primary vendor docs + first-party pilots, unaudited. Pilot outcomes are de-identified with limits stated above. Send filled scorecards, 60-day reproductions, or corrections to zhuhl@infinisynapse.com; logged on editorial standards. Scorecard/checklist: CC BY 4.0. Next review: 2026-12-15.
Conclusion
Augmented analytics in 2026 is the pragmatic middle path between static dashboards and fully autonomous agents. Score grounding, explainability, and human workflow before model brand names—vendors winning renewals are those whose outputs analysts can defend in a finance committee without reverse-engineering every total in a separate SQL editor.
Optional next step: After your five executive metrics are locked and the scorecard filled, test the audit-trail row in the InfiniSynapse web app—connect a warehouse read-only, ask one board question, inspect plan, SQL, and verification. Do this after the scorecard, not instead of it.