Agent Analytics: Measure Quality and Outcomes
By the InfiniSynapse Data Team · Last updated: 2026-09-23 · We build InfiniSynapse, an AI-native Data Agent platform. This guide defines agent analytics: how to measure agent sessions, quality, and business outcomes.
TL;DR
Agent analytics is the measurement layer for AI agents. It turns each user message, tool call, model reply, and session end into queryable events, scores those events for quality, and joins the result to conversion, retention, or revenue.
Who this is for: product managers, agent engineers, and analytics leads who already have traces and still cannot say whether the agent helped the user.
What you'll learn:
- A citable definition of agent analytics and how it differs from an analytics agent
- The event model, evaluator types, and three pilot KPIs
- A 30-day checklist you can copy into your warehouse
Agent analytics answers "did it work for the user?" A trace answers "what did the agent call?" Keep both. Do not replace one with the other.
Download the 30-day measurement checklist. Numbers in the chart below are illustrative teaching values, not a customer study.
What agent analytics is
Agent analytics decomposes an agent session into events that share the product's user identity, then attaches quality scores and downstream outcomes. Amplitude's Agent Analytics overview describes that split: observability stops at the trace, and the analytics layer continues into funnels, cohorts, and retention.
A citable definition
Citable definition: Agent analytics is the practice of logging agent interactions as events (user message, tool call, model response, session end), scoring them for task success and failure, and joining those scores to product outcomes on a shared user id.
Three properties make the practice measurable:
| Property | What you store | What you can ask |
|---|---|---|
| Events | One row per message, tool call, reply, or session end | Which step failed, and for whom? |
| Scores | Task success, tool error, safety, thumbs | Did quality move after a prompt change? |
| Outcomes | Conversion, retention, revenue, ticket deflection | Did a better session change the business result? |
Who should use it
Use agent analytics when an agent is in production and someone asks for a quality number that finance or product will accept. A demo transcript is not that number. A sampled trace review is not that number either, unless the sample is tied to the same user id as the rest of the product.
Teams buying agents that run analysis—plan, SQL, validate, narrate—should start on the agentic analytics hub. This page measures any agent, including a data agent, after it ships.
Agent analytics vs an analytics agent
The two phrases swap word order and swap jobs. Agent analytics is a measurement system. An analytics agent is a role: a system that plans data retrieval, runs governed queries, and returns a decision-ready result.
The role in one paragraph
An analytics agent is the worker. It decomposes a question, calls tools, checks grain, and writes the answer. Procurement tests for that role still belong with governed analysis programs on the agentic analytics hub: visible plans, metric versions, and replay. This URL no longer treats that role as its primary topic.
Where agentic analytics stays
Agentic analytics is the category for agents that perform analysis. Agent analytics is how you measure those agents, and every other agent you ship. Vendor shortlists stay on best agentic analytics tools for data analysis. Tool catalogs stay on agentic analytics tools.
Searchers who type agent analytics in 2026 meet measurement products: event models, evaluators, and outcome joins. They want a way to score a session. The analysis-plan category stays under agentic analytics.
Agent analytics vs LLM observability
LLM observability records spans: model calls, tool invocations, tokens, latency, and errors. That record is necessary. It is the raw material. Agent analytics is what you build when you need the record in the same query surface as product behavior.
Traces
A trace is a tree of spans for one run. OpenTelemetry traces are the portable way to emit that tree once and choose a backend later. Tracing tools answer which prompt, which tool, and which latency produced a bad step. They do not, by themselves, build a retention curve.
Product events
Agent analytics flattens the same run into events a product analyst can filter. Each user message, tool call, and reply is a row with user_id, session id, agent id, and a quality property. You then use the charts you already trust: funnels, cohorts, and retention.
| Question | Trace tool | Agent analytics |
|---|---|---|
| What did the agent call? | Span tree | Event, plus the span id |
| Did the task complete? | If you added an eval | Score on the session |
| Did that user convert? | Rarely joined | Same user_id as product events |
| Which prompt version regressed? | Diff two traces | Cohort by variant |
Google Cloud's BigQuery agent analytics takes the warehouse path: stream interaction events, query them with SQL, and reconstruct multi-turn traces for evaluation. That is agent analytics inside the warehouse, not a second product category.
The event model
Adopt one hierarchy and keep it stable. Agent analytics fails when every team names a different grain.
Four event types
| Event | Grain | Required properties |
|---|---|---|
| User message | One turn inbound | user_id, session id, text hash or redacted text, timestamp |
| Tool call | One invocation | Tool name, status, latency, error class |
| Model response | One reply | Model id, token counts, latency, safety flag |
| Session end | One conversation | Turn count, task-success score, outcome id if known |
Store the trace id on every row so an analyst can open the span tree after the chart. Do not store only the trace and hope someone decomposes it during a meeting.
Shared identity
The join key is the product user_id, not an anonymous agent session. Without it, agent analytics cannot attribute a resolved ticket, a purchase, or a retained user to the session that preceded it. Map the agent principal to the same identity graph the rest of the product uses before you turn on scoring.
Redact or hash free text before it lands in the warehouse. The OWASP Top 10 for LLM applications covers prompt injection and sensitive-data exposure. A quality dataset that copies customer secrets into an event table creates a new incident class.
Evaluators, signals, and scores
Events say what happened. Scores say whether it was acceptable. Agent analytics needs both, and it needs the score definition written down.
Task success and tool errors
Split automatic signals from human scores:
| Kind | Examples | Who owns the definition |
|---|---|---|
| Signal | Task completed, tool error, user retry, refusal | Platform, always on |
| Evaluator | Policy match, faithfulness, format | Product, calibrated |
| Human score | Thumbs, escalation, "wrong number" tag | Support or the user |
Task success is a session-level flag with a written rule. "The user did not send a follow-up" is a weak rule. "The requested tool returned a non-error and the user accepted the result" is a rule you can audit. Tool-error rate is tool failures divided by tool calls, not by sessions. Mixing those grains makes a prompt change look like a regression when traffic mix changed.
The NIST AI Risk Management Framework treats measurement as part of governing AI, not as a dashboard afterthought. Write the score rule next to the metric the way you write a KPI definition.
Human scores
Thumbs and tags are sparse. Use them to calibrate evaluators, not as the only quality number. If fewer than a few percent of sessions receive a thumb, a week-over-week thumbs rate will swing on noise. Pair it with task success and tool-error rate, which cover every session.
Offline eval sets still matter. They catch known failures before release. Agent analytics adds the unknown failures that only appear in production traffic. Inngest's outcome-scoring approach and Amplitude's evaluator model agree on that split even though they ship different products: a lab judge cannot see the purchase that happens later.
From quality to funnels and revenue
A quality score that never joins an outcome is a second observability tab. Agent analytics earns its name when a cohort of low task-success sessions shows a lower conversion rate than a cohort of high task-success sessions, on the same dates and the same entry intent.
Illustrative session
Practical example: the figures below are illustrative. They teach the join. They are not InfiniSynapse customer results.
A support agent handles order-status questions. For one session you store:
- User message: "Where is order 1842?"
- Tool call:
orders.lookup, status ok, 400 ms. - Model response: a delivery date.
- Session end: task success = 1.
- Outcome, two hours later: no support ticket. The
user_idmatches the session.
A second session calls the same tool, receives an error, replies with a guessed date, and is followed by a ticket. Task success = 0. The ticket id is the outcome.
Query shape: sessions in the last seven days, grouped by task-success flag, with the share that opened a ticket within 24 hours. If the two shares do not differ, the score rule is wrong or the outcome window is wrong. Fix the rule before you add more evaluators.
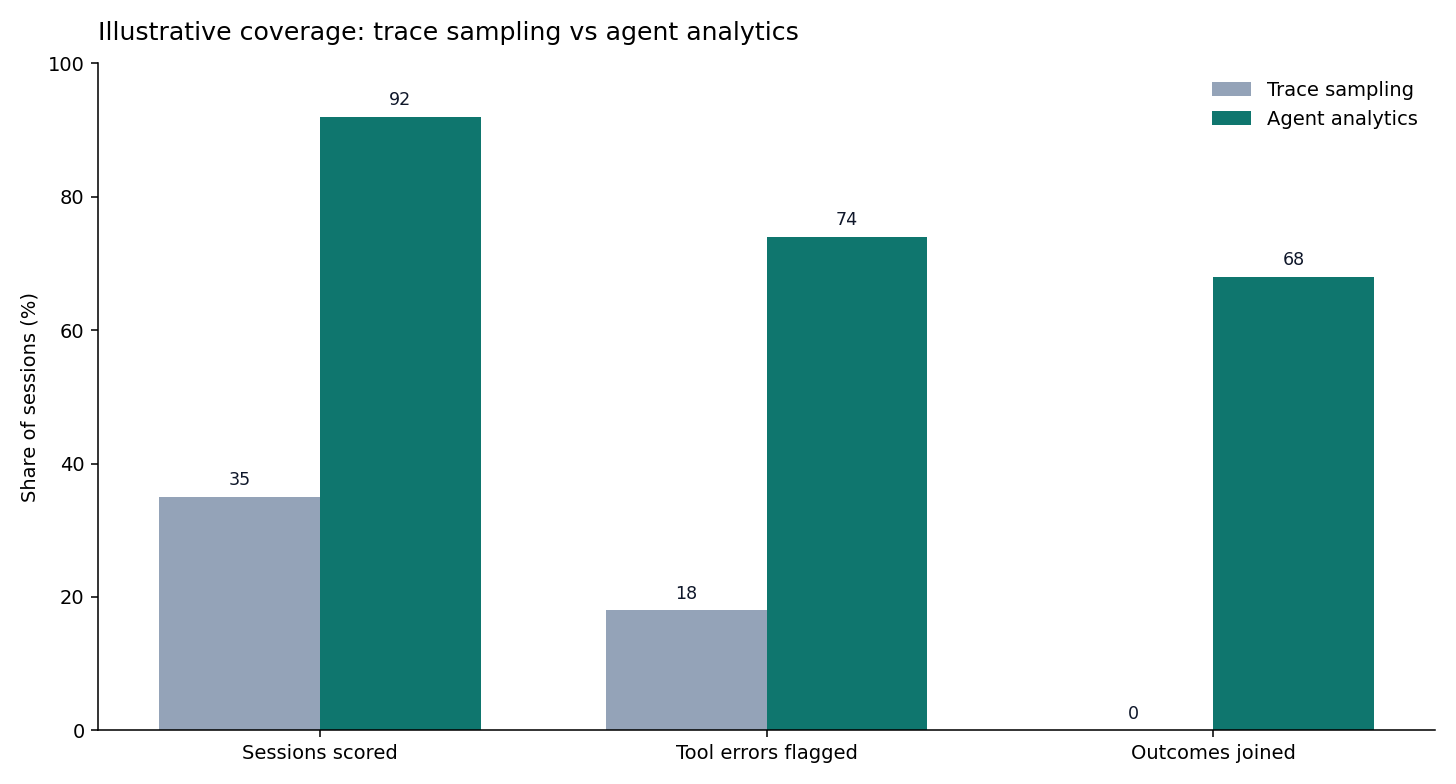
The chart compares three coverage metrics across two methods. Trace sampling leaves outcomes unjoined. Agent analytics scores sessions and joins the outcome on user_id. Read the bars as a teaching picture of coverage, not as a benchmark of any vendor.
Three KPIs
Track these three before you add a dozen LLM-as-judge metrics. Service-level thinking from the Google SRE book applies: one indicator for user success, one for errors, one for cost.
| KPI | Formula | First reading |
|---|---|---|
| Task success rate | Sessions with success = 1 / sessions | Did the agent finish the job? |
| Tool-error rate | Failed tool calls / tool calls | Are tools the bottleneck? |
| Cost per successful task | Token and tool spend / successful sessions | What does a good session cost? |
Review them weekly by agent id and prompt version. A drop in task success with flat tool errors points at the model or the prompt. A rise in tool errors with flat model latency points at a dependency. Cost per successful task rising while task success stays flat means you are paying more for the same completion.
Anomaly watches on those series belong with proactive insight and anomaly detection. The watch fires on the KPI. The trace explains the session.
A 30-day measurement checklist
Run agent analytics as a measurement pilot, not as a rip-and-replace of your tracer. The checklist file lists the owner, the grain, and the pass test for each row.
Days 1–10
Instrument the four event types for one agent. Confirm user_id matches a product table for at least 95% of sessions in a single day. Reject the pipeline if free text lands without a redaction flag. Pick the task-success rule and write it in the same document as the events.
Days 11–20
Backfill seven days. Compute task success rate, tool-error rate, and cost per successful task. Sample 25 sessions by hand and mark whether the automatic success flag agrees. If agreement is below 80%, change the rule and recompute. Do not ship the score to an executive page while the sample disagrees.
Days 21–30
Join one outcome: ticket created, purchase, or retained on day 7. Publish one cohort chart: task success high versus low, same intent, outcome rate beside it. Hold a 30-minute review with the agent owner. Decide whether the next change is a prompt, a tool, or a score rule. Record that decision next to the chart so the following week has a baseline.
InfiniSynapse customers who ship a data agent can use the same checklist. The events are the analysis steps the agent already logs. The outcome is the decision the stakeholder accepted, or the metric they rejected. We do not treat a fluent narrative as task success unless the numbers in it match the locked query.
Failure modes
Trace-only reviews. Teams read five bad spans a week and call it agent analytics. Fix: require a session-level score and a user id on every row you chart.
Judge-only quality. An LLM score says the reply "sounds helpful" while the tool returned the wrong order. Fix: pair the judge with tool status and an outcome. The BigQuery agent analytics evaluation path supports both deterministic checks and semantic checks for this reason.
No outcome join. Quality dashboards move and revenue does not. Fix: one outcome in the first 30 days, even if it is a coarse ticket flag.
Grain mix. Tool errors divided by sessions, next to tool errors divided by calls. Fix: print the denominator on the chart.
Unredacted prompts in the warehouse. Fix: hash or drop free text, and keep the span in a tighter store if engineers still need the raw prompt.
Title collision with the role. A page titled for an analytics agent will not rank for agent analytics, and it will confuse buyers. Keep the role paragraph above, and keep measurement in the title, the definition, and the checklist.
Frequently Asked Questions
What does agent analytics measure?
Agent analytics measures agent sessions as events, quality scores, and business outcomes on a shared user id. It measures whether the agent worked for the user, including task success, tool errors, cost, and a downstream result such as conversion or a ticket.
How is agent analytics different from a trace tool?
A trace tool stores the span tree for a run. Agent analytics turns that run into events you can use in funnels and retention, with a score and an outcome. Keep the tracer. Add the event layer when product or finance asks for a rate, not a screenshot of one bad session.
What is an analytics agent?
An analytics agent is a system that plans and runs analysis: retrieve data, validate it, and explain it. Agent analytics is how you measure that system, or any other agent. The category for agents that do analysis is agentic analytics.
Which three KPIs should a first pilot track?
Track task success rate, tool-error rate, and cost per successful task for 30 days on one agent. Add a single outcome join before you add more evaluators. The checklist in this guide is the row-level version of that pilot.
Conclusion
Agent analytics is the layer that connects agent behavior to a business result: events at a stable grain, scores with written rules, and one outcome joined on user_id.
Next steps:
- Log the four event types for one production agent.
- Score task success with a rule you can audit against 25 hand-labeled sessions.
- Join one outcome and read the three KPIs weekly.
- Return to agentic analytics when the agent you are measuring is itself an analysis system.
Measure the session the user had. Then decide whether the next change is the prompt, the tool, or the score.