Data Analysis with Python: A Worked Example (2026)
By the InfiniSynapse Data Team · Last updated: 2026-07-08 · We build an AI-native data analysis platform; this worked example shows data analysis with Python end to end, exactly as a practitioner would run it.
Table of Contents
- TL;DR
- The Example Setup
- Loading the Data
- Cleaning the Data
- Analyzing the Data
- Visualizing the Result
- Interpreting and Concluding
- How AI Complements This
- Why This Workflow Scales
- Example Scorecard
- Frequently Asked Questions
- Conclusion
TL;DR
Direct answer: analysis in Python works a real dataset through pandas end to end: load it into a DataFrame, clean it, analyze it by grouping and comparing, then visualize the result. This worked example shows the full cycle in code, demonstrating why Python's reproducibility and flexibility suit real analytical work.
Who this is for: anyone who learns analysis in Python best from a complete worked example.
What you'll learn: the setup, loading, cleaning, analyzing, and visualizing steps, and how AI complements the code approach.
This guide sits within the advanced methods hub; for getting started first, see python for data analysis.
For related depth in this pillar, see SQL Data Analysis: Patterns and Queries.
The Example Setup
To make analysis in Python concrete, this example works a realistic question: for an online store, which product categories drive the most revenue, and how has that shifted over the past year? This is the kind of question analysis in Python handles well, since it involves a moderately large dataset, some cleaning, and grouped analysis over time.
The value of a worked analysis in Python example is that it shows the actual sequence of operations rather than abstract description. We will move through loading, cleaning, analyzing, and visualizing in pandas, the workhorse library for analysis in Python. The general process mirrors the disciplined approach described in the Wikipedia overview of data analysis; what this example adds is showing how each stage is expressed in Python code, so the abstract process becomes a concrete, repeatable pattern you can adapt.
Loading the Data
Every analysis in Python project begins by loading data into a pandas DataFrame, typically from a CSV or database. A single function call reads the file into a structured table you can manipulate, and a first inspection, viewing the first rows, checking the column types, and counting rows, orients you to what you are working with. This loading and inspection step is the foundation of analysis in Python.
Inspection at this stage of analysis in Python surfaces the first surprises: columns that are not the type you expected, unexpected row counts, or obvious anomalies. A practitioner always pauses here to understand the data before proceeding, because assumptions made now shape everything later. This disciplined first look, easy to do in a notebook where results appear inline, distinguishes careful analysis in Python from code that rushes to a result on data it never actually examined, which is a common source of silent errors.
Cleaning the Data
Cleaning is where analysis in Python spends much of its effort, as it does in any analysis. In our example, inspection reveals duplicate order rows, a revenue column stored as text with currency symbols, and some missing category labels. Pandas handles each: dropping duplicates, converting the revenue column to a numeric type after stripping symbols, and deciding how to treat the missing categories. Predictive workflows should be interpreted against the Wikipedia machine learning overview.
Each cleaning decision in analysis in Python is expressed as code, which means the cleaning is documented and reproducible, a key advantage over manual spreadsheet cleaning. If the data updates, the same cleaning code reruns automatically. This reproducibility is one reason analysis in Python suits recurring analysis. The discipline here is the same as in any analysis: clean thoroughly and honestly before trusting the data, since even elegant analysis in Python produces wrong answers on dirty input, and the code makes the cleaning choices transparent for later review.
Analyzing the Data
With clean data, the analysis step of analysis in Python answers the question. In our example, we group the data by product category and sum revenue to find which categories contribute most, then group by category and month to see how each has trended over the year. Pandas expresses these grouped aggregations concisely, which is a core strength of analysis in Python.
The analysis reveals that while one category leads in total revenue, another has grown fastest over the year, a nuance the grouped analysis surfaces clearly. This is where analysis in Python shows its flexibility: the same few pandas operations, grouping, aggregating, and comparing, answer a wide range of questions. The example uses straightforward operations rather than anything advanced, illustrating that much valuable analysis in Python relies on core pandas skills rather than sophisticated modeling, applied thoughtfully to a well-framed question.
Visualizing the Result
Visualization completes the analysis in Python cycle by turning the grouped results into a chart that communicates the finding. In our example, a bar chart shows revenue by category, and a line chart shows each category's trend over the year, making the fast-growing category visually obvious. Matplotlib, called through pandas, produces these charts with a few lines of code.
Good visualization in analysis in Python follows the same principles as anywhere: choose a chart that fits the question, avoid clutter, and lead the viewer to the insight. Because the charts are generated in code, they regenerate automatically when the data updates, another reproducibility benefit of analysis in Python. The combination of concise analysis and code-generated visualization is what makes analysis in Python efficient for work that repeats, since the entire pipeline from raw data to finished chart reruns with a single command.
Interpreting and Concluding
The final step of this analysis in Python example is interpreting the result and drawing a conclusion. The finding, that a particular category is growing fastest even though another leads in total revenue, suggests the store should consider investing more in the fast-growing category before competitors do. Interpretation connects the analysis to a decision, which is the point of the whole exercise.
Honest interpretation in analysis in Python also means noting limitations: the trend is based on one year, external factors are not accounted for, and the analysis shows association rather than proving causation. Acknowledging these keeps the conclusion trustworthy. This complete arc, from a question through loading, cleaning, analysis, and visualization to an interpreted conclusion, is what a full analysis in Python project looks like, and adapting this pattern to your own questions is how the skill becomes genuinely useful. Scripted analysis should follow Python documentation conventions for reproducibility and testable pipelines.
How AI Complements This
In 2026, AI-native tools complement analysis in Python rather than replacing it. For this example's routine grouping and comparison, an AI-native agent could produce the same result from a plain-language question, without hand-written code. This frees a practitioner to reserve analysis in Python for the custom logic and modeling that agents do not cover.
InfiniSynapse illustrates this complement. It is not an NLP2SQL box or a ChatBI widget but a system that behaves like a professional data analyst, connecting to sources with one-click authorization and running analysis through InfiniSQL. An analyst might delegate the standard parts of this analysis in Python example to the agent and use Python for anything bespoke, or study the agent's approach to accelerate their own work. We explore the paradigm in what AI-native data analysis means, and the Stanford HAI AI Index documents this shift toward combining code with agents for the most efficient analytical workflow.
Why This Workflow Scales
The example above was small, but the great strength of data analysis with python is that the same workflow scales to far larger and more complex problems. The pandas operations that summarized a modest dataset apply unchanged to millions of rows, and the reproducible, code-based nature of data analysis with python means an analysis built once can run repeatedly as data updates. This scalability is a core reason teams adopt data analysis with python over spreadsheets.
Scaling data analysis with python also means growing in sophistication, not just size. The same workflow that produced a simple grouped summary extends naturally to statistical modeling and machine learning by adding libraries like scikit-learn, so data analysis with python grows with your questions rather than boxing you in. An analysis that starts as a descriptive summary can evolve into a predictive model without switching tools, which is a distinctive advantage of data analysis with python over more limited approaches.
Because data analysis with python is code, it also integrates into larger systems: an analysis can become a scheduled report, a data pipeline, or a component of an application. This composability means data analysis with python is not just for one-off investigations but for building durable, repeatable analytical capabilities. Teams that invest in data analysis with python find that their work compounds, since each reproducible analysis becomes an asset that can be rerun, adapted, and built upon. This combination of scale, sophistication, and composability is why data analysis with python has become the backbone of serious analytical work, and why the modest worked example above represents a pattern that extends to the most demanding real-world problems.
Example Scorecard
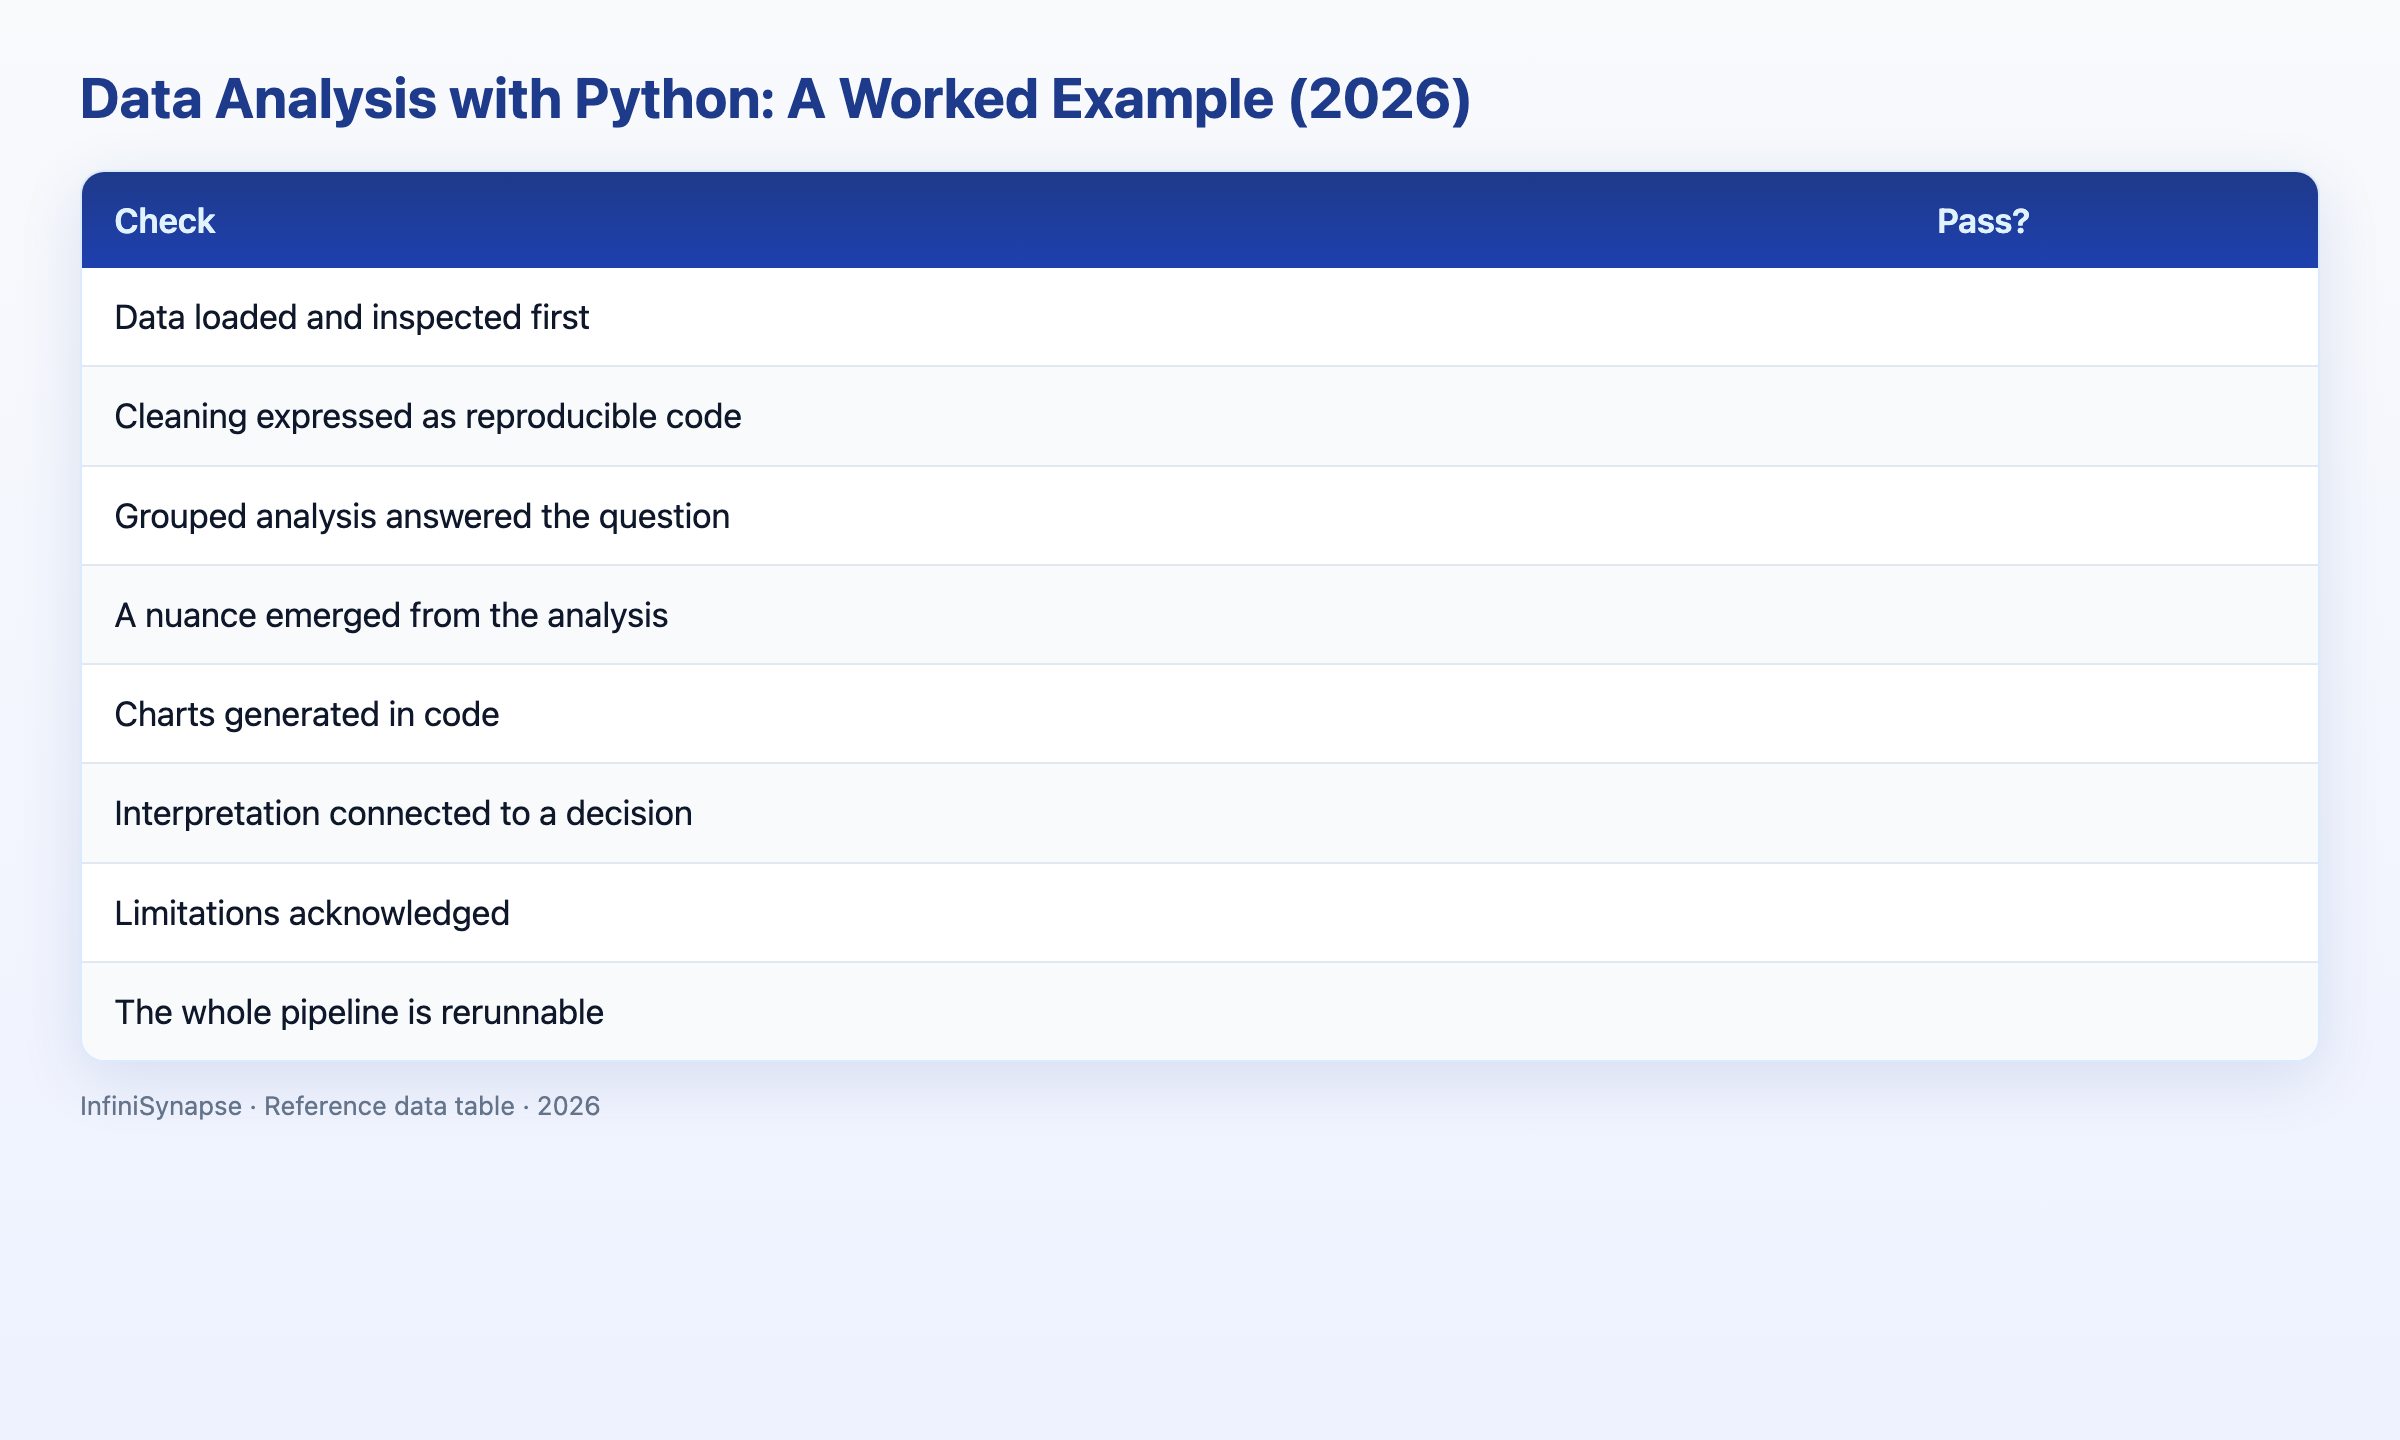
Check what this example demonstrates (1 point each): Query-first analysis aligns with concepts in the Wikipedia SQL overview.
| Check | Pass? |
|---|---|
| Data loaded and inspected first | |
| Cleaning expressed as reproducible code | |
| Grouped analysis answered the question | |
| A nuance emerged from the analysis | |
| Charts generated in code | |
| Interpretation connected to a decision | |
| Limitations acknowledged | |
| The whole pipeline is rerunnable |
6–8: you grasp the full cycle. 3–5: revisit a step. Below 3: reread the workflow.
Frequently Asked Questions
How do you do data analysis with Python?
Data analysis with Python works a dataset through pandas end to end: load it into a DataFrame, inspect and clean it, transform and group it to answer a question, then visualize the result with matplotlib and interpret it. Because every step is code, the entire analysis is reproducible and reruns automatically when the data updates.
What library is used for data analysis with Python?
Pandas is the primary library for data analysis with Python, providing the DataFrame structure and the operations for loading, cleaning, filtering, grouping, and joining data. Matplotlib handles visualization, NumPy underpins numerical work, and scikit-learn and statsmodels add machine learning and statistics when a question requires them.
Is formal training worth it\1?
Data analysis with Python requires learning to program, but the core workflow relies on a manageable set of pandas operations rather than advanced techniques. Much valuable analysis uses straightforward grouping, filtering, and aggregation. Focusing on these core skills and practicing on real datasets makes data analysis with Python approachable for motivated beginners.
What is the workflow ?
The workflow for data analysis with Python is: load data into a pandas DataFrame, inspect and clean it, transform and filter it to focus on the question, group and aggregate to find the answer, visualize the result, and interpret it. Working in a notebook lets you run each step and check results before moving on.
Can \1AI assist\2?
AI-native tools complement rather than replace data analysis with Python. They can produce routine grouping and comparison from a plain-language question, freeing practitioners to reserve Python for custom logic and modeling agents do not cover. The efficient approach combines agents for routine work with hand-written code for the bespoke.
Conclusion
This worked example showed analysis in Python end to end: loading and inspecting a dataset in pandas, cleaning it as reproducible code, grouping to answer the question, visualizing the result, and interpreting it toward a decision. The pattern adapts to countless questions, and in 2026 AI-native agents complement it by handling the routine parts.
The enduring value of data analysis with python is that this same pattern scales from a small worked example to the most demanding real problems. Once you can perform data analysis with python on one dataset, you can apply data analysis with python to almost any question, since the workflow, load, clean, analyze, visualize, interpret, stays constant. Practicing data analysis with python on your own questions is how the pattern becomes second nature, and pairing data analysis with python with an AI-native agent for the routine parts lets you focus your coding effort where it genuinely matters most.
To see how agents complement code, read what AI-native data analysis means and try the InfiniSynapse web app free on registration, no credit card required.